Introduction
Welcome to the world of Google Sheets, where data organization and analysis are made easy. One powerful feature that sets Google Sheets apart from other spreadsheet software is the ability to add colors to cells and sort data based on those colors. Sorting by color can help you quickly identify and analyze data points based on their visual representation.
In this article, we will explore how to sort by color in Google Sheets. Whether you are using Google Sheets for personal or professional purposes, this feature can streamline your workflow and make data analysis more efficient.
Sorting by color allows you to categorize and prioritize data based on your customized color scheme. By visually differentiating data points, you can easily highlight important information, identify trends, and make data-driven decisions.
Understanding how to add color to cells, sort by color, and reset color sorting will open up new possibilities for organizing and analyzing data in Google Sheets. So, let’s dive in and discover how to harness the power of color sorting in Google Sheets.
Understanding the Need to Sort by Color
The ability to sort data by color in Google Sheets provides a visual representation that enhances data analysis and interpretation. Colors can be used to indicate different categories, highlight trends, or emphasize specific data points. By sorting data based on color, you can easily identify patterns, outliers, or specific criteria that meet your analysis goals.
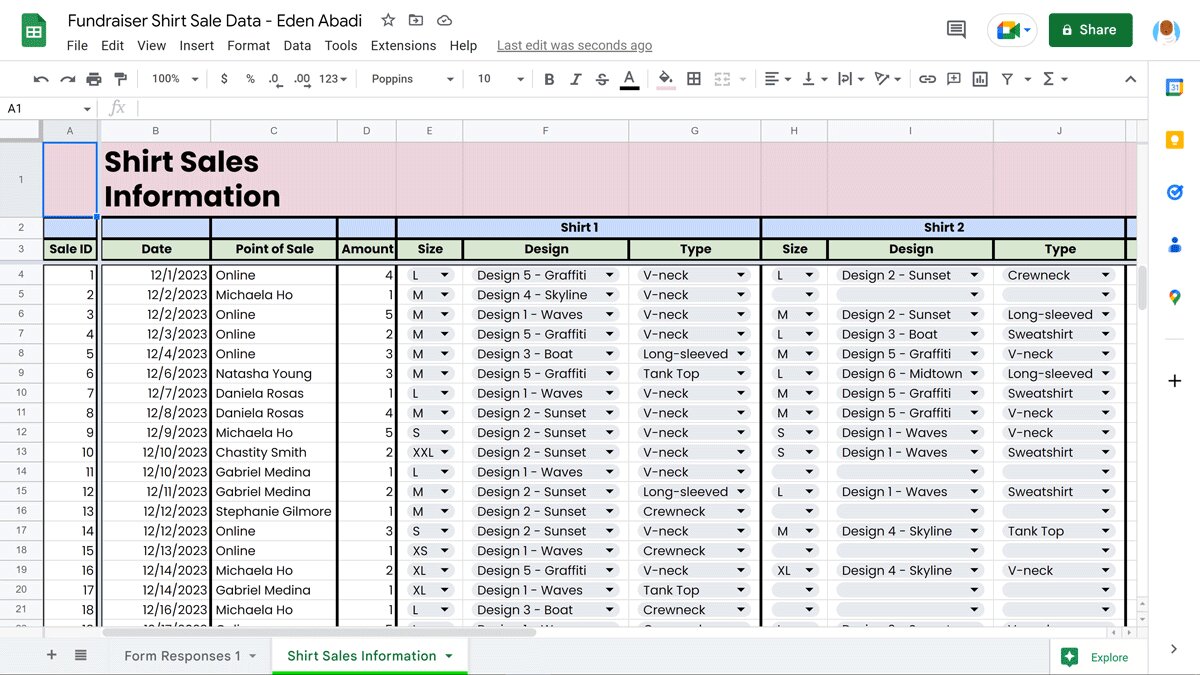
One common scenario where sorting by color is useful is when dealing with categorical data. For example, imagine you have a spreadsheet containing sales data for different products. By assigning different colors to each product category, such as red for electronics and blue for clothing, you can quickly sort the data to see the performance of each category at a glance.
Sorting by color can also be beneficial in situations where you want to focus on specific data points. For instance, if you have a spreadsheet tracking project tasks with different priorities, assigning a color code to each level of priority can help you easily sort the tasks and identify high-priority items that require immediate attention.
Additionally, color sorting can be advantageous when analyzing data over time. By assigning colors to different time periods, such as months or quarters, you can sort the data and observe patterns, trends, or seasonal variations. This can be particularly useful in sales analysis or financial forecasting.
Furthermore, color sorting can assist in data quality control. By assigning certain colors to data points with errors or outliers, you can quickly filter and address those issues. This method can be especially handy when collaborating with others on shared spreadsheets, as it allows for easy data validation and error identification.
Overall, the ability to sort by color in Google Sheets not only adds visual appeal to your data but also improves efficiency and decision-making. By leveraging the power of color, you can quickly identify, analyze, and interpret data, leading to better insights and informed actions.
How to Add Color to Cells in Google Sheets
Before you can start sorting data by color in Google Sheets, you first need to add color to the cells. Here’s a step-by-step guide on how to do it:
- Select the range of cells that you want to add color to. You can do this by clicking and dragging your cursor over the desired cells or by using the keyboard shortcuts Shift + Click or Ctrl + Click to select multiple ranges.
- Once the cells are selected, go to the toolbar at the top and click on the “Fill color” icon. It looks like a paint bucket. A color palette will appear.
- Click on the color you want to apply to the selected cells. You can choose from the predefined colors in the palette, or you can click on “Custom” to select a specific color using the color picker tool.
- The selected cells will now be filled with the chosen color. The color will be applied to the background of the cells.
- If you want to apply a different color to each cell or create a custom color gradient, you can use the “Conditional formatting” feature. This allows you to specify different colors based on certain conditions or cell values.
Adding color to cells in Google Sheets is a simple process that can be done in just a few clicks. By applying colors strategically, you can make your data visually appealing and easier to interpret.
Keep in mind that coloring cells is just the first step. To harness the full power of color sorting in Google Sheets, let’s proceed to the next section to learn how to sort columns or rows by color.
Sorting Columns or Rows by Color
Once you have added colors to cells in Google Sheets, you can easily sort columns or rows based on those colors. Sorting by color allows you to group and analyze data points that share similar characteristics or categories. Here’s how you can sort columns or rows by color:
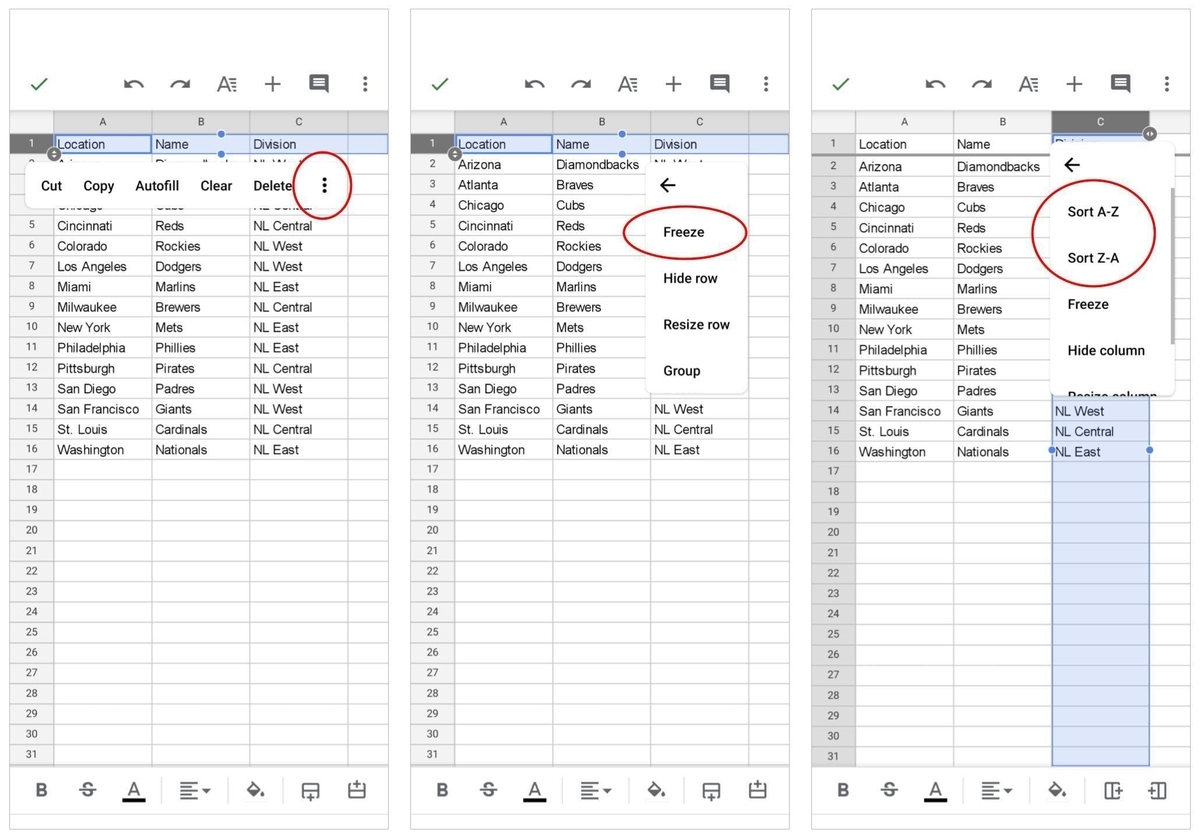
- Select the column or row that you want to sort by color. You can do this by clicking on the letter or number label of the column or row.
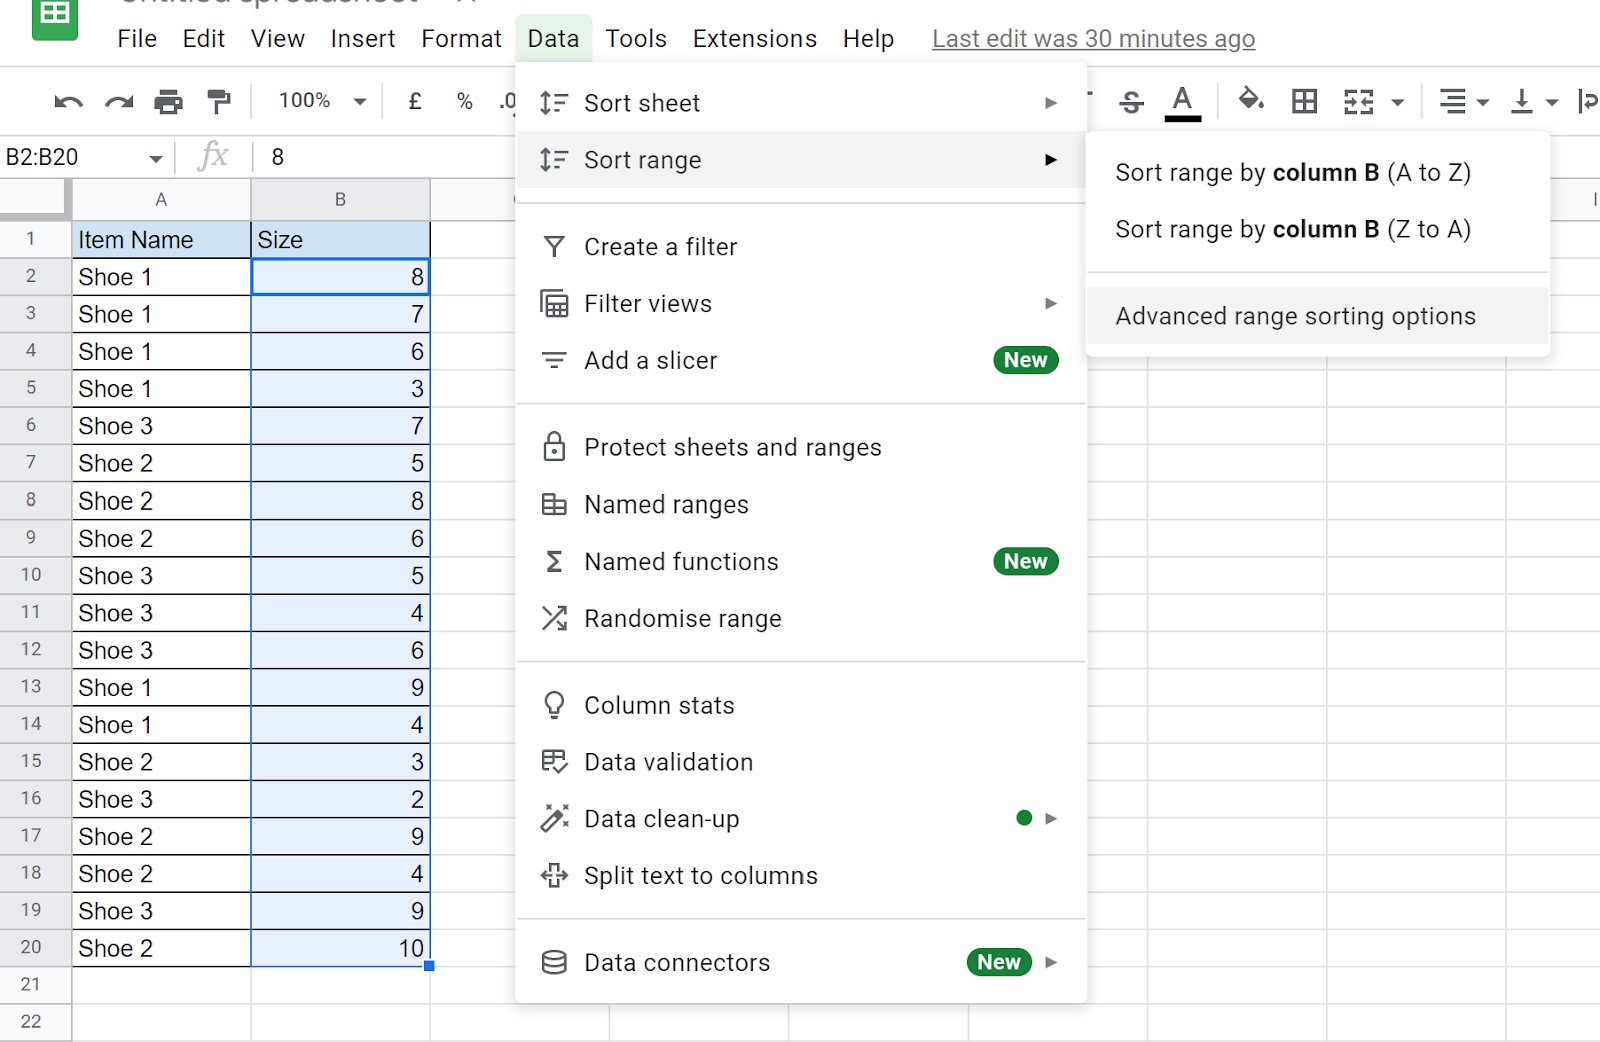
- Go to the toolbar and click on “Data”. A drop-down menu will appear.
- In the drop-down menu, hover over “Sort range”. Another pop-up menu will appear.
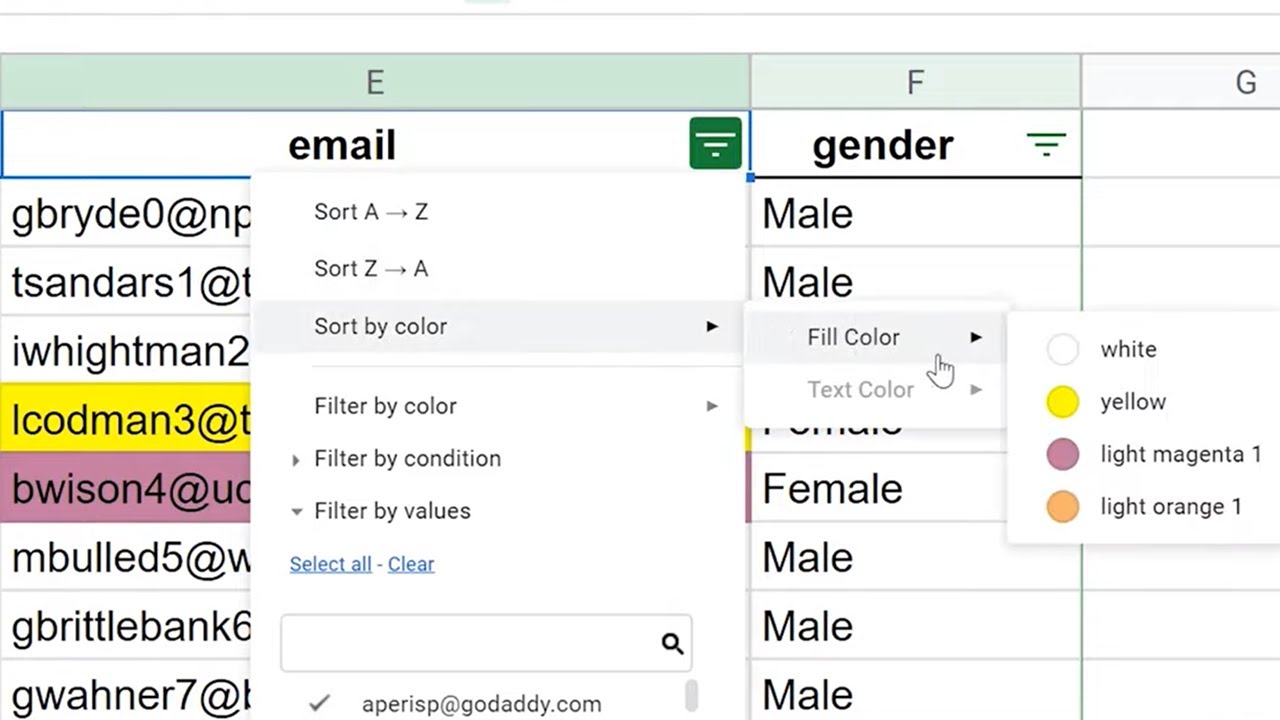
- In the pop-up menu, select “Sort by color”. A new dialog box will appear.
- In the dialog box, choose the color you want to sort by. You can select from the available colors or use the “Custom” option to specify a custom color.
- If you want to sort in a specific order, such as ascending or descending, choose the appropriate option in the dialog box.
- Click on the “Sort” button to apply the color sorting.
Google Sheets will then rearrange the selected column or row based on the chosen color. The cells with the selected color will be grouped together, making it easier for you to analyze and interpret the data.
Keep in mind that you can also sort multiple columns or rows by color at the same time. Simply select the desired range of columns or rows before following the steps mentioned above. This can be particularly useful when you have multiple color-coded categories or data sets that you want to compare.
Now that you know how to sort columns or rows by color, let’s move on to the next section to learn how to sort data based on multiple colors.
Sorting Data by Multiple Colors
In Google Sheets, you can take color sorting to the next level by sorting data based on multiple colors. This allows you to organize your data with even greater granularity and flexibility. Here’s how you can sort data based on multiple colors:
- Select the range of data that you want to sort. This can be a specific column, row, or the entire sheet.
- Go to the toolbar and click on “Data”. A drop-down menu will appear.
- In the drop-down menu, hover over “Sort range”. Another pop-up menu will appear.
- In the pop-up menu, select “Sort by color”. The “Sort by color” dialog box will appear.
- In the dialog box, choose the first color you want to sort by. Select the desired sorting order, such as ascending or descending.
- Click on the “Add another” button in the dialog box to add more colors to the sorting criteria.
- Select the additional colors and sorting order for each color.
- Click on the “Sort” button to apply the multiple color sorting.
Google Sheets will rearrange the selected data based on the specified colors and sorting orders. The sorted data will be grouped together by each color, allowing you to analyze the data based on multiple categories or criteria.
The ability to sort data by multiple colors can be particularly useful when you have complex datasets with various color-coded categories or when you want to analyze data points that meet specific criteria. It provides a comprehensive view of your data, making it easier to identify patterns, trends, or outliers.
Remember that you can always modify the sorting criteria by going back to the “Sort by color” dialog box and adjusting the colors or sorting orders as needed. This flexibility allows you to refine your data analysis and obtain the most relevant insights.
Now that you know how to sort data by multiple colors in Google Sheets, let’s move on to the next section to learn how to reset the sort by color.
How to Reset Sort by Color
If you have sorted your data by color in Google Sheets and want to revert back to the original order, you can easily reset the sort by color. Here’s how you can do it:
- Select the range of data that you have sorted by color.
- Go to the toolbar and click on “Data”. A drop-down menu will appear.
- In the drop-down menu, hover over “Sort range”. Another pop-up menu will appear.
- In the pop-up menu, select “Sort sheet by column A”. Note that the exact option may vary depending on your specific data.
This will reset the sorting and revert your data back to its original order. The color grouping that was applied during the previous sorting will be removed, and the data will be displayed in its original form.
Resetting the sort by color can be helpful when you want to reanalyze your data or apply a different sorting methodology. By removing the color sorting, you can start with a clean slate and approach your data analysis from a fresh perspective.
In addition to resetting the sort by color, you can also clear the cell colors altogether. To do this, select the range of cells that you want to clear the colors from, go to the toolbar, click on the “Fill color” icon, and choose the option to clear the color. This will remove the background color from the selected cells.
Now that you know how to reset the sort by color in Google Sheets, you have the flexibility to experiment and refine your data analysis as needed.
Tips and Tricks for Sorting by Color in Google Sheets
Sorting by color in Google Sheets can be a powerful tool to organize and analyze your data. To make the most of this feature, here are some useful tips and tricks:
1. Use a consistent color scheme: Establish a consistent color scheme for different categories or criteria in your data. This will make it easier to visually identify and sort your data based on those colors consistently across multiple sheets or documents.
2. Utilize conditional formatting: Conditional formatting allows you to automatically apply colors to cells based on specific conditions or cell values. This can be a time-saving technique to quickly categorize and sort large datasets without manual color assignments.
3. Combine colors with icons or text styles: To enhance the visual differentiation of your data, consider combining color assignments with icons or text styles. For example, use a red color for negative values and apply a downward-facing arrow icon or a bold font to emphasize the significance of the data.
4. Sort by font color: In addition to sorting by background color, Google Sheets also allows you to sort by font color. This can be useful when you want to prioritize or analyze data based on specific text or label colors, such as differentiating between completed and pending tasks.
5. Experiment with custom color gradients: Instead of using individual colors, you can create custom color gradients to represent data ranges or levels. This gradient can provide a visual representation of data intensity or progression, adding an additional layer of interpretation to your sorting and analysis.
6. Document your color assignments: When working on collaborative projects or sharing spreadsheets with others, it’s important to document the color assignments for specific categories or criteria. This way, everyone involved can have a clear understanding of the color coding and sorting methods used in the data.
7. Regularly review and update color assignments: As your data evolves or new categories emerge, it’s essential to periodically review and update your color assignments. This will ensure that your color sorting remains accurate and relevant as the data changes.
By utilizing these tips and tricks, you can maximize the effectiveness of sorting by color in Google Sheets and gain valuable insights from your data in a visually appealing way.
Conclusion
Sorting by color in Google Sheets adds a dynamic and visual dimension to your data analysis. By assigning colors to cells and sorting based on those colors, you can streamline your workflow, easily identify patterns and outliers, and make more informed decisions.
In this article, we covered the process of adding colors to cells, sorting columns or rows by color, sorting data by multiple colors, resetting the sort by color, and shared some useful tips and tricks for effective color sorting. By following these steps and applying the strategies mentioned, you can optimize your data organization and analysis in Google Sheets.
Remember, consistency in color schemes, utilizing conditional formatting, and combining colors with icons or text styles can enhance the visual representation of your data. Additionally, experimenting with custom color gradients and regularly reviewing and updating your color assignments will keep your sorting accurate and aligned with your evolving data.
So, dive into your data, unleash the power of color sorting, and gain deeper insights from your Google Sheets. Whether you are analyzing sales figures, tracking project progress, or conducting research, sorting by color will help you explore your data in a meaningful and efficient way.
Start harnessing the power of color sorting in Google Sheets today and take your data analysis to new heights!