Introduction
Welcome to the world of project management, where every task, deadline, and resource needs to be carefully managed and coordinated. For any project, big or small, keeping track of the various activities and their timelines can be quite challenging. That’s where a Gantt chart comes to the rescue.
In today’s fast-paced business environment, utilizing the right tools to stay organized is crucial. A Gantt chart is a powerful visual tool that helps project managers and teams plan, schedule, and track their projects effectively. And when it comes to creating a Gantt chart, Google Sheets offers a user-friendly and convenient platform that you can access from anywhere with an internet connection.
Whether you’re a project manager, team lead, or freelancer, it’s essential to have a clear roadmap of your project to ensure smooth execution and timely completion. In this article, we will guide you on how to create a Gantt chart using Google Sheets, from setting up your project timeline to customizing and tracking progress. So let’s dive in and learn the art of project management with Google Sheets!
What is a Gantt Chart?
A Gantt chart is a visual representation of a project’s schedule that helps to plan, track, and manage tasks over time. It was developed by Henry Gantt in the early 20th century and has since become a widely used tool in project management. The chart consists of horizontal bars or blocks, each representing a task, and the length of the bar represents the duration of the task.
One of the key features of a Gantt chart is its ability to display dependencies between tasks. This means that the start or completion of one task may depend on the start or completion of another task. By visualizing these dependencies, project managers can identify critical paths and dependencies, which are essential for effective project planning and resource allocation.
Gantt charts provide a clear overview of the project’s timeline, allowing project managers and team members to see how activities overlap and interact with each other. This helps to identify potential bottlenecks and allows for better resource allocation, ensuring that tasks are assigned appropriately and completed within the project’s timeframe.
Moreover, a Gantt chart is not just a static representation of the project schedule. It is a dynamic tool that can be updated as the project progresses. By tracking the actual progress of tasks and comparing it with the planned schedule, project managers can identify any deviations and make informed decisions to keep the project on track.
With its intuitive visual representation, a Gantt chart simplifies complex project schedules and makes them easier to understand for team members, stakeholders, and clients. It provides a shared visual language that facilitates communication and alignment between all parties involved in the project.
Overall, a Gantt chart is an indispensable tool in project management, enabling effective planning, tracking, and coordination of tasks, resources, and timelines. By using a Gantt chart, project managers gain visibility into the project’s progress and can ensure that everything is on track for successful completion.
Benefits of Using a Gantt Chart
Using a Gantt chart in project management offers numerous benefits that help streamline workflows, improve communication, and enhance overall project success. Here are some key advantages of incorporating Gantt charts into your project management toolkit:
- Visual Representation: One of the primary benefits of a Gantt chart is its visual representation of project activities and timelines. This visual format allows project managers and team members to quickly understand the project’s overall scope, sequence of tasks, and dependencies. It provides a comprehensive view of the project, making it easier to identify potential bottlenecks and allocate resources effectively.
- Improved Planning and Scheduling: Gantt charts enable effective planning and scheduling by breaking down the project into smaller, manageable tasks. By assigning start and end dates to each task and visualizing their durations, project managers can better understand the project’s timeline and allocate resources accordingly. This helps in setting realistic deadlines and determining task dependencies, resulting in improved project planning and scheduling.
- Resource Allocation: Gantt charts help project managers allocate resources effectively by displaying task dependencies and the critical path of the project. By visualizing the workload of each team member and their availability, project managers can assign tasks strategically, avoid overburdening individuals, and ensure a balanced distribution of work. This leads to improved resource utilization and increased efficiency.
- Identifying and Managing Dependencies: Gantt charts make it easier to identify task dependencies. Dependencies occur when one task cannot start or complete until another task is finished. By visualizing these dependencies, project managers can ensure that tasks are executed in the correct order, avoiding any delays or conflicts. This allows for effective coordination and seamless progression of the project.
- Track Progress and Milestones: Gantt charts provide a tangible way to track the progress of tasks and milestones throughout the project. By regularly updating the chart with actual progress, project managers can compare it with the planned schedule and identify any deviations. This allows for timely course correction, ensuring that the project stays on track towards successful completion.
- Effective Communication: Gantt charts serve as a visual communication tool that promotes effective collaboration and understanding among project team members, stakeholders, and clients. The visual representation creates a shared understanding of the project’s timeline, dependencies, and progress, leading to improved communication, alignment, and decision-making.
Overall, incorporating Gantt charts into project management offers numerous benefits, including improved planning, scheduling, resource allocation, dependency management, progress tracking, and effective communication. By leveraging the power of Gantt charts, project managers can enhance project success rates and ensure efficient project execution.
Getting Started with Google Sheets
Google Sheets is a free, web-based spreadsheet tool provided by Google that offers robust features and functionalities for creating and managing projects, including Gantt charts. Here’s how you can get started with Google Sheets:
- Create a Google Account: If you don’t already have a Google account, sign up for one at accounts.google.com/signup. Having a Google account will enable you to access Google Sheets and other Google services.
- Access Google Sheets: Once you have a Google account, go to sheets.google.com or access Sheets through your Google Drive. If you’re using a personal computer, you may need to install the Google Sheets app on your device.
- Create a New Spreadsheet: In Google Sheets, click on the “+ New” button to create a new spreadsheet. You’ll start with a blank sheet where you can begin building your Gantt chart.
- Set Up Columns: In the first row of your sheet, you’ll need to define the columns for your Gantt chart. Common columns include “Task Name”, “Start Date”, “End Date”, “Duration”, “Assigned To”, and “Dependencies”. Customize the column headers based on your project’s requirements.
- Enter Data: Starting from the second row, enter your project’s tasks and their associated information into the respective columns. Fill in the start and end dates, duration, assignees, and any task dependencies that need to be considered.
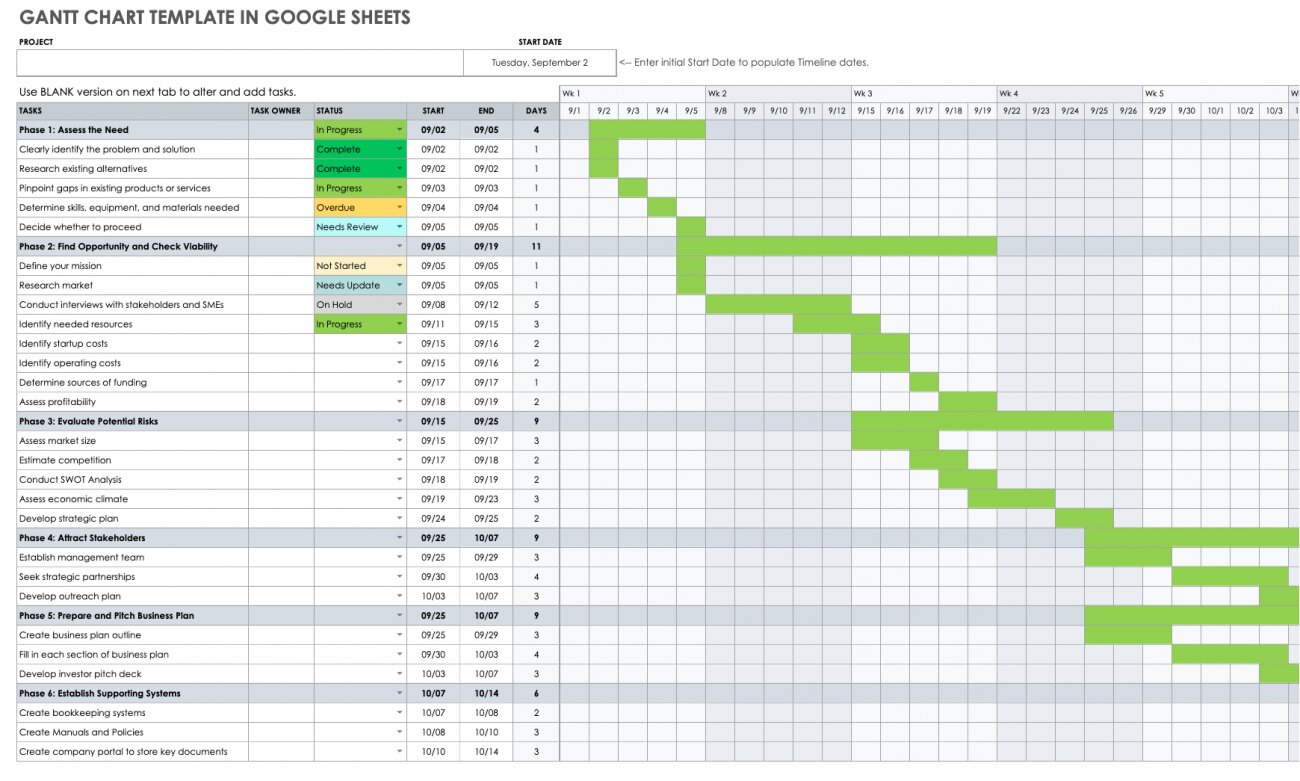
- Create a Gantt Chart: Select the range of data that you’ve entered and navigate to the “Insert” menu. From there, click on “Chart” and select “Chart type: Gantt chart”. Google Sheets will generate a basic Gantt chart based on your data.
- Customize Your Gantt Chart: Once your Gantt chart is created, you can customize it further to meet your project’s needs. Modify the chart’s appearance, such as colors and fonts, to enhance readability. You can also adjust the scale of the timeline to display the desired time frame.
- Add Task Bars: By default, Google Sheets will create task bars on your Gantt chart based on the start and end dates you entered. If needed, manually adjust the task bars to reflect the accurate duration or add additional task bars for overlapping or simultaneous tasks.
- Update and Maintain your Gantt Chart: As your project progresses, regularly update your Gantt chart to reflect the actual progress of tasks. Make adjustments to the task bars, dependencies, and any changes in timelines or assigned resources to ensure an accurate representation of the project’s status.
With these steps, you can quickly set up and start creating a Gantt chart in Google Sheets. Take advantage of the collaboration features in Google Sheets to allow team members to access and contribute to the Gantt chart in real-time, fostering seamless project management and successful execution.
Setting Up Your Project Timeline
Setting up a clear and accurate project timeline is crucial for effective project management. Google Sheets provides the tools you need to create a well-defined project timeline. Here’s how to set up your project timeline in Google Sheets:
- Define Project Start and End Dates: Determine the start and end dates of your project. These dates will serve as the overall timeframe for your project timeline.
- Choose Time Granularity: Decide on the time granularity you want to use for your project timeline. Common options include days, weeks, or months. Choose a granularity that best suits your project’s duration and level of detail required.
- Create Date Range: In a new section of your Google Sheets spreadsheet, create a column for dates. Starting from the project start date, list all the dates within the project’s timeframe based on your chosen time granularity. Use formulas in Google Sheets to automatically generate the date range.
- Generate Weekdays: Depending on your project’s requirements, you may want to exclude weekends or non-working days from your project timeline. Use formulas such as NETWORKDAYS or custom functions to calculate the weekdays and exclude weekends from your date range.
- Set Up Headers: In the first row of the date range section, specify the headers for each column. Typically, they include tasks, start date, end date, and duration. Customize the headers to match your project’s specific needs.
- Create Task Rows: Below the headers, create rows for each task in your project. Include one row per task, and assign each task to the respective start and end dates in the date range section. Make adjustments to the rows based on the project’s task dependencies and the duration of each task.
- Include Milestones and Events: If your project has significant milestones or events, add additional rows in the timeline section to highlight these key dates. This will provide a visual reference for important project milestones and help track their progress.
- Format the Timeline: Apply formatting to your project timeline to enhance readability and visual appeal. Use cell borders, shading, or conditional formatting to differentiate tasks, highlight milestones, or indicate project phases. You can also customize fonts or cell colors to match your project’s branding or style.
- Set Up Conditional Formatting (Optional): To create visual indicators for task status or deadlines, utilize conditional formatting in Google Sheets. Highlight overdue tasks, upcoming deadlines, or completed tasks to provide a quick overview of the project’s progress and identify areas that need attention.
- Regularly Update the Timeline: As your project progresses, regularly update the project timeline by adjusting the start and end dates, updating task durations, and adding new tasks as needed. This will ensure that the timeline reflects the most accurate and up-to-date information.
By following these steps, you can set up a comprehensive project timeline in Google Sheets that effectively captures the duration, dependencies, and milestones of your project. A well-structured project timeline provides a clear roadmap for your project’s execution, improves coordination among team members, and ensures the successful completion of your project.
Adding Tasks to Your Gantt Chart
Now that you have set up your project timeline in Google Sheets, it’s time to start adding tasks to your Gantt chart. Adding tasks to your Gantt chart will help you visualize the project’s activities and their timelines. Here’s how you can add tasks to your Gantt chart:
- Identify Project Tasks: Begin by identifying all the tasks involved in your project. Break down the project into smaller, manageable tasks that need to be accomplished.
- Assign Task Names: In the first column of your Gantt chart, list the task names. Be specific and use clear, descriptive names that accurately represent each task.
- Set Start and End Dates: In the corresponding columns of each task row, enter the start and end dates for each task. This helps establish the duration of each task and their position on the timeline.
- Calculate Duration: If you haven’t already, calculate the duration of each task based on the start and end dates. This allows you to visualize the timeline accurately.
- Add Dependency Links: Determine any task dependencies that exist between tasks. If a task is dependent on the completion of another task, indicate the dependency by linking the tasks. This helps establish the order of tasks and ensures that one task cannot begin until the preceding task is completed.
- Include Milestones: If your project has significant milestones, add them to your Gantt chart. Milestones are key points or achievements in the project that denote progress or completion of a specific phase. Mark these milestones with a different format or color for easy identification.
- Format and Customize: Enhance the visual appeal of your Gantt chart by formatting and customizing it to fit your preferences. Experiment with different colors, fonts, and cell styling to make the chart more appealing and easily readable.
- Add Additional Task Details: If necessary, include additional columns in your Gantt chart to capture more task details. This could include task descriptions, assigned resources or team members, estimated hours or effort, and any other relevant information that helps in managing the project.
- Regularly Update the Gantt Chart: As your project progresses, make sure to update your Gantt chart with any changes to task durations, dependencies, or assigned resources. This ensures that your Gantt chart accurately reflects the current status and progress of the project.
By following these steps, you can easily add tasks to your Gantt chart in Google Sheets. A well-populated Gantt chart provides a comprehensive overview of your project timeline, helps in managing dependencies, and enables effective scheduling and resource allocation. It also assists in tracking task progress and project milestones, keeping you on top of your project’s progress.
Assigning Resources and Dependencies
Assigning resources and managing task dependencies are crucial aspects of project management. By properly assigning resources and managing dependencies, you can ensure that tasks are executed in the correct order, resources are utilized effectively, and the project progresses smoothly. Here’s how you can assign resources and manage dependencies in your Gantt chart:
- Identify Project Resources: Start by identifying the resources needed for each task in your project. This could include team members, equipment, materials, or any other resources required for the successful completion of tasks.
- Assign Resources to Tasks: In your Gantt chart, create a column to assign resources to each task. Assign the appropriate resource(s) to each task based on their skills, availability, and expertise.
- Allocate Resource Workloads: Take into account the availability and capacity of each resource when assigning tasks. Ensure a balanced workload distribution by considering each resource’s workload and availability to prevent overburdening or underutilization of resources.
- Create Resource View: To get a comprehensive view of resource allocation, consider creating a separate sheet or section in your Gantt chart to display resource assignments. This allows you to monitor and manage resource workloads effectively.
- Manage Task Dependencies: Identify the dependencies between tasks in your project. Dependencies could be of four types: finish-to-start (FS), start-to-start (SS), finish-to-finish (FF), or start-to-finish (SF). Define and document the dependencies between tasks in your Gantt chart.
- Link Dependent Tasks: In your Gantt chart, visually link dependent tasks using arrows or connecting lines. This helps you understand the sequence in which tasks need to be completed and ensures that one task cannot start until its dependent task is finished.
- Manage Critical Path: Identify the critical path in your project, which represents the sequence of tasks that must be completed on time for the project to meet its deadline. By managing the critical path, you can focus your resources and attention on the tasks that are most crucial to project success.
- Regularly Update Resource Assignments: As the project progresses and resource availability changes, regularly update the resource assignments in your Gantt chart. This allows you to adapt and make necessary adjustments to maintain an optimal allocation of resources.
- Adjust the Gantt chart: Make any necessary adjustments to your Gantt chart to reflect changes in resource assignments or task dependencies. Update task durations, move dependent tasks, and modify resource assignments as needed to keep your Gantt chart accurate and up to date.
- Communication and Collaboration: Ensure effective communication and collaboration within your team by sharing the Gantt chart with relevant stakeholders. This fosters transparency and allows team members to stay informed about resource assignments and task dependencies.
By following these steps, you can effectively assign resources and manage task dependencies in your Gantt chart. This will result in optimized resource utilization, streamlined task execution, and improved project coordination, ultimately leading to the successful completion of your project.
Customizing Your Gantt Chart
Customizing your Gantt chart allows you to tailor it according to your project’s needs and preferences. Google Sheets offers various customization options that help you make your Gantt chart visually appealing and easy to understand. Here are some ways to customize your Gantt chart:
- Adjust Timeline Scale: You can customize the timeline scale to fit the duration of your project. Zoom in or out to show different time intervals, such as days, weeks, or months. This allows you to have a broader overview or a more detailed view of your project timeline.
- Customize Colors and Fonts: Choose colors and fonts that match your project’s branding or style guide. Use Google Sheets’ formatting options to change the font style, color, and size for headers, task bars, milestones, and other chart elements.
- Highlight Dependencies: Make task dependencies more noticeable by using different colors or line styles for arrows that connect dependent tasks. This helps team members easily identify which tasks are dependent on others, ensuring smooth task sequencing.
- Emphasize Milestones: Use distinctive markers or symbols to highlight project milestones. You can use special formatting options like bold fonts or different colors to draw attention to these significant points in your Gantt chart.
- Add Additional Columns or Data: Customize your Gantt chart by adding extra columns to display additional information, such as task descriptions, assigned team members, task statuses, or progress indicators. This provides more context and visibility to key details of your project.
- Apply Conditional Formatting: Utilize Google Sheets’ conditional formatting to dynamically change the appearance of task bars or cells based on specific criteria. For example, you can highlight late or overdue tasks by applying a red fill color or bold font style to draw attention.
- Include Project Logo or Images: Add your company’s logo or relevant project images to the Gantt chart to enhance branding and visual appeal. Simply insert an image into your Google Sheets, position it appropriately, and resize it as needed.
- Resize and Adjust Task Bars: Customize the appearance of task bars by adjusting their width or height. You can make the bars thicker or taller to improve visibility or proportional representation of task duration. This helps distinguish between shorter and longer tasks at a glance.
- Create Data Validation: Ensure data accuracy in your Gantt chart by applying data validation to input cells. This restricts users to specific options or ranges when entering data, minimizing errors or inconsistencies.
- Create Filters and Views: Use Google Sheets’ filtering options to create customized views of your Gantt chart. This allows you to focus on specific tasks, resources, or milestones, making it easier to analyze and present the data based on various criteria.
By customizing your Gantt chart in Google Sheets, you can make it more visually appealing, engaging, and informative. Tailoring the chart to your project’s specific needs helps improve readability, communication, and project tracking throughout the duration of your project.
Updating and Tracking Progress
Regularly updating and tracking progress in your Gantt chart is essential for effective project management. By keeping the chart up to date, you can monitor task completion, identify any delays or issues, and make informed decisions to keep your project on track. Here’s how you can update and track progress in your Gantt chart:
- Update Task Status: Regularly update the status of each task in your Gantt chart. Indicate whether a task is “Not Started,” “In Progress,” or “Completed.” This provides a quick visual overview of the progress of each task.
- Adjust Task Duration: If a task’s estimated duration changes, update the duration in the Gantt chart accordingly. Adjust the start and end dates to reflect any changes in the task’s timeline.
- Update Milestones: If a milestone is achieved or rescheduled, update the corresponding milestone in your Gantt chart. Move or adjust the milestone marker to reflect any changes accurately.
- Track Actual Progress: Regularly track the actual progress of each task and update it in your Gantt chart. Compare the actual completion dates with the planned dates to identify any deviations and evaluate task performance.
- Highlight Overdue Tasks: Use conditional formatting to highlight overdue tasks in your Gantt chart. Apply specific formatting, such as red text or bold font, to bring attention to tasks that are not completed within their planned timeline.
- Adjust Dependencies: If there are any changes in task dependencies, update the dependencies in your Gantt chart. This ensures that the chart accurately reflects the sequence in which tasks need to be completed.
- Identify Critical Path: Continuously identify the critical path in your project, which represents the sequence of tasks that must be completed within their planned duration for the project to meet its deadline. Monitor the critical path closely and take appropriate actions to prevent any delays.
- Update Resource Assignments: If there are changes in resource assignments or availability, update the resource information in your Gantt chart. Ensure that resources are accurately assigned to tasks based on their availability and capacity.
- Communicate Progress: Share the updated Gantt chart with team members, stakeholders, and clients to communicate the progress of the project. This fosters transparency and keeps everyone informed about the current status and any adjustments made to the project timeline.
- Hold Regular Progress Meetings: Conduct regular progress meetings to discuss the updated Gantt chart and project status with your team members. This provides an opportunity to address any challenges, solve problems, and keep everyone aligned towards the project’s objectives.
- Maintain Documentation: Keep a record of the updates made to your Gantt chart and project progress. Maintain documentation that captures the changes, reasons for delays, and any lessons learned throughout the project. This documentation serves as a valuable resource for future reference and continuous improvement.
By consistently updating and tracking progress in your Gantt chart, you gain valuable insights into the project’s performance, identify potential issues, and ensure timely completion. Regularly monitoring and adjusting the chart allows you to make informed decisions, keep stakeholders informed, and drive the project towards successful completion.
Sharing and Collaborating on Your Gantt Chart
Sharing and collaborating on your Gantt chart is essential for effective project management. By involving team members, stakeholders, and clients in the process, you encourage transparency, collaboration, and alignment. Here’s how you can share and collaborate on your Gantt chart:
- Select Sharing Permissions: Determine who should have access to your Gantt chart. In Google Sheets, you can choose whether to share it with specific individuals, your entire team, or make it accessible to anyone with the link. Set appropriate sharing permissions to ensure the right people can view and edit the chart.
- Share the Gantt Chart: Send the Gantt chart to team members, stakeholders, and clients by sharing the link or adding their email addresses to the sharing settings. This allows them to access and view the chart in real-time, fostering collaboration and transparency.
- Request Input and Feedback: Encourage team members and stakeholders to provide input and feedback on the Gantt chart. They can suggest changes, identify potential issues, or offer insights that can improve the project’s planning and execution.
- Enable Editing or Commenting: Grant editing or commenting permissions to individuals who need to make changes or provide feedback on the Gantt chart. This ensures that the right people can actively participate in the project management process.
- Collaborate in Real-time: Google Sheets allows for real-time collaboration, allowing multiple users to edit the Gantt chart simultaneously. This feature facilitates communication, encourages teamwork, and ensures that everyone has access to the most up-to-date information.
- Track Changes: Enable the “Suggesting” mode or track changes feature in Google Sheets to keep track of any modifications made to the Gantt chart. This allows you to see who made the changes and review them before accepting or rejecting them.
- Hold Collaborative Meetings: Conduct collaborative meetings or discussions to review and discuss the Gantt chart with the project team. This provides an opportunity to address questions, resolve conflicts, and ensure everyone is on the same page regarding project timelines and dependencies.
- Share Progress Updates: Regularly update team members, stakeholders, and clients on the progress of the project using the shared Gantt chart. Communicate any changes, developments, or challenges to keep everyone informed and maintain transparency throughout the project lifecycle.
- Request Task Updates: Encourage team members to regularly update task statuses and progress in the Gantt chart. Request that they mark tasks as “In Progress” or “Completed” to keep everyone updated on task execution and ensure the accuracy of the chart.
- Facilitate Discussions: Use the commenting feature in Google Sheets to facilitate discussions, address questions, or provide clarification on specific tasks or milestones. This encourages collaboration and speeds up decision-making by ensuring all communication is centralized within the Gantt chart.
By sharing and collaborating on your Gantt chart, you create a collaborative project environment. This enables effective communication, promotes teamwork, and ensures that everyone is aligned and working towards the project’s objectives. Shared access to the Gantt chart allows for transparency, real-time information exchange, and efficient project management.
Conclusion
Creating a Gantt chart in Google Sheets provides you with a powerful tool for effective project planning, scheduling, and tracking. It enables you to visualize project timelines, manage tasks and resources, and collaborate with team members to ensure successful project execution.
With the ability to customize your Gantt chart, you can tailor it to meet your project’s specific requirements. Adjusting the timeline scale, highlighting dependencies, and adding milestone markers allow for a clear visualization of project progress.
Updating and tracking progress in your Gantt chart ensures that you stay on top of task completion, resource allocation, and meet project deadlines. Regularly communicating progress updates and collaborating with team members, stakeholders, and clients fosters transparency, alignment, and shared understanding of project goals.
Through Google Sheets’ collaboration features, you can share the Gantt chart in real-time, enabling multiple users to work together, provide feedback, and make real-time edits. This promotes effective communication, enhances teamwork, and streamlines project management processes.
By following the steps outlined in this guide, you can harness the power of Google Sheets to create a dynamic Gantt chart that serves as a visual roadmap for your project. Whether you’re managing a small team or executing a large-scale project, the Gantt chart in Google Sheets empowers you to plan, track, and coordinate tasks efficiently.
So, unleash your project management prowess and leverage the versatility and collaboration features of Google Sheets’ Gantt chart. Take control of your projects, optimize resource utilization, and experience the benefits of streamlined project management from start to finish.