Introduction
In today’s data-driven world, the ability to analyze and interpret numerical data is crucial. One common statistical measure used to summarize a set of values is the mean. The mean, also known as the average, provides valuable insights into the central tendency of a dataset. Understanding how to calculate the mean can be immensely helpful in various fields, including finance, research, and data analysis.
In this article, we will explore how to find the mean in Google Sheets, a powerful online spreadsheet application. Whether you’re a beginner or an experienced user, learning how to calculate the mean in Google Sheets can streamline your data analysis process and help you make informed decisions based on numerical data.
We will start by understanding what the mean actually is and how it is calculated. Then, we will delve into various methods and techniques to calculate the mean in different scenarios. By the end of this article, you will have a comprehensive understanding of how to calculate the mean in Google Sheets and apply it to your own datasets.
So, let’s dive in and discover the various ways to obtain the mean in Google Sheets, unlocking the potential of your numerical data.
What is the mean?
Before we delve into the methods of calculating the mean in Google Sheets, let’s start by understanding what the mean actually represents. The mean, also known as the arithmetic average, is a statistical measure used to summarize a set of numerical values.
To calculate the mean, you add up all the values in a dataset and divide the sum by the total number of values. It provides us with a single value that represents the “average” of the dataset. The mean is a useful measure as it provides insights into the central tendency of the data, giving us an idea of the typical value within the dataset.
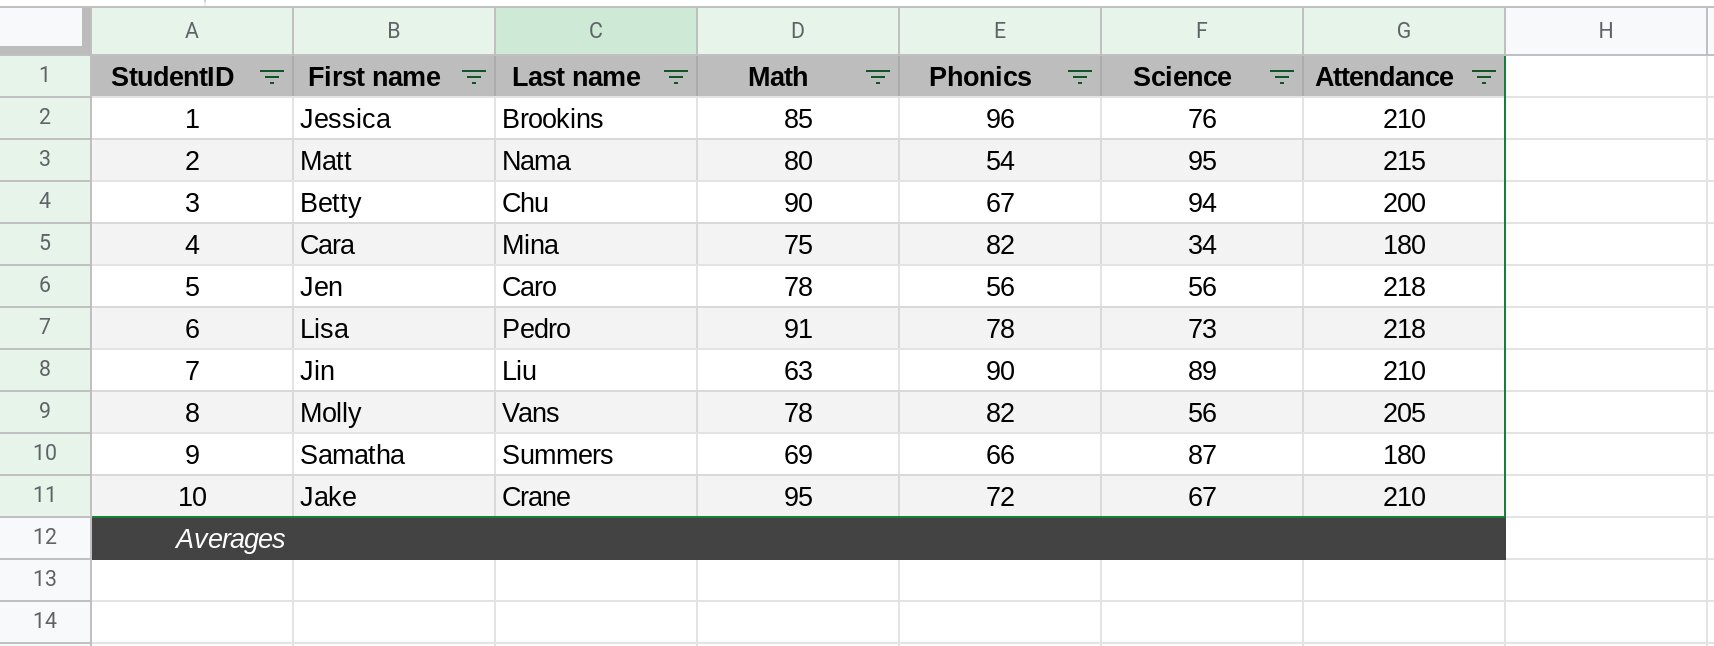
For example, let’s say we have a dataset of test scores for a class of students. The mean of these scores would give us an indication of the average performance of the class. If the mean is high, it suggests that the class, on average, performed well. On the other hand, a lower mean indicates that the class, on average, performed poorly.
The mean is widely used in various fields, including business, finance, science, and social sciences. It helps in summarizing and comparing data, identifying trends, and making informed decisions based on numerical analysis.
It is important to note that while the mean is a valuable measure, it can sometimes be affected by extreme values, also known as outliers. Outliers can significantly skew the mean and affect its representativeness. In such cases, other measures like the median or mode might be more suitable for summarizing the data.
Now that we have a clear understanding of what the mean represents, let’s move on to learning how to calculate it in Google Sheets.
Using the AVERAGE function
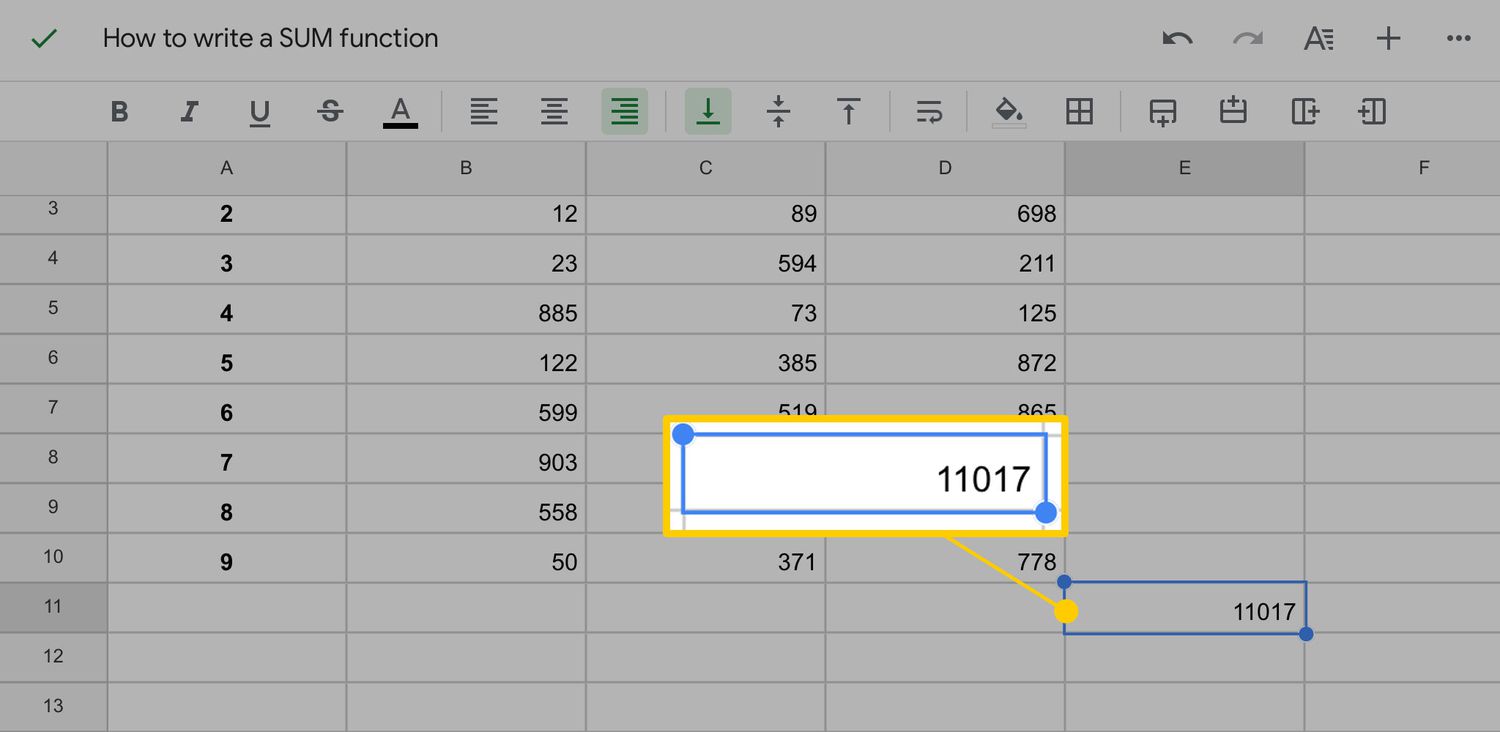
In Google Sheets, calculating the mean is made easy with the built-in AVERAGE function. The AVERAGE function allows you to find the mean of a range of values quickly and accurately.
To use the AVERAGE function, follow these steps:
- Select the cell where you want the mean to appear.
- Type “=AVERAGE(” into the cell.
- Select the range of values for which you want to find the mean.
- Close the parentheses and press Enter.
For example, let’s say you have a dataset of test scores in cells A1 to A10, and you want to calculate the mean of these scores. You would select an empty cell where you want the mean to appear, type “=AVERAGE(A1:A10)”, and press Enter. The cell will now display the mean of the selected range.
The AVERAGE function in Google Sheets automatically considers only the numeric values in the selected range and ignores any text or empty cells. This makes it incredibly useful when analyzing data with missing or irrelevant values.
Additionally, you can use the AVERAGE function to find the mean of multiple ranges. Simply separate the ranges with commas within the parentheses of the AVERAGE function. This comes in handy when you have separate ranges of data that you want to calculate the mean for.
By utilizing the AVERAGE function in Google Sheets, you can effortlessly calculate the mean of any range of values without the need for manual calculations. This saves you time and ensures accuracy in your data analysis process.
Calculating the mean for a range of values
In many cases, you may need to find the mean for a range of values in a dataset rather than individual cells. Google Sheets provides a simple and efficient way to calculate the mean for a range of values using the AVERAGE function.
To calculate the mean for a range of values, follow these steps:
- Select the cell where you want the mean to appear.
- Type “=AVERAGE(” into the cell.
- Select the range of values for which you want to find the mean.
- Close the parentheses and press Enter.
For example, let’s say we have a dataset of daily sales figures for a month in cells A1 to A30, and we want to calculate the mean for these sales. You would select an empty cell, type “=AVERAGE(A1:A30)”, and press Enter. The cell will now display the mean of the selected range.
The AVERAGE function in Google Sheets automatically considers only the numeric values within the selected range and excludes any text or empty cells. This ensures that the mean is calculated accurately and reflects the central tendency of the dataset.
By calculating the mean for a range of values, you can effectively analyze and compare different subsets of data. This is particularly useful when dealing with large datasets or when you want to focus on specific periods or categories within your data.
Remember, the AVERAGE function in Google Sheets provides a quick and efficient way to calculate the mean for a range of values, allowing you to gain valuable insights into your data without the need for manual calculations.
Finding the mean for a filtered range
In Google Sheets, you may often need to calculate the mean for a filtered range of values. Filtering data helps you focus on specific criteria or conditions within your dataset, and being able to calculate the mean for these filtered ranges can provide valuable insights.
Here’s how you can find the mean for a filtered range in Google Sheets:
- Select the column containing the data you want to filter.
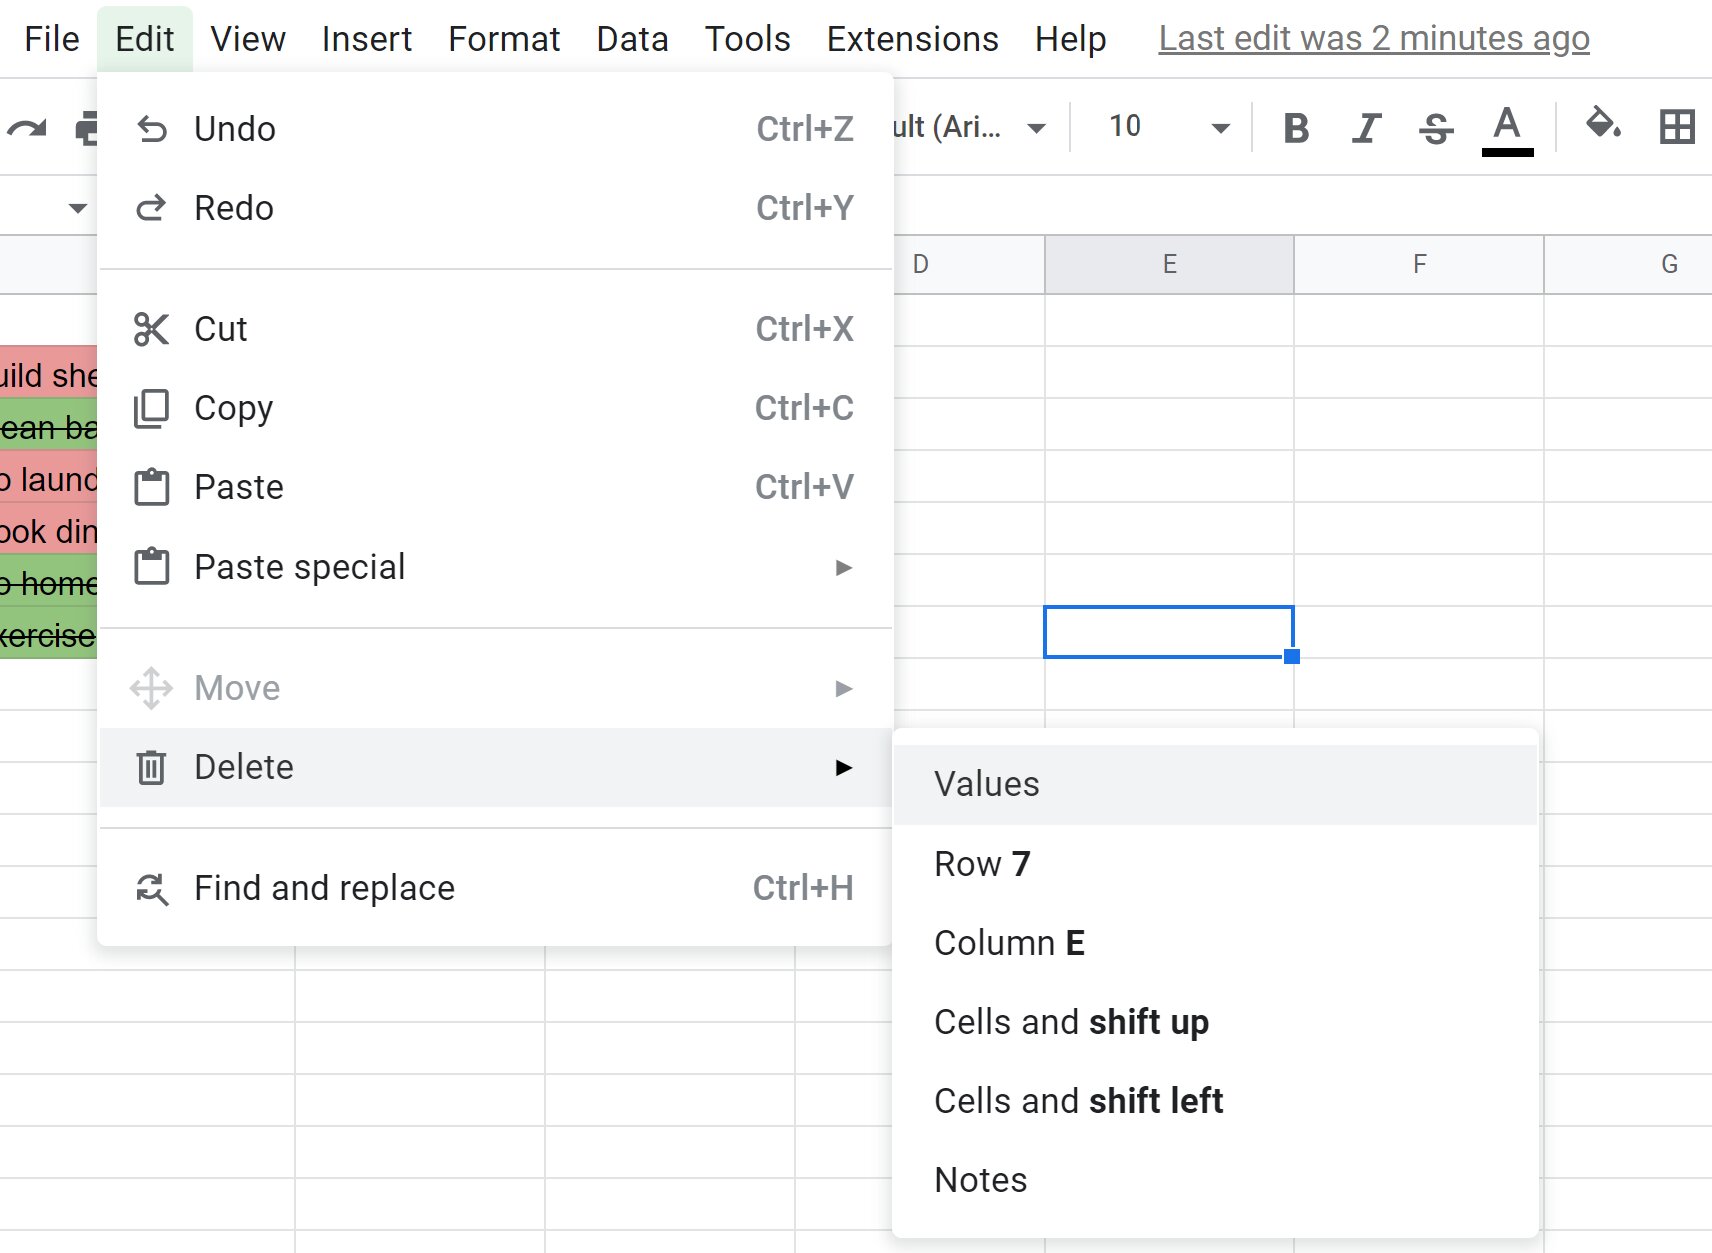
- Click on the “Data” tab in the menu bar and select “Filter” from the dropdown menu. This will add a filter to your column.
- Click on the small arrow in the column header and select the desired filtering criteria. This will display only the filtered values in the column.
- Select an empty cell where you want the mean to appear.
- Type “=AVERAGE(” into the cell.
- Select the filtered range of values for which you want to find the mean.
- Close the parentheses and press Enter.
For instance, let’s say you have a dataset of sales data with multiple columns, including “Region” and “Revenue.” If you want to find the mean revenue for a specific region, you can filter the data based on the desired region, and then calculate the mean of the filtered revenue values using the AVERAGE function.
By calculating the mean for a filtered range, you can analyze specific subsets of your data that meet certain criteria or conditions. This allows for more focused and meaningful data analysis, leading to better insights and decision-making.
Utilizing the filter function in conjunction with the AVERAGE function in Google Sheets empowers you to calculate the mean for filtered ranges with ease, enabling you to extract valuable information from your dataset efficiently.
Ignoring blank cells
When calculating the mean in Google Sheets, it is essential to handle blank cells appropriately. Blank cells can occur due to missing data or incomplete entries in a dataset, and including them in the calculation can skew the mean and lead to inaccurate results.
To ignore blank cells when finding the mean in Google Sheets, you can utilize the AVERAGEIF function. The AVERAGEIF function allows you to specify a range of values to average based on a given condition.
Here’s how you can calculate the mean while ignoring blank cells:
- Select the cell where you want the mean to appear.
- Type “=AVERAGEIF(” into the cell.
- Select the range of values for which you want to find the mean.
- Type “,” to separate the arguments.
- Type “<>“” inside quotation marks to specify the condition that the value should not be blank.
- Close the parentheses and press Enter.
For example, suppose you have a dataset of expenses in cells A1 to A10, and some of the cells are blank due to missing data. If you want to calculate the mean of the non-blank expenses, you would use the formula “=AVERAGEIF(A1:A10, “<>“)”. The cell will now display the mean of the non-blank expenses in the range.
By using the AVERAGEIF function with the condition to ignore blank cells, you can accurately calculate the mean without distorting the results due to missing data. This feature is particularly helpful when dealing with datasets that contain incomplete or inconsistent entries.
By handling blank cells appropriately, you ensure the integrity of your mean calculations and obtain reliable insights from your data analysis in Google Sheets.
Excluding outliers from the dataset
When calculating the mean in Google Sheets, it is important to consider the presence of outliers. An outlier is a data point that significantly differs from the other values in a dataset. These extreme values can distort the mean and affect its representativeness.
To exclude outliers from the dataset when calculating the mean in Google Sheets, you can utilize a combination of functions such as AVERAGE, IF, and ABS.
Here’s a step-by-step approach to exclude outliers:
- Calculate the standard deviation of the dataset using the STDEV function. This measures the dispersion of the data.
- Calculate the mean of the dataset using the AVERAGE function.
- Define a threshold for outliers. Typically, any value that is more than two or three standard deviations away from the mean is considered an outlier.
- Use the AVERAGE function along with the IF function to exclude the outliers. The IF function checks whether each value in the dataset is within the defined threshold and includes only the values that meet the criterion.
- Close the parentheses and press Enter.
For example, let’s say you have a dataset of test scores in cells A1 to A20, and you want to calculate the mean while excluding the outliers. You would first calculate the standard deviation using the formula “=STDEV(A1:A20)”, then calculate the mean using the formula “=AVERAGE(A1:A20)”.
To exclude the outliers, you would use the formula “=AVERAGE(IF(ABS(A1:A20-AVERAGE(A1:A20))<=2*STDEV(A1:A20), A1:A20))". This formula checks if each value in the dataset is within two standard deviations from the mean and includes only the values that meet the criteria in the calculation of the mean.
By excluding outliers from the dataset, you can obtain a more accurate representation of the central tendency of the data. This allows for a more reliable interpretation of the mean and aids in making informed decisions based on the dataset in Google Sheets.
Using conditional statements to calculate the mean
In Google Sheets, you can use conditional statements to calculate the mean based on specific criteria or conditions within your dataset. This allows you to customize the calculation to focus on certain subsets of data and obtain more targeted insights.
To calculate the mean using conditional statements in Google Sheets, you can use the AVERAGEIF or AVERAGEIFS function. These functions allow you to specify one or multiple conditions based on which the mean will be calculated.
Here’s how you can use conditional statements to calculate the mean in Google Sheets:
- Select the cell where you want the mean to appear.
- Type “=AVERAGEIF(” or “=AVERAGEIFS(” depending on whether you want to apply a single condition or multiple conditions.
- Select the range of values to evaluate.
- Type the condition or conditions based on which the mean should be calculated using comparison operators (e.g., “>”, “<", "=", etc.) and values that meet the specific criteria.
- If using AVERAGEIFS, select the range to evaluate for each condition and repeat the process of specifying the condition and criteria.
- Close the parentheses and press Enter.
For example, let’s say you have a dataset of sales figures in cells A1 to A20, and you want to calculate the mean for sales figures that are greater than $10,000. You would use the formula “=AVERAGEIF(A1:A20, “>10000″)” and the cell will display the mean of the sales figures that meet the specified condition.
If you want to calculate the mean based on multiple conditions, such as sales figures greater than $10,000 and in a specific region, you would use the AVERAGEIFS function. The formula would look like “=AVERAGEIFS(A1:A20, “>10000”, B1:B20, “Region A”)” where B1:B20 represents the range of regions in cells B1 to B20.
Using conditional statements to calculate the mean allows for more specialized analysis of data subsets in Google Sheets. By specifying conditions based on your criteria, you can obtain valuable insights that are tailored to your specific requirements.
Analyzing data with multiple criteria
In Google Sheets, you may often need to analyze data using multiple criteria to gain more specific insights into your dataset. By applying multiple conditions simultaneously, you can refine your analysis and obtain a more detailed understanding of the data.
To analyze data with multiple criteria and calculate the mean in Google Sheets, you can utilize the AVERAGEIFS function. This function allows you to apply multiple conditions to filter the data and calculate the mean based on those criteria.
Here’s how you can analyze data with multiple criteria and calculate the mean using the AVERAGEIFS function:
- Select the cell where you want the mean to appear.
- Type “=AVERAGEIFS(” into the cell.
- Select the range to evaluate for each condition. (e.g., sales figures, test scores, etc.)
- Type the criteria range for the first condition.
- Type the condition for the first criteria range.
- If you have additional criteria, type the criteria range and condition for each subsequent criteria.
- Close the parentheses and press Enter.
For example, let’s say you have a dataset of sales figures in column A, and you want to calculate the mean for sales figures greater than $10,000 in Region A. You would use the formula “=AVERAGEIFS(A:A, A:A, “>10000”, B:B, “Region A”)”, where column B represents the region corresponding to each sales figure.
By applying multiple criteria, you can perform more complex analyses on your data. Whether you want to calculate the mean for specific combinations of values, filter data based on multiple conditions, or explore various segments within your dataset, the AVERAGEIFS function in Google Sheets provides a powerful tool to achieve these goals.
When analyzing data with multiple criteria, it is essential to ensure that your criteria are accurately defined and aligned with your analysis objectives. By leveraging the AVERAGEIFS function, you can extract valuable insights and obtain a more comprehensive understanding of your dataset in Google Sheets.
Conclusion
Calculating the mean in Google Sheets is a fundamental skill that can enhance your ability to analyze and interpret numerical data effectively. Whether you’re working with small datasets or large datasets, understanding how to calculate the mean allows you to gain insights into the central tendency of your data and make informed decisions.
In this article, we explored various methods and techniques for finding the mean in Google Sheets. The built-in AVERAGE function simplifies the process of calculating the mean for a range of values, while the AVERAGEIF and AVERAGEIFS functions enable you to calculate the mean based on specific conditions and criteria.
We also discussed the importance of handling blank cells appropriately, excluding outliers from the dataset, and utilizing conditional statements to analyze data with multiple criteria. These techniques enhance the accuracy of your mean calculations and help you uncover valuable insights from your data.
By becoming proficient in calculating the mean in Google Sheets, you can streamline your data analysis process, identify trends, make data-driven decisions, and communicate your findings effectively.
Remember, the mean is just one statistical measure among many, and its interpretation must consider the specific characteristics and context of your dataset. As you progress in your data analysis journey, continue exploring other statistical measures and techniques to gain a more comprehensive understanding of your data.
So, go ahead and apply these techniques in your own Google Sheets projects. Start calculating the mean to uncover patterns, trends, and valuable insights within your numerical data.