Introduction
Google Sheets is a powerful tool that allows users to create, edit, and analyze spreadsheets online. Whether you are working on a personal budget, financial projections, or data analysis, understanding how to work with percentages in Google Sheets is essential.
Percentages are used to represent a portion of a whole number, making it easier to understand relative values and compare data sets. In this guide, we will explore various methods to work with percentages in Google Sheets, including formatting cells, entering percentages manually, and using formulas to calculate percentages.
With Google Sheets, you have the flexibility to customize the formatting of percentages, round them to specific decimal places, convert them to decimals or fractions, and even apply conditional formatting to highlight specific percentage ranges.
Whether you are a student, professional, or managing personal finances, this guide will provide you with the knowledge and skills to effectively work with percentages in Google Sheets. So let’s get started and unlock the full potential of this versatile spreadsheet tool!
Setting up your Google Sheet
Before diving into working with percentages in Google Sheets, it’s important to ensure that your spreadsheet is set up correctly. Here are a few steps to follow:
- Create a new spreadsheet: Open Google Sheets and click on “Blank” to create a new spreadsheet.
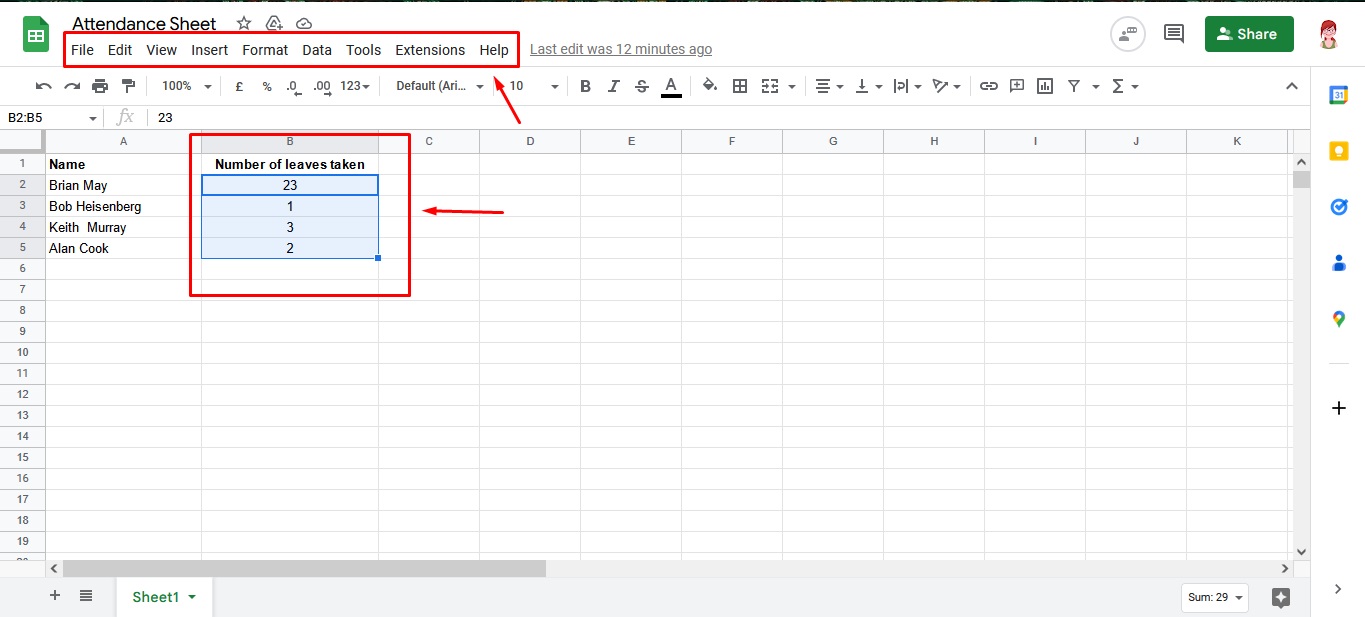
- Label your columns: Depending on your specific needs, label the columns of your sheet appropriately. For example, if you’re working with sales data, you may have columns like “Product,” “Quantity,” and “Revenue.”
- Enter your data: Fill in the relevant data for each column. Make sure to enter the numbers that you will be working with to calculate percentages accurately.
- Format your data: Highlight the range of cells containing your data, right-click, and select “Format cells.” Choose the format that best suits your needs, such as “Number” or “Currency.”
By following these steps, you can ensure that your Google Sheet is ready to work with percentages effectively. Organizing your data and applying appropriate formatting will provide a solid foundation for performing calculations and analyzing your percentage values.
Now that we have the basics set up, let’s move on to formatting cells for percentages.
Formatting cells for percentages
Formatting cells for percentages in Google Sheets allows you to visually represent your data accurately. Here’s how you can format cells to display percentages:
- Select the range of cells: Highlight the range of cells that you want to format as percentages.
- Right-click and select “Format cells”: In the context menu, click on “Format cells” to open the formatting options.
- Select the “Percent” category: In the format sidebar that appears, select the “Percent” category.
- Choose the desired decimal places: Specify the number of decimal places you want for your percentages. You can choose to display percentages with zero, one, two, or more decimal places.
- Apply the formatting: Click on the “Apply” button to apply the percentage formatting to the selected cells.
Once you have formatted the cells as percentages, Google Sheets will automatically multiply the values by 100 and add a percentage symbol (“%”) at the end. This allows you and others to quickly understand that the values represent percentages.
Keep in mind that formatting cells as percentages does not change the underlying values; it only affects how they are displayed. If you need to perform calculations with the formatted percentage values, you can use formulas that work with the underlying decimal values instead of the formatted ones.
Now that you know how to format cells for percentages, you can effectively display and work with percentage values in your Google Sheets. Let’s move on to the next section and learn how to enter percentages manually.
Entering percentages manually
Entering percentages manually in Google Sheets allows you to input specific percentage values directly into cells. Here’s how you can do it:
- Select the cell: Click on the cell where you want to enter the percentage value.
- Type the percentage: Enter the percentage value without the percentage symbol (“%”). For example, if you want to enter “25%”, simply type “25”.
- Press Enter: Press the Enter key to confirm your entry. The cell will now display the percentage value along with the percentage symbol (“%”).
By manually entering percentages, you have precise control over the exact values you want to work with in your Google Sheet. This method is especially useful when you need to input specific percentage values that are not derived from calculations or formulas.
Keep in mind that if you have already formatted the cell for percentages (as explained in the previous section), Google Sheets will automatically display the entered value as a percentage with the correct formatting.
Now that you know how to manually enter percentages in Google Sheets, let’s explore how to calculate percentages using formulas.
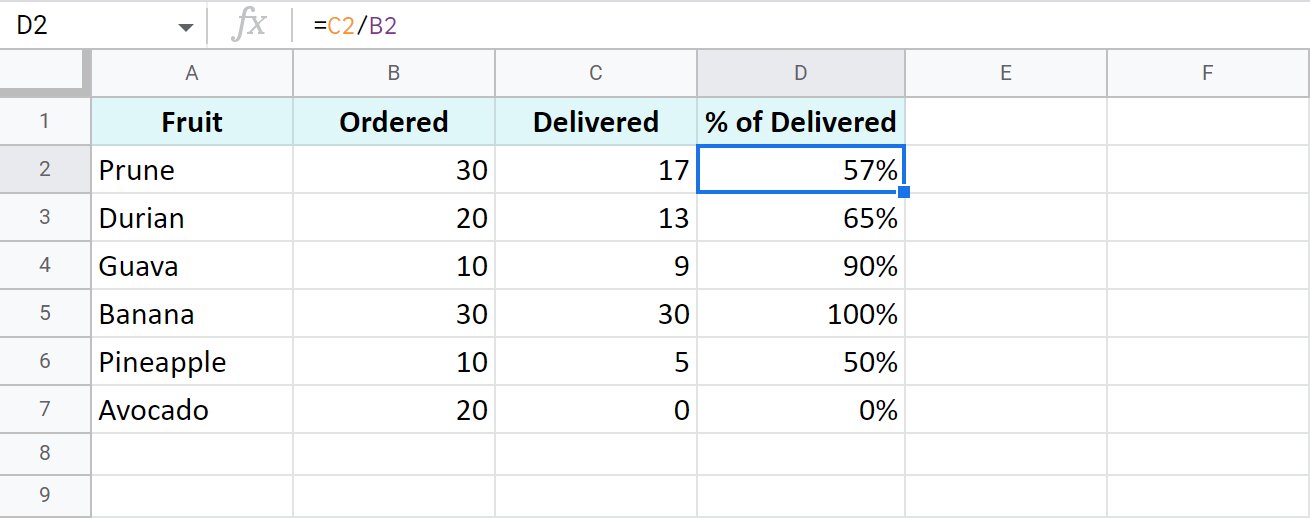
Calculating percentages using formulas
Calculating percentages using formulas in Google Sheets allows you to perform various calculations involving percentage values. Here are some commonly used formulas:
- Percentage of a total: To calculate the percentage of a total, you can use the formula
= (value / total) * 100. Replace “value” with the specific number you want to calculate the percentage for and “total” with the total value. For example, to find the percentage of sales revenue out of the total revenue, you would use= (sales / total_revenue) * 100. - Percentage change: To calculate the percentage change between two values, you can use the formula
= ((new_value - old_value) / old_value) * 100. Replace “new_value” with the new value and “old_value” with the old value. For example, to calculate the percentage change in sales from last month to this month, you would use= ((this_month_sales - last_month_sales) / last_month_sales) * 100. - Percentage increase or decrease: To calculate the percentage increase or decrease between two values, you can use the formula
= ((new_value - old_value) / old_value) * 100. If the result is positive, it represents a percentage increase, and if it is negative, it represents a percentage decrease. - Percentage distribution: To calculate the percentage distribution of values within a set, you can use the formula
= (value / sum_range) * 100. Replace “value” with the specific value you want to calculate the percentage for and “sum_range” with the range of values to be included in the sum. For example, to find the percentage distribution of each product’s sales revenue out of the total revenue, you would use= (product_sales / sum(total_revenue_range)) * 100.
By utilizing these formulas, you can perform various calculations involving percentages in Google Sheets. These calculations can be especially useful for analyzing data, making comparisons, and understanding relative values.
Now that you have learned how to calculate percentages using formulas, let’s explore how to use the percentage format in calculations.
Using the percentage format in calculations
Google Sheets allows you to use the percentage format in calculations, which is particularly helpful when you want to perform mathematical operations involving percentages. Here’s how you can use the percentage format in calculations:
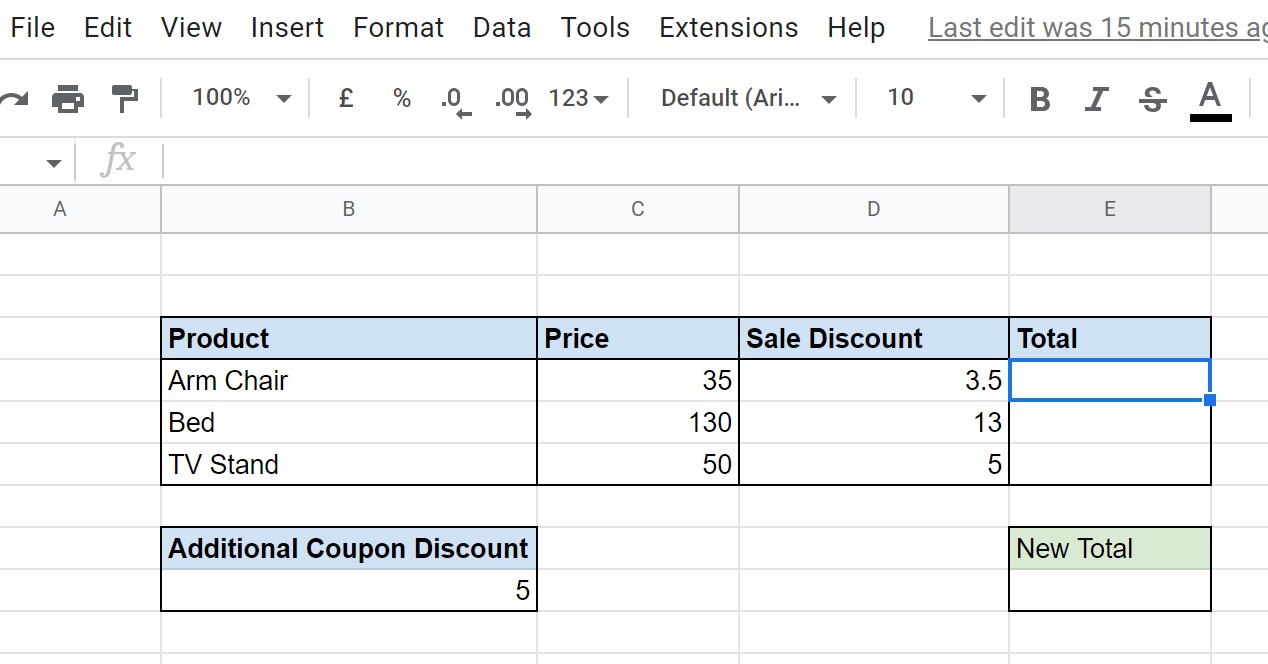
- Enter the values: First, enter the numbers or percentage values you want to use in your calculation. Make sure to include the cells with the percentage format.
- Perform the calculation: Use any mathematical operator (+, -, *, /) to perform the desired calculation. For example, to calculate the total increase in percentage sales, you can use a formula like
= cell1 + cell2, where cell1 and cell2 represent the cells with percentage values. - Observe the calculation result: Google Sheets will automatically apply the percentage format to the result of your calculation. The calculated percentage will include the appropriate decimal places and display the percentage symbol (“%”).
By utilizing the percentage format in calculations, you can easily perform mathematical operations on percentage values while maintaining the correct formatting. This allows for accurate calculations and simplified data analysis.
Remember that when using the percentage format in calculations, Google Sheets treats the percentage values as decimal numbers. This means that a value of 50% will be treated as 0.5 in calculations, and a value of 100% will be treated as 1.0.
Now that you know how to use the percentage format in calculations, let’s explore how to format percentages with decimal places.
Formatting percentages with decimal places
Formatting percentages with decimal places in Google Sheets allows you to control the level of precision in your percentage values. Here’s how you can format percentages with specific decimal places:
- Select the range of cells: Highlight the range of cells containing the percentage values that you want to format.
- Right-click and select “Format cells”: In the context menu, click on “Format cells” to access the formatting options.
- Select the “Number” category: In the format sidebar that appears, select the “Number” category.
- Enter the desired decimal places: In the “Decimal places” section, specify the number of decimal places you want to display for your percentages.
- Apply the formatting: Click on the “Apply” button to format the selected cells with the specified decimal places.
Formatting percentages with decimal places allows you to tailor the precision of your percentage values to meet your specific needs. You can choose to display percentage values with zero decimal places for whole numbers or increase the decimal places for more accurate calculations.
Keep in mind that formatting percentages with decimal places only affects the display of the values; it does not change the underlying decimal numbers that Google Sheets uses for calculations. If you need to perform calculations with the formatted percentage values, Google Sheets will use the underlying decimal numbers to ensure accurate results.
Now that you know how to format percentages with decimal places, let’s move on to the next section and learn how to round percentages in Google Sheets.
Rounding percentages in Google Sheets
Rounding percentages in Google Sheets allows you to simplify your data and make it easier to interpret. There are several rounding functions available that you can use to round percentage values. Here are a few examples:
- ROUND: Use the ROUND function to round a percentage value to a specified number of decimal places. For example, to round a percentage value in cell A1 to two decimal places, you can use the formula
= ROUND(A1, 2). - ROUNDUP: Use the ROUNDUP function to round a percentage value up to the nearest whole number or specified decimal places. For example, to round up a percentage value in cell A1 to the nearest whole number, you can use the formula
= ROUNDUP(A1, 0). - ROUNDDOWN: Use the ROUNDDOWN function to round a percentage value down to the nearest whole number or specified decimal places. For example, to round down a percentage value in cell A1 to the nearest whole number, you can use the formula
= ROUNDDOWN(A1, 0).
By applying rounding functions to your percentage values, you can ensure that your data is presented in a simplified and more digestible format. Rounding can be useful when dealing with large datasets or when you want to make your percentage values more reader-friendly.
Remember that when rounding percentages, consider the context and purpose of your data analysis. It’s essential to strike a balance between rounding to achieve simplicity and retaining enough precision for accurate interpretation.
Now that you know how to round percentages in Google Sheets, let’s explore how to convert percentages to decimals or fractions.
Converting percentages to decimals or fractions
Converting percentages to decimals or fractions in Google Sheets allows you to express your data in alternative formats that may be more appropriate for your analysis or presentation. Here’s how you can convert percentages to decimals or fractions:
- Converting to decimals: To convert a percentage value to a decimal, divide the percentage value by 100. For example, if you have a percentage value of 50%, divide it by 100 to get the decimal value of 0.5.
- Converting to fractions: To convert a percentage value to a fraction, divide the percentage value by 100 and simplify if necessary. For example, if you have a percentage value of 75%, divide it by 100 to get 0.75, which can be simplified to 3/4.
Converting percentages to decimals or fractions can be useful in various scenarios. Decimals are commonly used in mathematical calculations and data analysis, while fractions can be more intuitive for understanding proportions and ratios.
Keep in mind that when converting percentages to decimals or fractions, consider the level of precision required for your data. Rounded values may be more appropriate for general analysis, while precise values may be necessary for more detailed calculations.
Now that you know how to convert percentages to decimals or fractions in Google Sheets, let’s explore how to use conditional formatting with percentages.
Using conditional formatting with percentages
Conditional formatting is a powerful feature in Google Sheets that allows you to highlight cells based on certain conditions. By applying conditional formatting to percentages, you can visually analyze and interpret your data more efficiently. Here’s how you can use conditional formatting with percentages in Google Sheets:
- Select the range of cells: Highlight the range of cells containing the percentage values you want to format conditionally.
- Go to the “Format” menu: Click on “Format” in the menu bar, and then select “Conditional formatting” from the drop-down menu.
- Set the condition: In the conditional formatting dialog box, choose the condition that you want to apply. For example, you can highlight cells that are above a certain percentage threshold or below another threshold.
- Choose the formatting style: Select the formatting style you want to apply to the cells that meet the condition. You can choose from various formatting options, such as changing the background color, applying bold text, or adding borders.
- Apply the conditional formatting: Click on the “Done” button to apply the conditional formatting to the selected cells. The cells that meet the specified condition will now be formatted according to your chosen style.
Conditional formatting with percentages allows you to quickly identify trends, outliers, and other important insights in your data. By visually emphasizing specific percentage ranges, you can focus your attention on the most relevant information.
Remember that you can customize the conditions and formatting styles according to your specific requirements. Experiment with different color schemes and formatting options to create visual cues that best highlight the patterns and trends in your percentage data.
Now that you know how to use conditional formatting with percentages in Google Sheets, let’s explore how to apply percentage formatting to charts.
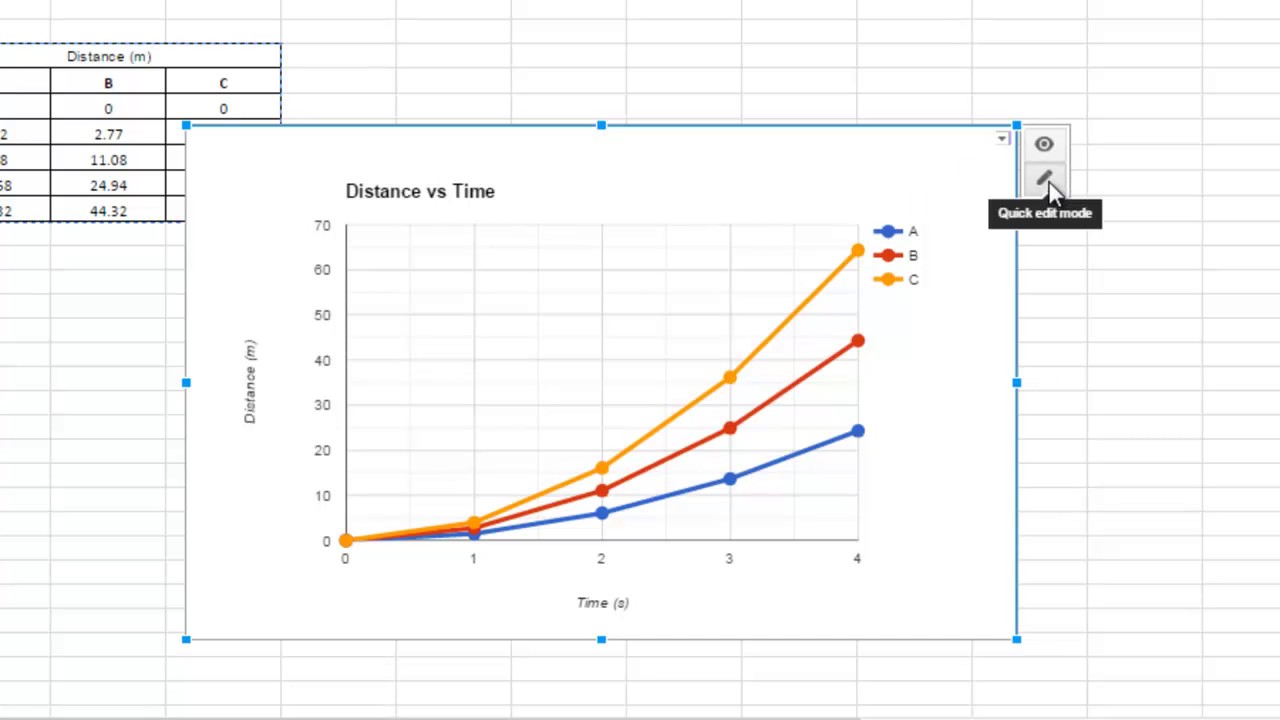
Applying percentage formatting to charts
Applying percentage formatting to charts in Google Sheets allows you to visually represent your percentage data in a clear and impactful way. Here’s how you can apply percentage formatting to charts:
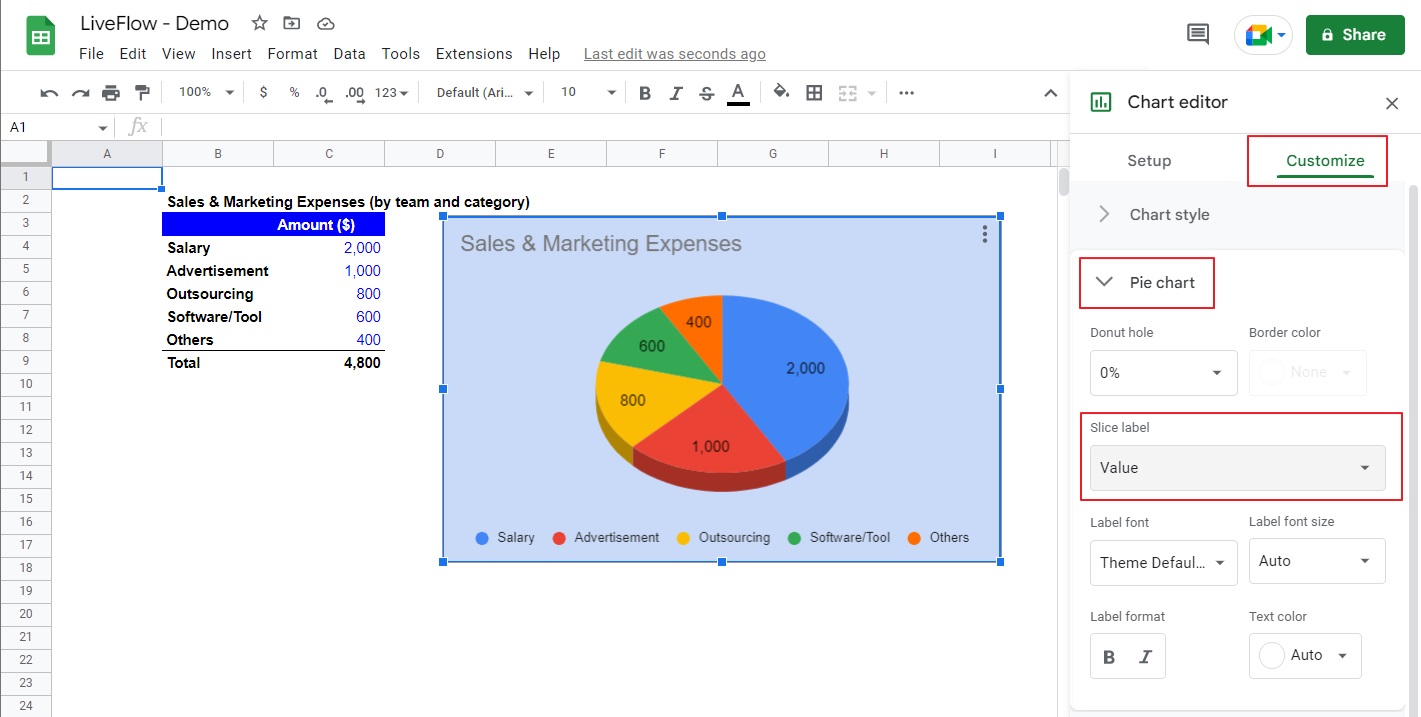
- Create your chart: First, select the data range that you want to include in your chart. Then, click on the “Insert” menu and choose the type of chart you want to create, such as a bar chart, line chart, or pie chart.
- Edit the chart: Once your chart is created, you can customize it by clicking on the chart and using the “Chart editor” sidebar. In the editor, you can modify the chart type, color scheme, labels, and other visual elements to suit your preferences.
- Format the chart axis: In the “Chart editor” sidebar, navigate to the “Axis” tab. Select the axis that represents the percentage data and format it to display as a percentage. Depending on the chart type, it may be the vertical (y) axis or the horizontal (x) axis.
- Adjust the axis options: Within the axis formatting options, you can customize the scale, decimal places, and other properties related to displaying percentages on the chart axis. Make sure to set the decimal places and other formatting settings that align with your desired presentation.
- Review and finalize: Once you have applied percentage formatting to your chart, take a moment to review the changes and ensure that the percentages are displayed accurately and effectively. Make any necessary adjustments to optimize the presentation.
By formatting the axis of your chart to display percentages, you provide a clear visual representation of your percentage data. This formatting helps viewers quickly understand the relative proportions and trends within your data.
Remember to consider the context of your data and the purpose of your chart when formatting percentages. Choose decimal places and other formatting options that best convey the precision and clarity required for your specific analysis or presentation.
Now that you know how to apply percentage formatting to charts in Google Sheets, you have the tools to create impactful visualizations of your percentage data.
Conclusion
Working with percentages in Google Sheets is essential for analyzing data, making calculations, and presenting information in a clear and concise manner. By understanding how to format cells, enter percentages manually, and use formulas for calculations, you can unlock the full potential of this powerful spreadsheet tool.
Formatting cells for percentages allows you to visually represent your data accurately and make it easier to interpret. You can choose the desired decimal places and customize the formatting to suit your needs. Additionally, entering percentages manually gives you precise control over the values you want to work with.
Using formulas to calculate percentages allows you to perform various calculations such as determining the percentage of a total, calculating percentage change, or percentage distribution. You can also use the percentage format in calculations to ensure accurate results and maintain the correct formatting of the output.
Furthermore, rounding percentages can simplify your data and make it more reader-friendly, while converting percentages to decimals or fractions provides alternative ways to express your data based on the context and purpose of your analysis.
Conditional formatting with percentages allows you to visually highlight specific ranges of percentage values, enabling you to identify patterns, trends, and outliers in your data more efficiently. Applying percentage formatting to charts enhances the visual representation of your data, making it easier for viewers to understand the relative proportions and trends within the data.
In conclusion, mastering the techniques of working with percentages in Google Sheets empowers you to efficiently analyze data, perform calculations, and present information with clarity. Whether you are managing personal finances, working on a business project, or conducting data analysis, the ability to work with percentages effectively in Google Sheets is a valuable skill that can elevate your work to the next level.