Introduction
Welcome to this guide on how to debug PHP in Chrome. As a developer, you know that debugging is an essential part of the programming process. It allows you to identify and fix issues in your code, ensuring that your PHP applications run smoothly.
While there are various tools available for PHP debugging, one popular option is using Xdebug combined with Google Chrome’s built-in developer tools. This powerful combination allows you to step through your code, set breakpoints, inspect variables, and much more, right from your browser.
In this tutorial, we will walk you through the process of setting up Xdebug, configuring your PHP environment, enabling Xdebug in Chrome, and using it to debug your PHP code. Whether you’re a seasoned developer or just starting your PHP journey, this guide will provide you with the knowledge and tools you need to streamline your debugging process.
Before we dive in, it’s important to note that debugging can consume system resources and may slow down the execution of your code. Therefore, it’s recommended to enable Xdebug only when you need to debug your PHP applications, and disable it during regular development or production use.
Now, let’s get started with installing and setting up Xdebug for PHP debugging in Chrome.
Installing and Setting Up Xdebug
To begin debugging your PHP code in Chrome, you’ll need to install and configure Xdebug. Xdebug is an extension for PHP that provides enhanced debugging capabilities.
The installation process for Xdebug may vary depending on your operating system and PHP setup. However, here are the general steps to follow:
- Check if Xdebug is already installed: Before installing Xdebug, it’s always a good idea to check if it’s already installed on your system. You can do this by running the command `php -m` in your terminal or command prompt and searching for `xdebug` in the list of installed modules. If it’s not listed, you can proceed with the installation process.
- Download Xdebug: Visit the Xdebug website (https://xdebug.org/) and download the appropriate version of Xdebug for your PHP setup. Make sure to download the version that matches your PHP version and architecture (32-bit or 64-bit).
- Install Xdebug: Next, you’ll need to install Xdebug on your system. The installation process can vary depending on your operating system. For example, on Linux, you may need to compile Xdebug from source, while on Windows, you can simply copy the downloaded DLL file to your PHP extension directory.
- Configure PHP to use Xdebug: After installing Xdebug, you need to configure PHP to load the Xdebug extension. Open your PHP.ini file (location can vary depending on your setup) and add the following line at the end of the file:
zend_extension=path/to/xdebug.so (or xdebug.dll on Windows)
Make sure to replace `path/to/xdebug.so` with the actual path to the Xdebug extension file you downloaded and installed.
Once you have completed these steps, Xdebug should be installed and ready to use with your PHP setup. In the next section, we will discuss how to configure PHP.ini for Xdebug.
Configuring PHP.ini
After installing Xdebug, the next step is to configure your PHP.ini file to enable and customize Xdebug’s functionality. The PHP.ini file contains various settings and configurations for PHP, including extensions like Xdebug.
To configure PHP.ini for Xdebug, follow these steps:
- Locate your PHP.ini file: The location of the PHP.ini file can vary depending on your operating system and PHP installation. Common locations include `/etc/php.ini` on Linux, `C:\php\php.ini` on Windows with a default installation, or you can run `php –ini` command to find the loaded configuration file.
- Open PHP.ini: Use a text editor to open the PHP.ini file.
- Enable Xdebug: Look for the section `[Xdebug]` inside the PHP.ini file. If it doesn’t exist, you can add it at the end of the file. Uncomment or add the following lines to enable Xdebug:
zend_extension=path/to/xdebug.so (or xdebug.dll on Windows)

[xdebug]
xdebug.remote_enable=1
xdebug.remote_host=127.0.0.1
xdebug.remote_port=9000
In the above example, we have enabled Xdebug and configured it to listen for remote debugging connections from the localhost on port 9000. You can adjust these settings as per your requirements. For example, you can change `xdebug.remote_host` to your machine’s IP address if debugging from a different machine.
Save the changes to PHP.ini and restart your web server for the changes to take effect. In the next section, we will explore how to configure PhpStorm for Xdebug.
Configuration in PhpStorm
PhpStorm is a popular PHP IDE that provides excellent support for debugging PHP applications. To set up PhpStorm for Xdebug, follow these steps:
- Open PhpStorm: Launch PhpStorm and open the project you want to debug.
- Configure the PHP interpreter: Go to “Preferences” (or “Settings” on Windows) and navigate to “Languages & Frameworks” > “PHP”. Make sure that the correct PHP interpreter is selected. If not, click on the ellipsis (…) button and select the appropriate interpreter.
- Configure the Debugger: In the same “Preferences” window, navigate to “Languages & Frameworks” > “PHP” > “Debug”. Check the box that says “Xdebug” to enable the Xdebug debugger.
- Configure the Debugging Port: In the “Preferences” window, go to “Languages & Frameworks” > “PHP” > “Debug”. Ensure that the “Debug port” is set to the same port specified in your PHP.ini file’s `xdebug.remote_port` setting (usually 9000 by default).
- Apply and save your changes.
At this point, PhpStorm is configured to work with Xdebug. In the next section, we will cover how to enable Xdebug in Google Chrome.
Enabling Xdebug in Chrome
Once you have Xdebug installed and configured in PHP and PhpStorm, the next step is to enable Xdebug in Google Chrome. To do this, follow these steps:
- Install the Xdebug Helper extension: Open the Chrome Web Store and search for “Xdebug Helper”. Install the extension to your Chrome browser.
- Enable the Xdebug Helper extension: After the Xdebug Helper extension is installed, click on its icon in the Chrome toolbar. In the popup window, click on the “Options” link.
- Configure the Xdebug Helper extension: In the Xdebug Helper options, set the “IDE Key” to “PhpStorm” (or your desired IDE key). This key is used to identify the debugger (PhpStorm) on the server side.
- Enable the extension for your PHP project: In the Xdebug Helper options, select the “Enable” checkbox next to your project’s URL or IP address. This enables Xdebug only for the project you are working on, preventing it from slowing down other web applications.
- Save the changes and reload your PHP application: After configuring the Xdebug Helper extension, save the changes and reload your PHP application in Chrome.
With Xdebug enabled in Chrome, the browser will now send debugging information to PhpStorm when you access your PHP application. In the next section, we will explore how to set up breakpoints in PhpStorm for effective debugging.
Setting Up Breakpoints in PhpStorm
Breakpoints are markers that you can set in your code to pause the execution and inspect the values of variables, trace the flow of execution, and analyze the behavior of your PHP application. PhpStorm provides a user-friendly interface for setting up breakpoints. Follow these steps to set up breakpoints in PhpStorm:
- Open the file you want to debug: First, open the PHP file in PhpStorm where you want to set the breakpoint. You can either navigate to the file using the project view or search for it in the file search.
- Locate the line to set the breakpoint: Identify the line of code where you want to pause the execution of your PHP application. Click on the left margin of that line to set a breakpoint. A red dot will appear to indicate a breakpoint.
- Set conditional breakpoints (optional): If you want to conditionally pause the execution of your application based on certain conditions, you can set conditional breakpoints. Right-click on the breakpoint and select “Edit Breakpoint” to add conditions.
Once breakpoints are set, you are ready to start debugging your PHP code in Chrome. In the next section, we will cover the process of debugging your PHP code in Chrome and PhpStorm.
Debugging Your PHP Code in Chrome
Now that you have Xdebug enabled in Chrome and breakpoints set in PhpStorm, you can start debugging your PHP code. Here’s how:
- Open your PHP application in Chrome: Enter the URL of your PHP application in the Chrome address bar and press Enter.
- Trigger the execution of your PHP code: Perform the actions in your PHP application that will cause the code to execute and hit the breakpoints you have set. For example, submit a form, click a button, or navigate to a specific page.
- Pause at breakpoints: When the execution reaches a breakpoint, Chrome will pause the code execution, and PhpStorm will automatically switch to debugging mode.
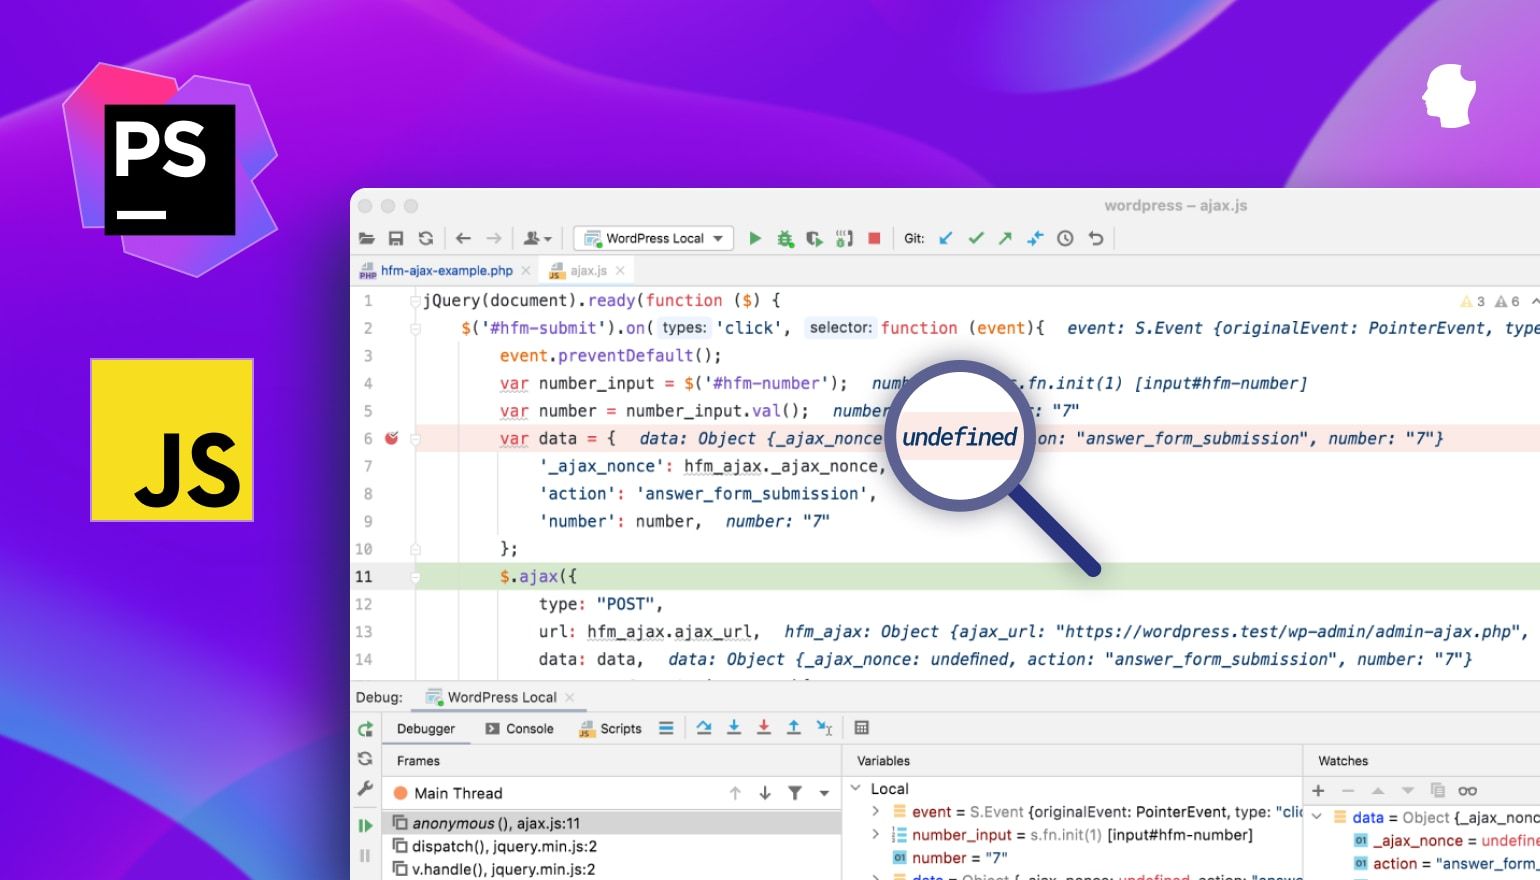
- Inspect variables and expressions: While at the breakpoint, you can inspect the values of variables and expressions in the “Variables” panel of PhpStorm. This allows you to analyze the state of your application at that particular point in the code.
- Step through the code: Use the controls provided in PhpStorm’s debugging toolbar to step through the code line by line. You can step over (execute the current line and move to the next), step into (go deeper into a function call), or step out (exit the current function and go back up the call stack).
- Resume or stop debugging: Once you have analyzed a particular section of code, you can resume the execution by clicking the resume button in the debugging toolbar. If you want to stop debugging, click the stop button.
Repeat these steps as needed to debug different parts of your PHP application. Debugging allows you to identify and fix issues efficiently, leading to more robust and reliable code.
Next, let’s explore some advanced debugging techniques in PhpStorm, such as inspecting variables and expressions, stepping through code, and using watches to monitor variables.
Inspecting Variables and Expressions
When debugging your PHP code in PhpStorm, you can inspect the values of variables and evaluate expressions to gain insights into the state of your application at runtime. Here’s how you can do it:
- While at a breakpoint, open the “Variables” panel in PhpStorm. It will display a list of variables available in the current scope.
- Expand the variable you want to inspect to see its current value. PhpStorm will display the variable’s name, data type, and its current value.
- If you want to evaluate an expression, you can do so in the “Expressions” tab of the “Variables” panel. Simply enter the expression you want to evaluate, and PhpStorm will display the result.
- You can also add variables or expressions to the “Watches” pane for monitoring. Watches allow you to monitor specific variables or expressions continuously, even if you are not at a breakpoint.
Using the variable and expression inspection capabilities in PhpStorm, you can delve deep into your code and gain a deeper understanding of how your PHP application is behaving at runtime. This, in turn, helps you identify and resolve issues more effectively.
Now that you know how to inspect variables and expressions, let’s move on to the next section, where we will cover stepping through your code in PhpStorm.
Stepping Through Code
When debugging your PHP code in PhpStorm, stepping through the code allows you to control the flow of execution and examine how different statements are executed. Here are the different step actions you can take in PhpStorm:
- “Step Over” (F8): This action allows you to execute the current line of code and move to the next line in the same file. If the line contains a function call, the entire function will be executed without stepping into it.
- “Step Into” (F7): Use this action to step into a function call. The debugger will move to the first line of the function definition, allowing you to debug through the function’s code.
- “Step Out” (Shift+F8): If you’re currently debugging inside a function, this action allows you to execute the remaining lines of the function code and return to the calling code.
- “Resume” (F9): When you’re at a breakpoint, you can choose to resume the execution from that point onwards. This is useful if you’ve paused the execution in order to analyze a specific section of code and want to continue normally.
By stepping through your code, you can closely observe the execution flow, monitor variable changes, and identify any issues or unexpected behavior. This is a powerful way to debug your PHP applications effectively.
Next, let’s explore how you can use watches to monitor variables and expressions during debugging.
Using Watches to Monitor Variables
When debugging your PHP code in PhpStorm, watches provide a convenient way to keep track of specific variables or expressions as you step through your code. By adding watches, you can monitor the values of these variables and expressions in real-time. Here’s how you can use watches in PhpStorm:
- While at a breakpoint, open the “Variables” panel in PhpStorm. This panel displays a list of variables available in the current scope.
- Right-click on a variable or expression that you want to monitor, and select “Add to Watches”.
- A new section called “Watches” will appear in the debugging panel, displaying the variables or expressions you have added.
- As you step through your code, PhpStorm will continuously update the values of the watched variables or expressions in the “Watches” section.
- You can hover over a watched variable to see its current value in a tooltip, or right-click on it and select “Evaluate” to evaluate the expression and view its result.
- If you want to remove a watch, simply right-click on it and select “Remove Watch”.
Using watches in PhpStorm allows you to keep an eye on specific variables or expressions of interest without having to manually inspect them each time you hit a breakpoint. This can greatly improve your debugging efficiency and help you gain insights into the behavior of your PHP code.
Now that you know how to use watches, let’s move on to the next section, where we will cover debugging REST APIs with Xdebug in PhpStorm.
Debugging REST APIs
Debugging REST APIs is a common task for PHP developers, and with Xdebug and PhpStorm, it becomes even easier. Here’s how you can debug REST APIs using Xdebug in PhpStorm:
- Configure your REST API endpoint: Make sure your REST API is accessible through a URL or an IP address, as this will be needed for Xdebug to connect to it. Note down the URL or IP address for later use.
- Set breakpoints in your API code: Open the file that contains your API code in PhpStorm. Set the necessary breakpoints at the desired locations in your code where you want to pause the execution for debugging.
- Configure debugging in PhpStorm: In PhpStorm, go to “Preferences” (or “Settings” on Windows) and navigate to “Languages & Frameworks” > “PHP” > “Debug”. Enable Xdebug and ensure that the “Debug port” matches the port specified in your Xdebug configuration.
- Start the debugging session: Start the debugging session in PhpStorm by clicking on the “Debug” button or using the keyboard shortcut. PhpStorm will listen for incoming debug connections.
- Make a request to your API: Using a tool like Postman or a web browser, send a request to the endpoint of your REST API.
- Pause at breakpoints: When the execution reaches a breakpoint in your API code, it will pause, and PhpStorm will switch to debugging mode. You can then inspect variables, step through the code, and analyze the behavior of your API.
- Continue debugging: You can continue stepping through the code, inspecting variables, and making modifications as needed until you have resolved the issue or gained the necessary insights.
Debugging REST APIs with Xdebug and PhpStorm provides you with a powerful toolset to identify and fix issues in your API code. It allows you to analyze the flow of data and spot any errors or unexpected behavior, leading to more robust and reliable API implementations.
Now that you know how to debug REST APIs, let’s wrap up this guide with a quick summary.
Conclusion
Debugging PHP code is an essential skill for developers, and with the power of Xdebug and PhpStorm, the process becomes much more efficient and effective. In this guide, we have covered the steps to install and set up Xdebug, configure PHP.ini, and configure PhpStorm for PHP debugging. We have also explored how to enable Xdebug in Chrome, set up breakpoints, and step through code. Additionally, we have learned how to inspect variables and expressions, use watches to monitor values, and debug REST APIs.
By leveraging Xdebug and PhpStorm, you can save time and effort when troubleshooting your PHP applications. The ability to pause the execution of your code, inspect variables, and step through the code line by line provides invaluable insights into the inner workings of your PHP programs. This, in turn, allows you to identify bugs, pinpoint performance bottlenecks, and gain a deeper understanding of your code’s behavior.
Remember, while debugging is an essential tool, it is important to use it judiciously and selectively. Enabling Xdebug and running your code in debugging mode can impact performance, so it’s best to enable it only when necessary and disable it during regular development or production use.
By mastering the art of PHP debugging with Xdebug and PhpStorm, you can level up your development skills and become a more efficient, thorough, and confident PHP developer. Happy debugging!