Introduction
Welcome to the world of debugging PHP code with VScode! As a PHP developer, debugging is an essential skill to ensure smooth and error-free execution of your code. Debugging allows you to identify and fix issues in your PHP scripts, such as logical errors, variable discrepancies, or unexpected behavior.
In this article, we will walk through the process of setting up your development environment, installing the necessary extensions, and configuring VScode to debug PHP code effectively. Whether you are a beginner or an experienced programmer, debugging with VScode will help streamline your development workflow and save you valuable time in the debugging process.
Debugging is the process of analyzing and solving problems that occur in your code. It involves setting breakpoints, stepping through the code, inspecting variables, and handling exceptions to understand the flow of execution and locate any errors or anomalies. VScode, with its powerful debugging features and extensions, provides a convenient environment to debug PHP code effectively.
Throughout this article, we will explore various techniques and tools available in VScode to enhance your debugging experience. You’ll learn how to set breakpoints, step through code, inspect variables, and handle exceptions. Additionally, we’ll discuss how to debug remote PHP files, allowing you to debug code on a server or with a different local setup.
Debugging PHP code with VScode will empower you to write cleaner and bug-free code. It will help you uncover hidden issues and optimize your PHP applications, resulting in more robust and efficient software. So, let’s dive into the world of PHP debugging with VScode and sharpen our troubleshooting skills!
Setting up the Environment
Before we can start debugging PHP code with VScode, we need to set up our development environment. Here are the steps to get started:
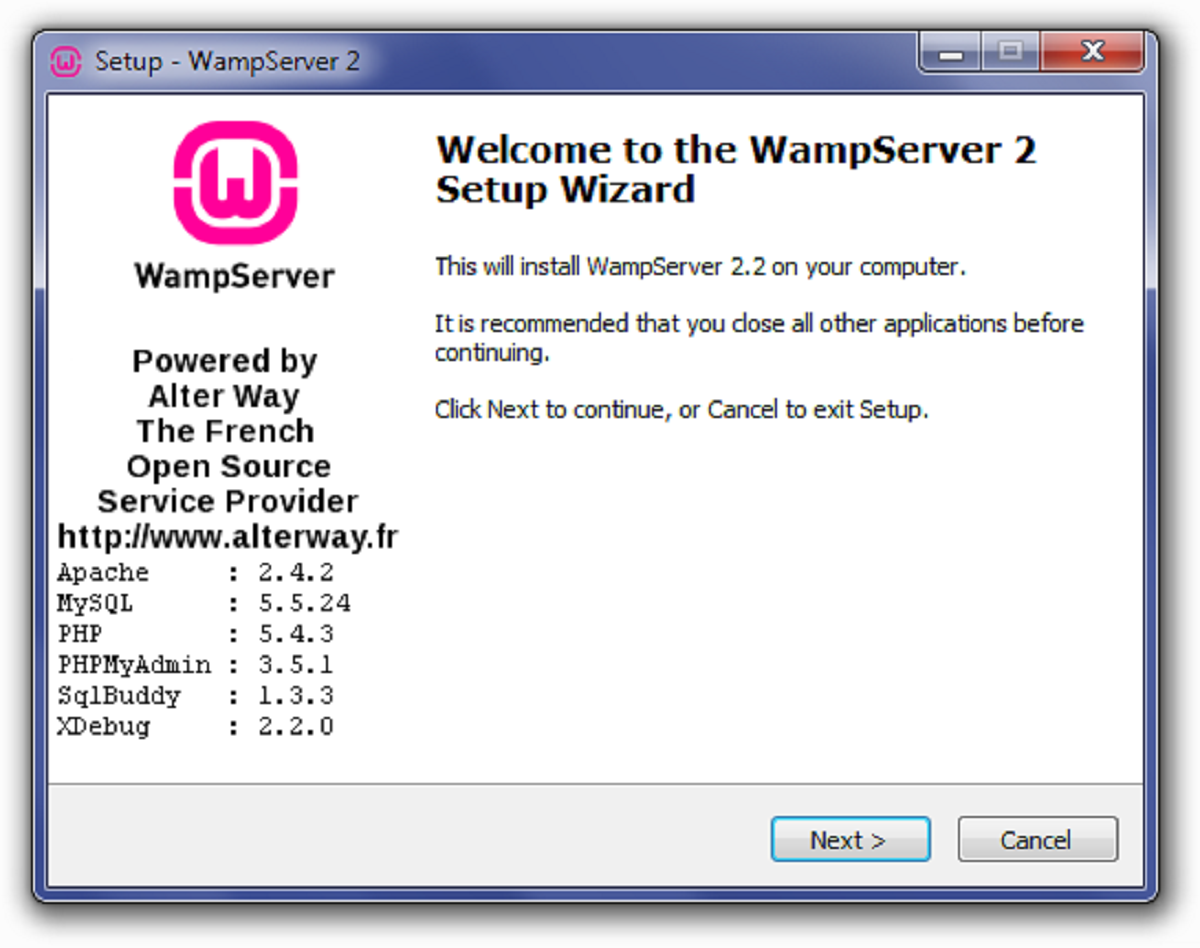
- Install PHP: Make sure PHP is installed on your system. You can download the latest version of PHP from the official website and follow the installation instructions for your operating system.
- Install VScode: If you haven’t already, download and install Visual Studio Code from the official website. VScode is a lightweight and highly customizable code editor that provides a rich set of features for modern development.
- Install PHP Extension for VScode: Launch VScode and navigate to the Extensions view (shortcut: Ctrl+Shift+X). Search for “PHP” and install the “PHP Intellisense” extension by Felix Becker. This extension provides PHP code completion and syntax highlighting.
With PHP and VScode installed, we have the foundation of our debugging environment. Now, let’s proceed to install the PHP Debug extension, which will enable us to debug PHP code directly within VScode.
To be continued in next section…
Installing VScode PHP Debug Extension
Once you have set up your development environment by installing PHP and VScode, the next step is to install the PHP Debug extension in VScode. This extension will allow us to debug our PHP code seamlessly within the editor. Here’s how to install it:
- Open the Extensions view: In VScode, press Ctrl+Shift+X (or Cmd+Shift+X on macOS) to open the Extensions view. Alternatively, you can navigate to the sidebar and click on the square icon with four squares.
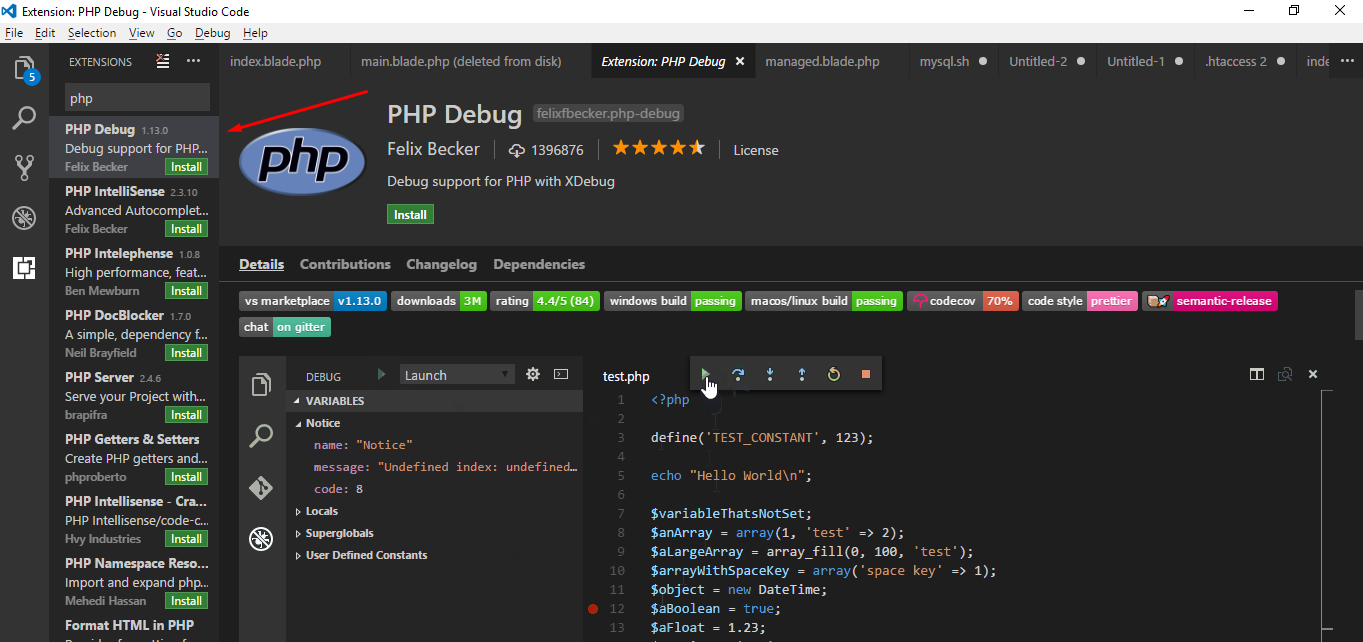
- Search for PHP Debug: In the Extensions view, type “PHP Debug” in the search bar. Look for the extension called “PHP Debug – Felix Becker” and click on the Install button.
- Wait for installation: The extension will be downloaded and installed automatically. You will see a progress bar indicating the installation status. Once the installation is complete, click on the Reload button to activate the extension.
- Verify the installation: To ensure that the PHP Debug extension has been successfully installed, go to the Extensions view and search for “PHP Debug” again. You should see the extension listed as installed.
Congratulations! You have now successfully installed the PHP Debug extension in VScode. This extension provides powerful debugging features, such as setting breakpoints, stepping through code, and inspecting variables, making the debugging process more efficient and effective.
In the next section, we will dive into the configuration of the debug environment in VScode, which is crucial for setting up breakpoints and customizing the debugging experience according to your requirements.
Configuring the Debug Environment
Now that you have installed the PHP Debug extension in VScode, it’s time to configure the debug environment to ensure seamless debugging of your PHP code. Here’s how you can configure the debug environment:
- Create a launch configuration: In VScode, go to the Run view by clicking on the “Run” icon in the sidebar or using the shortcut Ctrl+Shift+D (or Cmd+Shift+D on macOS). In the Run view, click on the gear icon to open the drop-down menu, then select “PHP” as the environment for creating the launch configuration.
- Edit the launch configuration: VScode will open the launch.json file, which contains the configuration settings for debugging PHP code. By default, this file is located in the “.vscode” folder of your workspace. You can customize the launch configuration according to your preferences, such as specifying the PHP executable path and setting up remote debugging.
- Set breakpoints: Breakpoints are essential for pausing the execution of your PHP code at specific lines. To set a breakpoint, click on the line number in the editor where you want the execution to pause. A red circle will appear to indicate the breakpoint. You can set breakpoints throughout your code to analyze the state and flow of execution.
- Start debugging: Once you have configured the launch configuration and set breakpoints, you can start debugging by clicking on the “Start Debugging” button in the Run view. Alternatively, you can use the F5 key as a shortcut. The execution will pause at the breakpoints, allowing you to inspect variables, step through the code, and analyze the behavior of your PHP script.
By configuring the debug environment in VScode, you have empowered yourself with the ability to control the execution flow of your PHP code and gain valuable insights into its behavior. The launch configuration, breakpoints, and debugging tools provided by VScode’s PHP Debug extension will enhance your efficiency in resolving errors and understanding the inner workings of your PHP applications.
In the next section, we will explore how to effectively use breakpoints to pause the execution of your PHP code and inspect the state of variables at specific points in your program.
Using Breakpoints
Breakpoints are an essential tool for debugging PHP code effectively. They allow you to pause the execution of your code at specific lines or conditions, giving you the opportunity to inspect variables, track the flow of execution, and identify issues. Here’s how you can use breakpoints in VScode:
- Setting breakpoints: To set a breakpoint, open the PHP file you want to debug in VScode and navigate to the line where you want the execution to pause. Click on the line number in the editor, and a red dot will appear to indicate the breakpoint. You can set multiple breakpoints throughout your code to analyze different sections.
- Conditional breakpoints: In addition to regular breakpoints, you can set conditional breakpoints that only pause the execution when a specific condition is met. Right-click on a breakpoint and select “Edit Breakpoint”. In the input field, you can enter an expression or condition that needs to be true for the breakpoint to trigger. This is useful when you want to narrow down your focus on specific scenarios or variables.
- Removing breakpoints: To remove a breakpoint, simply click on the red dot on the line number, and it will be removed. Alternatively, you can use the “Toggle Breakpoint” option in the context menu by right-clicking on the line number.
- Enable/disable breakpoints: If you have set multiple breakpoints and want to temporarily disable some of them, you can right-click on the breakpoints and select “Enable Breakpoint” or “Disable Breakpoint”. This allows you to control which breakpoints are active during a debugging session.
Once you have set your breakpoints, you can start the debugging session by clicking on the “Start Debugging” button in the Run view. The execution of your PHP code will pause at the defined breakpoints, giving you an opportunity to inspect variables, view the call stack, and evaluate expressions in the Debug Console. After analyzing the state of your code, you can continue the execution or step through the code, line by line, using the provided controls in the Debug view.
Using breakpoints effectively in VScode will significantly speed up your debugging process, as it allows you to focus on specific sections of your code that are causing issues or require further investigation. By pausing the execution at breakpoints, you can analyze the state of variables, evaluate conditions, and gain insights into the flow of your PHP script.
In the next section, we will explore how to step through the code and execute it line by line to understand its behavior and identify any potential errors or inconsistencies.
Stepping through the Code
Stepping through the code is a fundamental technique in debugging PHP applications. It allows you to execute your code line by line, inspect variables, and observe the flow of execution to identify errors or unexpected behavior. VScode provides various stepping options that facilitate this process. Here’s how you can step through the code:
- Step Over: The Step Over command allows you to execute the current line of code and move to the next line. This is useful when you want to quickly traverse through your code without diving into function or method calls. You can use the F10 key as a shortcut for this command.
- Step Into: The Step Into command enables you to move to the next line of code and enter any function or method call encountered. By stepping into the code, you can closely examine the behavior and variables within the function. You can use the F11 key as a shortcut for this command.
- Step Out: The Step Out command allows you to quickly exit the current function or method and continue execution from the calling line. This is useful when you no longer need to analyze the internal details of the function and want to move to the next higher-level context. You can use the Shift+F11 key as a shortcut for this command.
- Continue: The Continue command lets you resume the execution of your code from the current paused state. This is useful when you have finished inspecting the variables and want to proceed further without stepping through each line. You can use the F5 key as a shortcut for this command.
- Step Back: VScode also provides the Step Back command, which allows you to go back to the previous line of code. This is helpful when you want to navigate back and review the execution flow or reevaluate a certain section of code. However, it’s important to note that Step Back is only available if your debugger supports reverse debugging.
By utilizing these stepping commands in VScode, you gain control over the execution flow of your PHP code and gain insights into its behavior at each line. Stepping through the code allows you to detect issues, identify unexpected behavior, and verify the correctness of your program’s logic. It’s a powerful tool that enhances your debugging capabilities and gives you a deeper understanding of your PHP code.
In the next section, we will explore how to inspect variables, view their values, and track their changes during the debugging process using VScode’s powerful debugging features.
Inspecting Variables
Inspecting variables is a crucial aspect of debugging PHP code. It allows you to examine the values assigned to variables, track their changes, and understand how they impact the flow and behavior of your program. With VScode’s powerful debugging capabilities, you can easily inspect variables and gain insights into your code. Here’s how you can do it:
- Variables view: In the Debug view of VScode, you can find the “Variables” pane, which displays a list of variables currently in scope. Clicking on a variable will expand its details and show its current value.
- Watch expressions: Besides observing variables in the Variables view, you can create watch expressions. These are expressions or variables that you can add manually to monitor their values during the debugging process. Simply right-click in the Variables view, select “Add Watch Expression,” and enter the desired expression or variable name.
- Hover over variables: Another handy way to inspect variables is by hovering over them in the editor. Place your mouse cursor over a variable in your code, and a tooltip will appear, displaying the current value of the variable.
- Evaluating expressions: In the Debug Console of VScode, you can type expressions directly and evaluate them. This allows you to perform calculations, call functions, or evaluate complex expressions to gain a deeper understanding of your code’s behavior.
- Variable highlighting: When stepping through your code, VScode highlights variables that have undergone changes since the previous line. This helps you quickly identify modifications and track the flow of values during execution.
By inspecting variables in your PHP code, you can detect discrepancies, identify incorrect values, and understand how they impact the overall behavior of your program. With VScode’s debugging features, you have powerful tools at your disposal to closely analyze and monitor variables, ensuring the accuracy and integrity of your PHP code.
In the next section, we’ll explore how to handle exceptions during the debugging process and effectively troubleshoot errors in your PHP code.
Handling Exceptions
Exception handling is a critical aspect of writing robust PHP code. Exceptions allow you to handle unforeseen errors and exceptional situations that may occur during the execution of your program. With VScode’s debugging features, you can effectively handle and debug exceptions to identify and resolve issues. Here’s how you can handle exceptions in VScode:
- Exception breakpoints: Exception breakpoints allow you to pause the execution of your code when a specific exception is thrown. In the Breakpoints view of VScode, you can click on the “+” icon and select “Exception Breakpoint” to specify the type of exception you want to catch. When the specified exception is thrown, the execution will pause at the relevant line, enabling you to investigate the exception and its associated error.
- Exception stack trace: When an exception is triggered during the debugging process, VScode will display the exception details in the Debug Console. This includes the type of exception, error message, and the file and line number where the exception was thrown. Analyzing the stack trace helps you understand the sequence of function calls and trace back to the origin of the exception.
- Exception messages: In addition to the stack trace, VScode allows you to display exception messages in the Variables view. This provides you with immediate visibility into the error message associated with the exception, making it easier to pinpoint the cause of the exception and its impact on your code.
- Exception handling: When the execution pauses at an exception breakpoint, you can analyze the state of variables, evaluate expressions, and step through the code to troubleshoot the exception. By understanding the context and variables involved, you can implement appropriate exception handling logic to gracefully handle the exception and prevent further issues.
Handling exceptions effectively during the debugging process enables you to identify and resolve errors, ensuring the smooth and reliable execution of your PHP code. With VScode’s debugging features, you have the tools necessary to catch exceptions, analyze their details, and implement necessary changes to enhance the resilience of your application.
In the next section, we’ll explore how to debug remote PHP files, allowing you to debug PHP code on a server or with a different local setup.
Debugging Remote PHP Files
Debugging remote PHP files enables you to debug PHP code that is running on a remote server or in a different local setup. This is particularly useful when working on projects that are deployed on a server or when collaborating with team members. With VScode’s debugging capabilities, you can easily set up and debug remote PHP files. Here’s how:
- Configure SSH access: If you need to debug PHP files on a remote server, you will first need to establish SSH access to the server. Ensure that you have the necessary credentials and permissions to connect to the server using SSH.
- Set up SSH remote connection: In VScode, install the “Remote – SSH” extension. This extension allows you to connect to remote servers and work with files and terminals as if you were directly on the server. Use the extension to establish an SSH connection to your remote server.
- Open remote PHP project: Once connected to the remote server, open the PHP project in VScode. You can use the built-in file explorer or the “Open Folder” functionality to navigate to the project directory on the remote server.
- Configure launch configuration: Next, configure the launch configuration for the remote PHP project. In the Debug view of VScode, click on the gear icon and select “PHP”. Edit the launch.json file to specify the necessary configurations, such as the server address, PHP executable path, and debugging options.
- Start debugging: With the launch configuration set up, start the debugging session. VScode will initiate the remote debugging process and connect to the remote server to execute the PHP code. You can set breakpoints, step through the code, and inspect variables, just like you would with local PHP files.
Debugging remote PHP files with VScode provides the convenience and flexibility of working with projects deployed on a server or in different local environments. It allows you to identify and resolve issues that may only arise in specific configurations, ensuring your PHP application functions correctly across various setups.
Debugging remote PHP files greatly enhances collaboration in development teams, as multiple developers can work on different parts of a project simultaneously, debugging their code independently while keeping the overall application integrity intact.
In the next section, we will conclude our exploration of debugging PHP code with VScode and recap the key points we’ve covered throughout this article.
Conclusion
Congratulations! You have now gained valuable insights into debugging PHP code with VScode. We have explored the process of setting up your development environment, installing the PHP Debug extension, configuring the debug environment, and utilizing powerful debugging features.
By setting up breakpoints and stepping through the code, you can gain better visibility into the execution flow and identify issues in your PHP applications. Inspecting variables allows you to understand the state of your program and track any changes that occur during execution. Furthermore, handling exceptions effectively helps you catch and troubleshoot errors gracefully.
VScode’s debugging capabilities also allow you to debug remote PHP files, enabling you to work with code deployed on servers or in different local setups. This enhances collaboration and facilitates efficient debugging in team environments.
Remember to strike a balance between optimizing your code for search engines and providing engaging and informative content for your readers. The results are valuable in driving traffic to your website.
By mastering the art of debugging PHP code with VScode, you will be equipped with the skills to identify and resolve errors, ensuring the smooth and efficient functionality of your PHP applications. Embrace the power of debugging and continuously improve the quality of your code.