Introduction
Welcome to a comprehensive guide on debugging in PHP. Debugging is an essential skill for any developer, as it allows for the identification and resolution of errors or bugs in your code. Whether you are a beginner or an experienced PHP developer, having a solid understanding of debugging techniques can save you countless hours of frustration.
In this article, we will explore various methods and tools you can use to debug your PHP code effectively. We will cover techniques that range from simple echo statements to advanced debugging with IDEs and special debugging extensions. By the end of this guide, you will have the knowledge and resources to efficiently identify and fix bugs in your PHP projects.
Debugging is the process of identifying and fixing errors or bugs in your code. It involves tracing the execution flow, analyzing variables, and troubleshooting any issues that may arise. Effective debugging allows you to gain a deeper understanding of your code and ensures that it runs smoothly and correctly. It is an essential skill for any programmer, as no code is perfect and errors can occur at any stage of development.
Debugging can be a challenging task, but with the right tools and techniques, you can simplify the process and save valuable time. Throughout this guide, we will explore various methods that can help you isolate and resolve issues in your PHP code.
Whether you are developing a small personal project or working on a large-scale application, having a debugging environment set up is crucial. It provides you with the necessary tools and resources to effectively track down and fix bugs. In the next section, we will discuss how to set up a debugging environment for your PHP projects.
So, let’s dive in and discover the different approaches and tools that can make your PHP debugging experience smoother and more efficient.
Setting up a Debugging Environment
Before you can start debugging your PHP code, you need to set up a proper debugging environment. This involves configuring your development environment and installing the necessary tools and extensions. Here are the steps to get started:
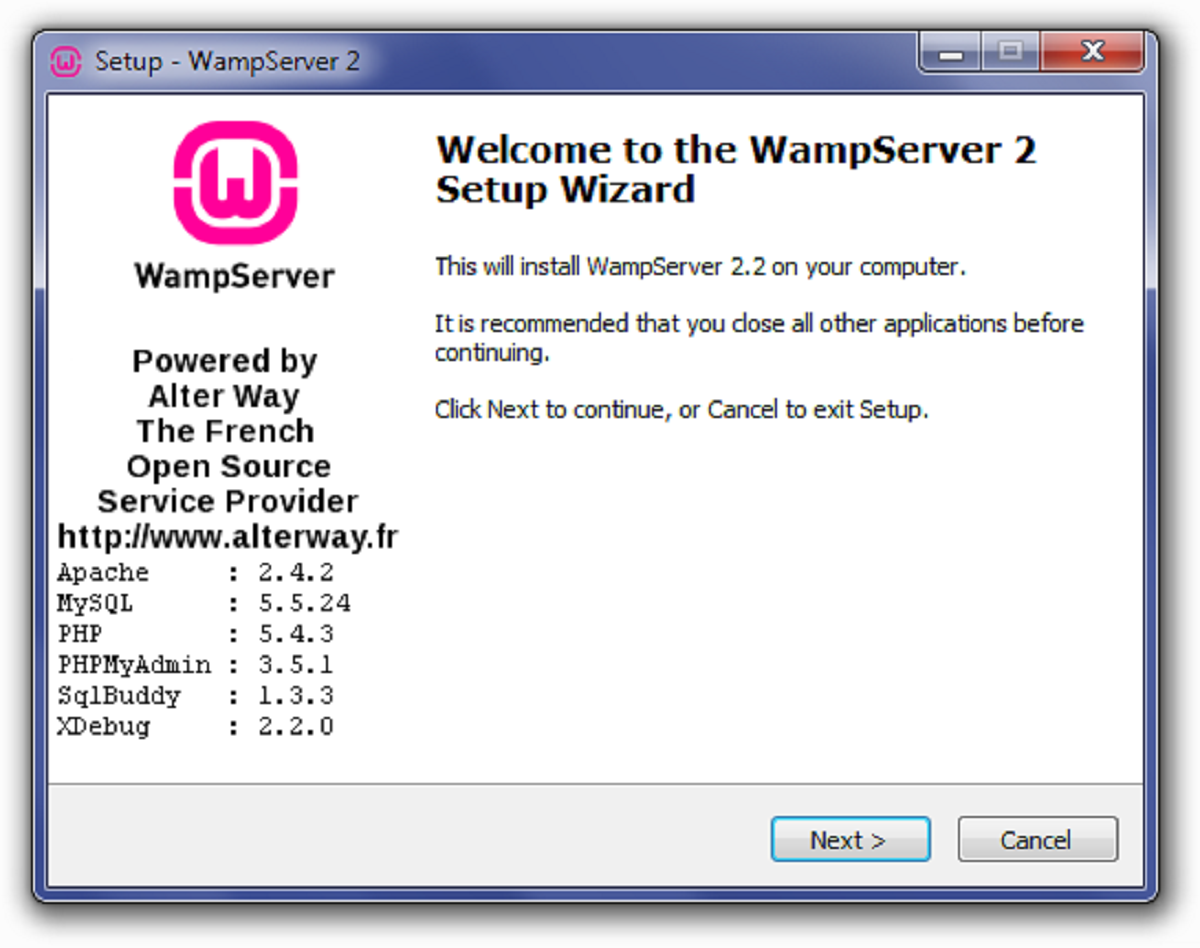
1. Set up a local development server: To begin debugging locally, you’ll need a web server and PHP installed on your local machine. Tools like XAMPP, WampServer, or MAMP provide all-in-one installations that include Apache, PHP, MySQL, and other necessary components. Choose the one that suits your operating system and follow the installation instructions.
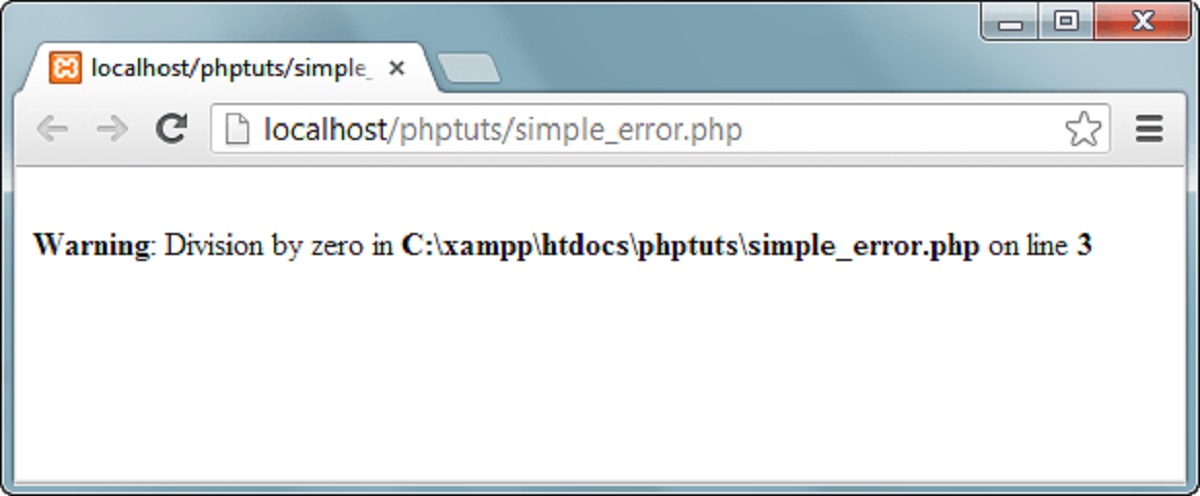
2. Configure error reporting: By default, PHP hides error messages, which can make debugging challenging. To enable error reporting, you can modify your PHP configuration file (php.ini) or add the following lines of code at the beginning of your PHP script:
php
ini_set(‘display_errors’, 1);
error_reporting(E_ALL);
3. Enable logging: Logging errors and debug information can be extremely helpful, especially in complex applications. PHP provides various logging frameworks like Monolog, log4php, and Psr\Log. You can choose one that best fits your needs and configure it to log errors, warnings, and other relevant information.
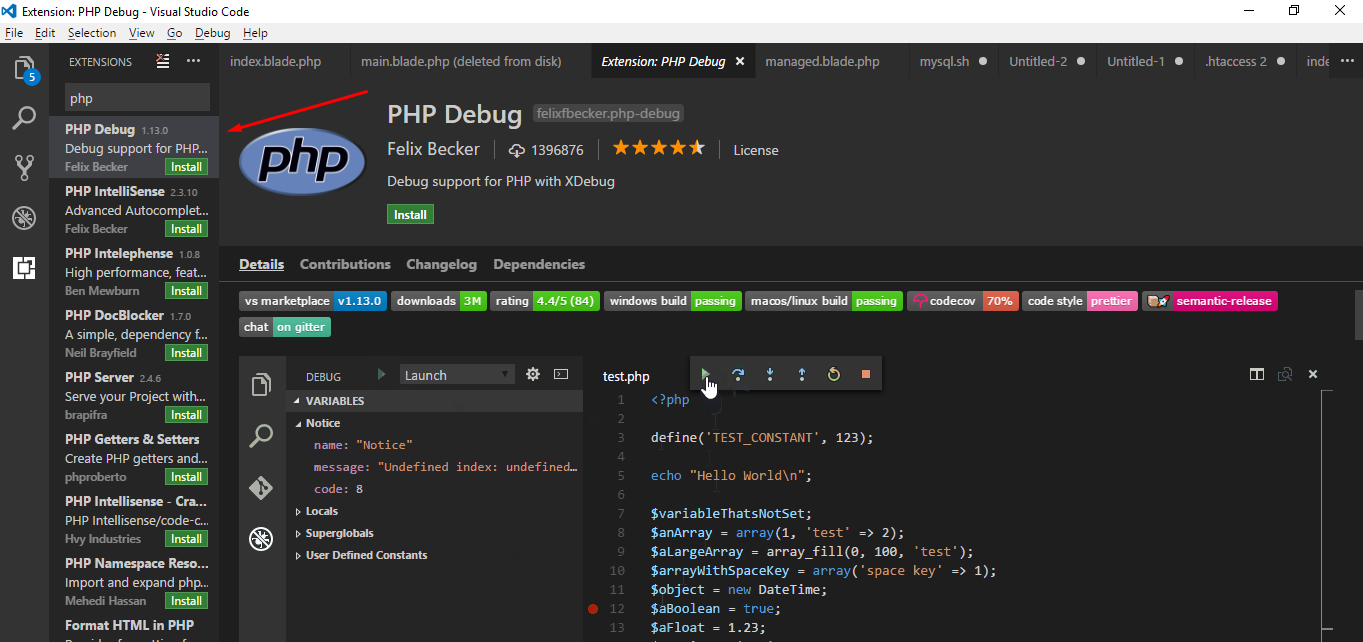
4. Install a debugger extension: Debugger extensions provide advanced debugging features, such as breakpoints, stack traces, and variable inspection. One popular extension is Xdebug, which allows you to step through your code, view variable values, and analyze execution flow. Install Xdebug by following the official documentation and make sure it is enabled in your PHP configuration.
5. Set up an Integrated Development Environment (IDE): IDEs provide powerful debugging tools that can greatly enhance your debugging experience. PhpStorm, NetBeans, and Eclipse are popular IDEs that offer built-in debugging support for PHP. Install your preferred IDE and configure it to connect to your local development server.
By following these steps, you will have a solid debugging environment in place, allowing you to effectively track down and resolve issues in your PHP code. In the next sections, we will explore various debugging techniques and tools that you can utilize to pinpoint and fix bugs.
Using echo statements
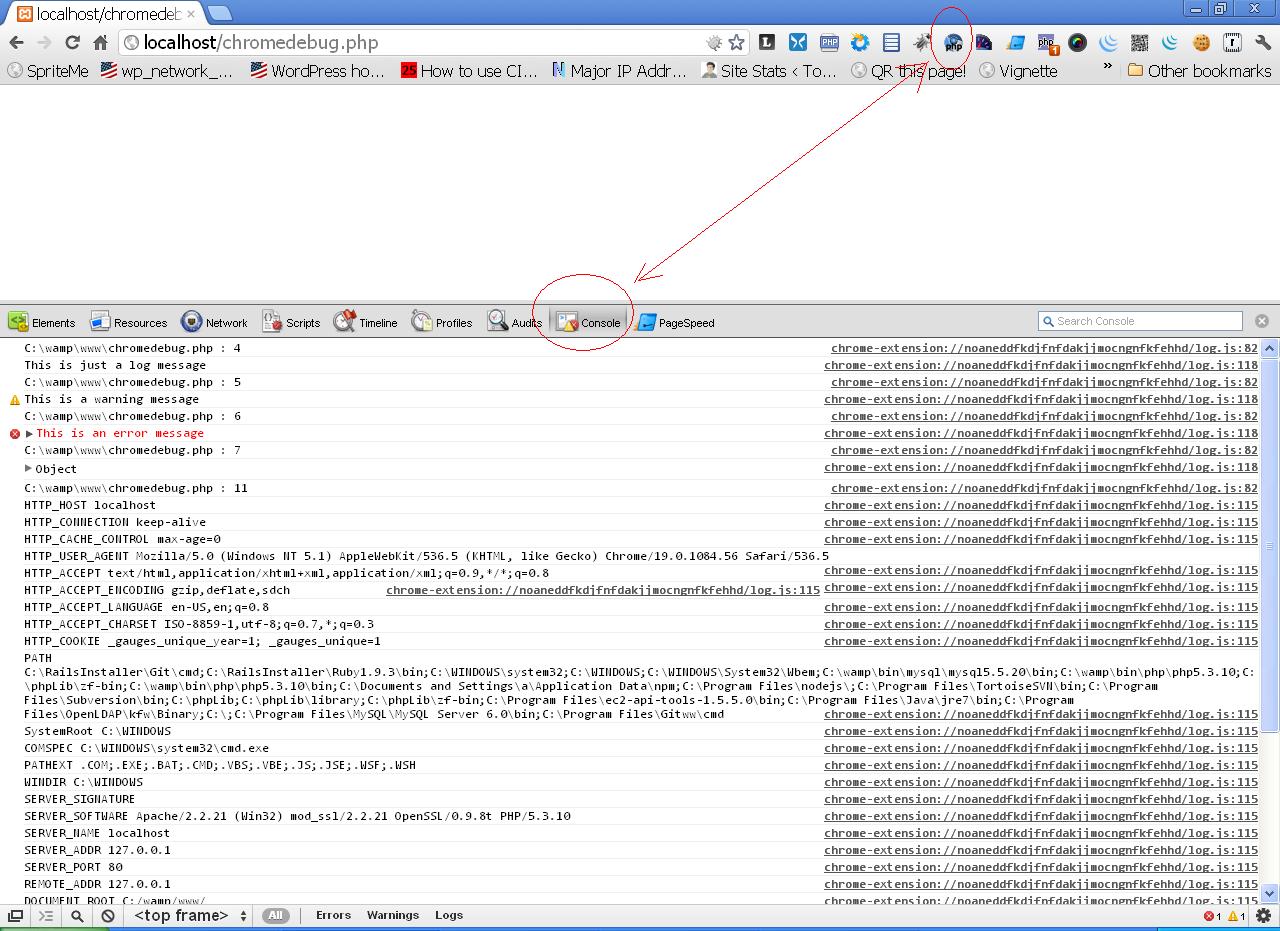
One of the simplest and most basic debugging techniques in PHP is the use of echo statements. By strategically placing echo statements in your code, you can output certain values or messages to the browser or console, helping you to understand the flow of your program and identify any issues. Here’s how you can use echo statements for debugging:
1. Outputting variable values: To inspect the current value of a variable, you can use the echo statement to display it on the web page or in the console. For example:
php
$name = “John Doe”;
echo “The value of name is: ” . $name;
This will output: The value of name is: John Doe which allows you to verify that the variable contains the expected value.
2. Debugging control flow: Echo statements can also be used to indicate certain points or steps in your code to check if the program flow is correct. By adding echo statements at different locations, you can track the execution flow and identify any unexpected behavior. For example:
php
echo “Reached point A”;
// Some code here
echo “Reached point B”;
By inspecting the echoed messages, you can confirm whether the program is following the expected control flow.
3. Outputting error messages: If an error occurs in your code, you can use echo statements to output error messages and provide additional information about the issue. This can be helpful for debugging and troubleshooting errors. For example:
php
if ($quantity < 0) {
echo "Error: Quantity cannot be negative.";
}
This will display the error message on the webpage or in the console, helping you identify the cause of the error.
Using echo statements for debugging is a quick and straightforward method to gain insights into the state of your variables, track program flow, and identify errors. However, it can be time-consuming and clutter your code with debugging statements. That’s why there are more advanced techniques and tools available, which we will explore in the following sections.
Utilizing var_dump() and print_r()
When it comes to inspecting the contents of variables, PHP provides two useful functions: var_dump() and print_r(). These functions allow you to display detailed information about the structure and values of variables, making them invaluable tools for debugging. Let’s explore how they can be utilized:
1. var_dump()
The var_dump() function is particularly useful for examining the type and value of a variable. It provides a detailed output that includes the variable type, length (for strings and arrays), and value. Here’s an example:
php
$name = “John Doe”;
var_dump($name);
The output will be something like:
string(8) “John Doe”
This tells us that the variable $name is a string of length 8, containing the value “John Doe”.
2. print_r()
The print_r() function is similar to var_dump(), but it provides a more readable and concise representation of the variable’s contents. It is especially useful when dealing with arrays or complex data structures. Here’s an example:
php
$colors = array(“red”, “green”, “blue”);
print_r($colors);
The output will be:
Array
(
[0] => red
[1] => green
[2] => blue
)
This clearly shows that the variable $colors is an array with three elements: “red”, “green”, and “blue”.
Utilizing var_dump() and print_r() in your debugging process can provide valuable insights into the structure and contents of your variables. They can help you identify unexpected values, debug complex data structures, and ensure that your program is working as intended. These functions are particularly useful when dealing with large datasets or when you need a comprehensive overview of a variable’s contents.
While var_dump() and print_r() are powerful tools, it’s important to note that they are primarily meant for development and debugging purposes. They should not be used in production code because they can expose sensitive information to potential attackers. Make sure to remove or comment out any debug statements using these functions before deploying your application.
Configuring PHP error reporting
PHP has a built-in error reporting system that helps developers identify and address errors and warnings. By configuring PHP’s error reporting settings, you can control how errors are displayed and logged, making it easier to debug and troubleshoot your PHP code. Let’s explore how to configure PHP error reporting:
1. Displaying errors:
During development, it’s helpful to have PHP display errors on the webpage or in the console. To enable error display, you can modify the PHP configuration file (php.ini) or add the following lines of code at the beginning of your PHP script:
php
ini_set(‘display_errors’, 1);
error_reporting(E_ALL);
The first line sets the display_errors directive to “1”, which means errors will be displayed. The second line sets the error_reporting directive to E_ALL, which instructs PHP to report all types of errors.
2. Logging errors:
Logging errors can be essential for debugging and troubleshooting purposes. PHP provides the error_log directive, which allows you to specify the location where errors should be logged. Add the following line to your PHP script or modify the php.ini file:
php
ini_set(‘error_log’, ‘/var/log/php_error.log’);
This line configures PHP to log errors to the specified file path. Make sure that the file is writable by PHP.
3. Error reporting levels:
PHP allows you to specify the level of error reporting based on your preferences and needs. The error_reporting directive takes different error level constants that can be combined using the bitwise OR operator. Here are some commonly used error levels:
php
error_reporting(E_ALL); // Report all types of errors
error_reporting(E_ERROR | E_WARNING); // Report only fatal errors and warnings
error_reporting(E_ERROR | E_PARSE); // Report only fatal errors and parse errors
Choose the appropriate error level depending on the level of debug information you require.
Configuring PHP error reporting options can help streamline your debugging process by providing clear and concise error messages. By displaying errors on the webpage or in the console and logging them to a file, you can quickly identify and address issues in your PHP code. Remember to adjust the error reporting settings based on the development stage and the level of detail you need.
Using Xdebug for advanced debugging
Xdebug is a powerful debugging extension for PHP that provides advanced features and capabilities to enhance your debugging experience. It offers a wide range of tools that allow you to step through code, set breakpoints, inspect variables, and analyze the execution flow. Let’s explore how to use Xdebug for advanced debugging:
1. Installing and enabling Xdebug:
Before you can use Xdebug, you need to install and enable it in your PHP configuration. The installation process may vary depending on your operating system and PHP version. You can refer to the official Xdebug documentation for detailed instructions.
2. Configuring Xdebug:
Xdebug provides various configuration options that you can customize based on your debugging needs. Some common configuration options include:
- remote_enable: Enable remote debugging functionality.
- remote_autostart: Automatically start the debugger on each request.
- remote_host: The IP address or hostname of the machine running your IDE.
- remote_port: The port number to connect to your IDE.
Make sure to update your php.ini file or the corresponding Xdebug configuration file with the desired settings.
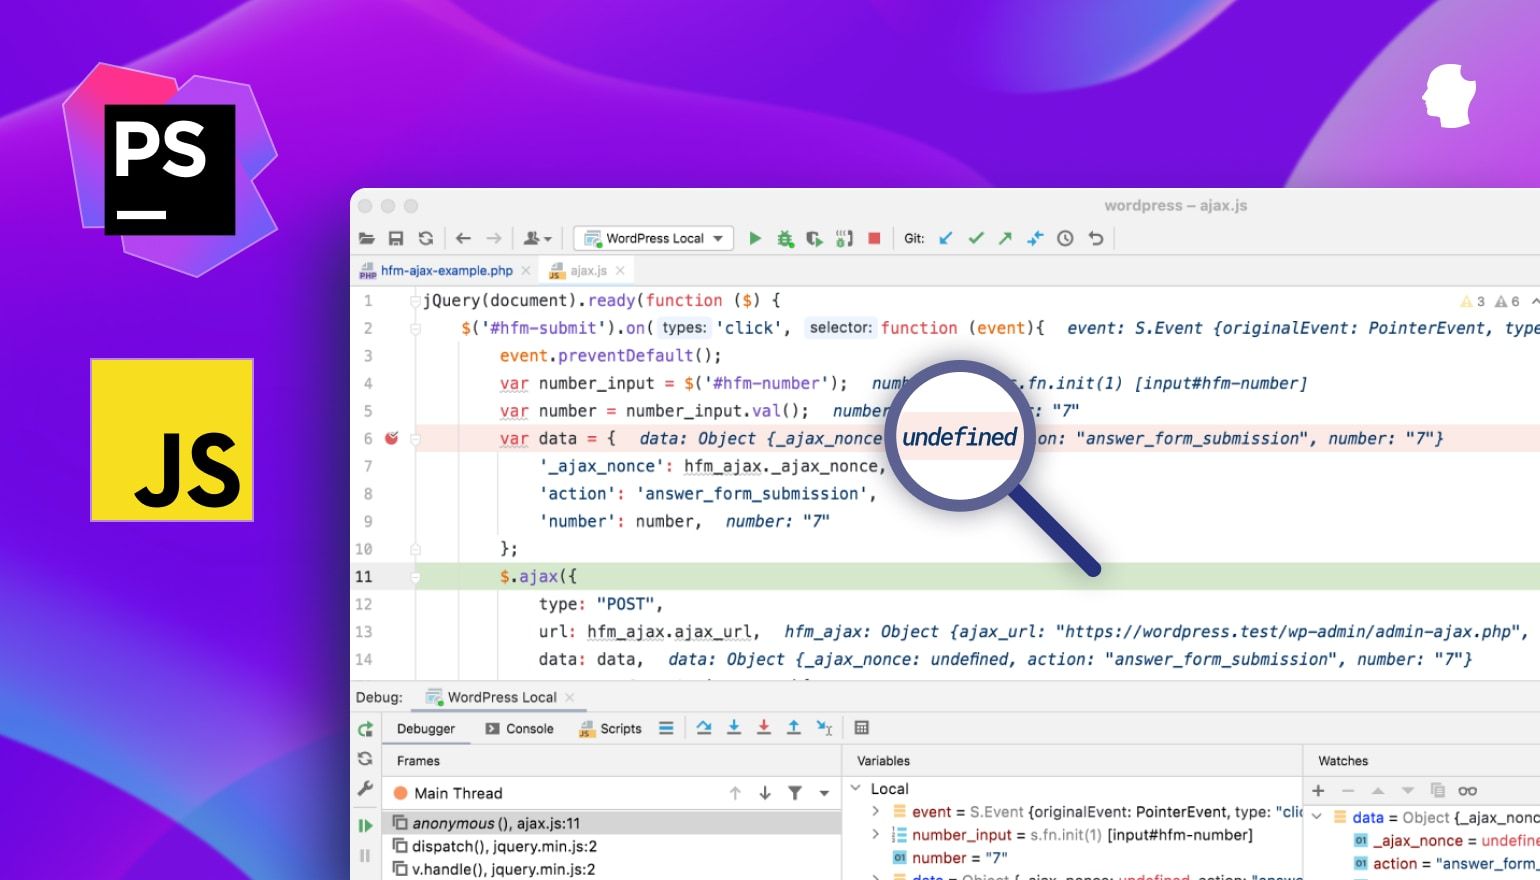
3. Debugging with breakpoints:
One of the key features of Xdebug is the ability to set breakpoints in your code. By placing breakpoints at specific lines, you can pause the execution and inspect the state of variables and the program flow. You can set breakpoints in your IDE by clicking on the line numbers or using keyboard shortcuts. When a breakpoint is hit, the debugger will halt execution and allow you to step through the code.
4. Stepping through code:
Xdebug provides step-by-step debugging options, allowing you to execute code line by line and monitor variables at each step. You can step into functions, step over lines, or step out of functions to analyze the behavior of your code. This helps you identify the exact point where an error occurs or understand how your code is functioning.
5. Inspecting variables and stack traces:
While debugging with Xdebug, you can inspect the values of variables at any given point in your code. This allows you to observe how the values change as the program executes and identify any discrepancies. Additionally, Xdebug provides detailed stack traces that show the sequence of function calls leading up to the current point. Stack traces can be immensely helpful in understanding the program flow and finding the cause of errors.
Using Xdebug for advanced debugging provides an efficient and effective way to analyze your PHP code. By utilizing features like breakpoints, stepping through code, inspecting variables, and examining stack traces, you can gain valuable insights into the execution flow and pinpoint and resolve issues in your code.
Debugging with IDEs: PhpStorm, NetBeans, and Eclipse
Integrated Development Environments (IDEs) provide developers with powerful tools and features to enhance their debugging process. IDEs offer an integrated and streamlined environment for coding, testing, and debugging PHP applications. In this section, we will explore three popular IDEs for PHP development: PhpStorm, NetBeans, and Eclipse.
1. PhpStorm:
PhpStorm, developed by JetBrains, is a widely used IDE for PHP development. It offers comprehensive support for debugging PHP code with its built-in debugger. By integrating with Xdebug, PhpStorm allows you to set breakpoints, step through code, inspect variables, and analyze stack traces. The IDE provides a dedicated Debug panel that displays debugging information and allows you to control the debugging process effortlessly.
2. NetBeans:
NetBeans is a free, open-source IDE that provides excellent debugging capabilities for PHP development. It offers seamless integration with Xdebug, allowing you to set breakpoints, step through code, and inspect variables. NetBeans provides a user-friendly debugging interface with a dedicated Debug window, where you can monitor variables and control the execution of your code during debugging sessions.
3. Eclipse:
Eclipse is a popular IDE known for its extensibility and flexibility. It provides support for PHP development through various plugins. One of the widely used plugins for PHP development in Eclipse is PDT (PHP Development Tools). With the PDT plugin, Eclipse offers debugging features similar to PhpStorm and NetBeans. You can set breakpoints, step through code, and analyze variables in the Eclipse debugging perspective.
These IDEs provide seamless integration with popular debugging extensions like Xdebug, making it easy to set up and use their debugging features. They offer features such as code completion, code navigation, and syntax highlighting, further enhancing the debugging experience. Additionally, they allow you to work with large projects, manage breakpoints, and easily switch between debugging and editing modes.
When choosing an IDE for PHP development and debugging, consider factors like your coding preferences, project requirements, and the specific debugging features and plugins available for each IDE. Experiment with different IDEs to find the one that best suits your needs and enhances your productivity.
Using logging frameworks for debugging
Logging frameworks provide an effective way to capture and store debug information, errors, and messages during the execution of your PHP code. They offer a structured and organized approach to tracking application behavior, making it easier to identify and troubleshoot issues. In this section, we will explore the benefits of using logging frameworks for debugging and discuss two popular logging frameworks: Monolog and log4php.
1. Monolog:
Monolog is a widely used logging framework for PHP that allows you to log messages to various output handlers, such as files, databases, or external services. It offers a straightforward API for logging messages at different levels of severity, including debug, info, warning, and error. Monolog supports multiple log channels, enabling you to separate and categorize log messages based on different parts of your application. With Monolog, you can have granular control over what information gets logged and where it gets stored, making it an excellent choice for debugging purposes.
2. log4php:
log4php is another powerful logging framework that provides comprehensive logging capabilities for PHP applications. It follows the same concepts and principles as its Java-based counterpart, log4j. log4php allows you to configure different log levels, log appenders, and log layouts according to your specific requirements. It supports various output options, including files, databases, email, and Syslog, allowing you to choose the most suitable medium for logging your debug information. log4php also provides features like log rotation and log filtering, giving you fine-grained control over when and what gets logged.
Using logging frameworks for debugging offers several benefits:
- Structured and organized logging: Logging frameworks provide a structured approach to recording debug information, making it easier to analyze and search through log data.
- Runtime insights: Logs can provide valuable insights into the state of your application at runtime, allowing you to understand its behavior and identify potential issues.
- Debug information retention: Logging frameworks allow you to store log data over an extended period, enabling you to refer back to past executions and track the occurrence of specific events or errors.
- Integration with other tools: Logging frameworks can be integrated with external monitoring tools or services, facilitating centralized log management and analysis.
When selecting a logging framework, consider factors such as ease of configuration, compatibility with your current stack, and the specific features and capabilities that the framework provides. Both Monolog and log4php have a large community and offer extensive documentation, making them reliable choices for capturing and analyzing debug information in your PHP applications.
Analyzing stack traces
Stack traces are invaluable resources when it comes to debugging PHP applications. They provide a detailed snapshot of the sequence of function or method calls leading up to an error or exception, allowing you to identify the exact point in your code where the issue occurred. Analyzing stack traces can help you understand the execution flow, trace the origin of errors, and pinpoint the causes of bugs. Let’s explore how to effectively analyze stack traces:
1. Understanding the structure of a stack trace:
A stack trace consists of a list of function or method calls, starting from the current execution point and going back in the call hierarchy. Each entry in the stack trace represents a frame and includes information about the function or method name, the file and line number where it was called, and the calling context. Typically, the most recent calls are listed first, followed by the previous calls in reverse chronological order.
2. Identify the error or exception:
When you encounter an error or exception, look for the relevant part of the stack trace that points to the exact location of the error. The lines in the stack trace will typically highlight the file and line number where the error occurred. This information is crucial for understanding which part of your code is causing the issue.
3. Trace back to the root cause:
Once you have identified the location of the error, trace back through the stack trace to understand how the execution flow led to that point. Examine each function or method call in the stack trace, analyzing the arguments passed and the return values, if present. This will give you insights into the state of variables and objects at each step and help you identify any unintended changes or inconsistencies.
4. Analyze the context:
In addition to the function or method calls, pay attention to the context surrounding each call in the stack trace. Look for any relevant information, such as input values, external dependencies, or conditions, that might have contributed to the error. Understanding the broader context can help you uncover the root cause of the issue and devise an appropriate solution.
5. Utilize debugging tools:
Modern IDEs and debugging extensions often provide a more user-friendly representation of stack traces, allowing you to navigate through the call hierarchy easily. Use the features provided by your debugging tools to inspect variables, set breakpoints, and step through the code, all while referring to the stack trace to understand the overall flow.
Analyzing stack traces is an essential skill for PHP debugging. By mastering the art of dissecting stack traces, you can efficiently track down the root causes of errors, understand the flow of program execution, and ultimately resolve issues in your PHP code.
Debugging database queries and connections
When working with PHP applications that interact with a database, debugging database queries and connections is crucial for ensuring the proper functioning of your application. Errors or misconfigurations in database queries and connections can lead to unexpected behavior or failure in retrieving or storing data. Let’s explore some key techniques for debugging database queries and connections:
1. Enable error reporting for database connections:
Make sure you have enabled error reporting for database connections in your PHP code. This can be achieved by setting the error reporting level to include database-related errors. For example:
php
mysqli_report(MYSQLI_REPORT_ERROR | MYSQLI_REPORT_STRICT);
Enabling error reporting for database connections helps you identify and troubleshoot issues related to establishing a connection to the database server.
2. Check connection credentials:
Verify that the database connection credentials (hostname, username, password, and database name) are correct. Incorrect credentials can prevent your application from connecting to the database. Check for typos, missing characters, or any other mistakes in the configuration.
3. Verify database server availability:
Ensure that the database server is running and accessible. Sometimes, connection issues can occur if the database server is down or unreachable. Check the server status and network connectivity to ensure your PHP application can connect to the database server.
4. Use database-specific debugging techniques:
Database systems often provide specific debugging techniques that can be helpful in pinpointing issues. For example, MySQL has the EXPLAIN statement that can assist in analyzing and optimizing query execution plans. PostgreSQL has the EXPLAIN ANALYZE command that provides detailed information about query plans and performance. Familiarize yourself with these database-specific tools to aid in debugging.
5. Log and analyze queries and results:
Logging and analyzing executed queries and their results can be an effective way to identify issues. You can log queries using logging frameworks or custom logging mechanisms. This allows you to review the executed SQL statements, check for errors, and examine the returned data. You can also log the execution time of queries to identify performance bottlenecks.
6. Sanitize and validate input:
Improperly sanitized or validated user input can lead to SQL injection vulnerabilities or errors in database queries. Always sanitize and validate user input before using it in database queries to prevent potential issues. Use prepared statements or parameterized queries to protect against SQL injection attacks.
Debugging database queries and connections is essential for maintaining the integrity and performance of your PHP applications. By using proper error reporting, verifying connection details, utilizing database-specific debugging techniques, logging queries and results, and ensuring proper input sanitization, you can effectively troubleshoot and resolve issues related to database interactions.
Troubleshooting common PHP errors
As a PHP developer, it’s common to encounter errors during the development and deployment of your applications. These errors can occur due to various reasons, such as syntax mistakes, incorrect configuration, or issues with dependencies. Troubleshooting and resolving these errors is an integral part of the development process. In this section, we will explore some common PHP errors and provide tips for troubleshooting them:
1. Parse errors:
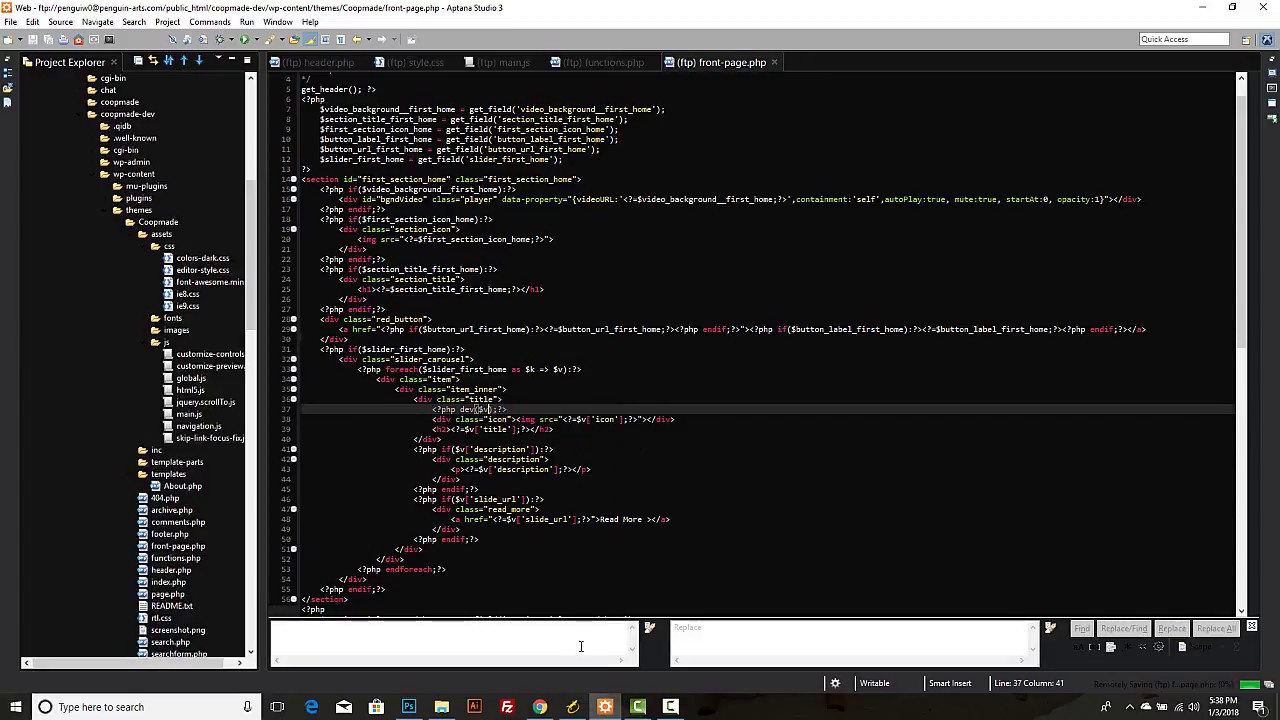
Parse errors occur when PHP encounters syntax mistakes in your code. These errors prevent the script from being executed. To troubleshoot parse errors, carefully examine the line mentioned in the error message and check for any missing or misplaced symbols, brackets, or semicolons. Ensure that all opening brackets are properly closed, and quotes are correctly paired.
2. Undefined variable or function:
When you see an “undefined variable” or “undefined function” error, it indicates that a variable or function is being referenced before it has been declared or assigned a value. To troubleshoot this error, double-check your code for spelling errors or typos in the variable or function names. Ensure that variables are properly initialized and functions are defined before they are called.
3. Call to undefined method or class:
This error occurs when you’re attempting to call a method or access a property of an object that doesn’t exist. Troubleshoot this error by verifying that the class and method exist, and ensure that you’re creating an instance of the correct class before calling its methods.
4. Incorrect database credentials:
When working with databases, connection-related errors may occur if the database credentials are incorrect or don’t match the configuration. Double-check the credentials for accuracy, including the hostname, username, password, and database name. Ensure that the database server is running and accessible.
5. Out of memory:
If you encounter an “Out of memory” error, it means that your PHP script has exhausted the allocated memory limit. To troubleshoot this error, increase the memory limit in the PHP configuration (php.ini) file using the `memory_limit` directive. Alternatively, optimize your code by freeing up memory that is no longer required, such as by unsetting variables or releasing resources.
6. File or directory permission issues:
Permission-related errors occur when PHP doesn’t have sufficient permissions to access or modify files or directories. Troubleshoot these errors by checking the file and directory permissions. Ensure that the appropriate read, write, and execute permissions are set for the files and directories that PHP needs to access.
Troubleshooting PHP errors requires a systematic approach of analyzing error messages, reviewing code, and verifying configurations. In addition to the tips mentioned above, referring to PHP documentation, online forums, and error logs can provide further insights and solutions to common PHP errors. By mastering the art of troubleshooting, you can effectively identify and resolve errors, ensuring the smooth operation of your PHP applications.
Conclusion
Debugging is an essential skill for PHP developers, as it allows the identification and resolution of coding errors and bugs, ensuring the smooth operation of PHP applications. Throughout this guide, we have explored various techniques and tools for effective PHP debugging.
We began by setting up a debugging environment, covering the installation of local development servers, configuring PHP error reporting, and enabling logging for comprehensive debugging. We then delved into the different debugging techniques, including using echo statements, utilizing var_dump() and print_r() for variable inspection, and analyzing stack traces to trace the execution flow.
We also explored more advanced debugging approaches, such as using Xdebug for stepping through code, setting breakpoints, and inspecting variables. Additionally, we discussed how IDEs like PhpStorm, NetBeans, and Eclipse provide powerful debugging features that enhance the debugging experience.
Furthermore, we highlighted the importance of using logging frameworks to capture and log debug information, and we covered the process of analyzing stack traces to pinpoint the root causes of errors and exceptions. We also discussed techniques for troubleshooting common PHP errors that developers frequently encounter during the development process.
By mastering these debugging techniques, PHP developers can efficiently identify and resolve issues in their code, leading to more robust and reliable applications. The ability to debug effectively helps reduce development time, improve code quality, and deliver better user experiences.
Remember, debugging is an iterative process and requires a systematic approach. Be patient, stay curious, and utilize the various resources available, such as documentation, online forums, and debugging tools. Continuously expanding your debugging skills will enable you to tackle complex coding challenges, enhancing your overall proficiency as a PHP developer.