Introduction
Debugging PHP code is an essential skill for developers seeking to identify and resolve issues within their applications. While there are various tools and methods available for debugging, using Chrome as a debugging platform offers a seamless and efficient approach. By leveraging the power of Chrome's developer tools and integrating Xdebug, developers can streamline the debugging process and gain valuable insights into their PHP code.
In this article, we will explore the step-by-step process of setting up Xdebug, configuring PHP, and integrating Chrome for debugging PHP code. Whether you are a seasoned developer or just starting your journey in PHP development, mastering the art of debugging in Chrome can significantly enhance your productivity and proficiency in troubleshooting code issues.
By the end of this guide, you will have a comprehensive understanding of how to harness the capabilities of Chrome to effectively debug PHP code, empowering you to tackle complex challenges with confidence and precision. Let's embark on this enlightening journey to unlock the full potential of Chrome as a robust platform for debugging PHP code.
Setting Up Xdebug
Setting up Xdebug is a crucial initial step in preparing Chrome for debugging PHP code. Xdebug is a powerful and versatile debugging tool that provides a wide range of features to streamline the debugging process. To begin the setup, developers need to ensure that Xdebug is installed and configured correctly within their PHP environment.
Installing Xdebug
The first step in setting up Xdebug involves installing the Xdebug extension for PHP. Developers can download the appropriate Xdebug version from the official Xdebug website or utilize package managers such as PECL for a seamless installation process. Once the Xdebug extension is downloaded, it can be integrated into the PHP environment by following the installation instructions provided by the Xdebug documentation.
Configuring PHP for Xdebug
After installing the Xdebug extension, developers need to configure their PHP settings to enable Xdebug and define its behavior. This involves adding specific directives to the php.ini configuration file to activate Xdebug and specify its functionalities. Key directives include enabling Xdebug, setting the remote debugging mode, defining the remote host and port for debugging connections, and configuring additional features such as profiling and code coverage.
Verifying Xdebug Installation
Once the Xdebug extension is installed and the PHP configuration is updated, developers can verify the successful installation of Xdebug by checking the PHP information page or using the phpinfo() function. This step ensures that Xdebug is properly integrated into the PHP environment and ready to be utilized for debugging purposes.
Testing Xdebug Functionality
To validate the functionality of Xdebug, developers can create a simple PHP script containing debugging triggers such as breakpoints or var_dump statements. By executing the script and observing the debugging output, developers can confirm that Xdebug is actively intercepting the code execution and providing debugging information. This testing phase allows developers to ensure that Xdebug is functioning as expected before proceeding to integrate it with Chrome for debugging PHP code.
Setting up Xdebug lays the foundation for leveraging Chrome as a robust platform for debugging PHP code. With Xdebug seamlessly integrated into the PHP environment and configured to meet specific debugging requirements, developers are well-equipped to harness the full potential of Chrome's developer tools for efficient and insightful PHP debugging experiences.
Configuring PHP for Xdebug
Configuring PHP for Xdebug is a pivotal step in preparing the PHP environment to seamlessly integrate with Xdebug, enabling efficient debugging capabilities. This process involves modifying the PHP configuration to activate Xdebug and define its behavior, ensuring that developers can leverage its powerful features to effectively debug PHP code.
Activating Xdebug
The first essential configuration step is to activate Xdebug within the PHP environment. This is achieved by adding the directive zend_extension=xdebug.so to the php.ini configuration file. By enabling the Xdebug extension, developers signal the PHP interpreter to load and utilize Xdebug's functionalities during code execution, laying the groundwork for comprehensive debugging support.
Setting Remote Debugging Mode
Configuring Xdebug to operate in remote debugging mode is crucial for establishing communication between the PHP environment and the debugging client, such as Chrome. Developers can set the xdebug.remote_enable directive to 1 in the php.ini file, enabling remote debugging functionality. Additionally, specifying the remote host and port for debugging connections using directives such as xdebug.remote_host and xdebug.remote_port facilitates seamless interaction between Xdebug and the debugging client.
Configuring Additional Features
Xdebug offers a range of additional features that can be tailored to meet specific debugging requirements. Developers can customize the behavior of Xdebug by configuring directives such as xdebug.remote_log for logging debugging interactions, xdebug.remote_autostart to automatically initiate debugging sessions, and xdebug.idekey to specify the IDE key for debugging sessions. Furthermore, enabling features such as profiling and code coverage allows developers to gain deeper insights into the performance and execution of their PHP code.
Fine-Tuning Xdebug Settings
In addition to the fundamental configuration directives, developers can fine-tune Xdebug settings to optimize the debugging experience. Parameters such as xdebug.max_nesting_level and xdebug.max_children can be adjusted to accommodate complex code structures and recursive functions, ensuring that Xdebug effectively captures and presents debugging information without limitations.
By meticulously configuring PHP for Xdebug, developers establish a robust foundation for leveraging Chrome as a powerful platform for debugging PHP code. The seamless integration of Xdebug with the PHP environment, coupled with tailored configuration settings, empowers developers to delve into their code with precision and efficiency, unraveling intricate issues and enhancing the overall quality of PHP applications.
Configuring Chrome for Xdebug
Configuring Chrome to effectively integrate with Xdebug is a pivotal step in establishing a seamless debugging workflow for PHP code. By leveraging the capabilities of Chrome's developer tools and integrating Xdebug, developers can harness a comprehensive debugging environment that offers real-time insights and precise control over code execution. The process of configuring Chrome for Xdebug involves setting up the Xdebug Helper extension, defining debugging settings, and establishing a streamlined connection between Chrome and the PHP environment.
Installing Xdebug Helper Extension
The first step in configuring Chrome for Xdebug is to install the Xdebug Helper extension from the Chrome Web Store. This extension serves as a bridge between Chrome and Xdebug, facilitating the initiation and management of debugging sessions directly from the browser. Once installed, developers can access the Xdebug Helper icon in the Chrome toolbar, providing quick access to essential debugging functionalities.
Configuring Xdebug Helper Settings
After installing the Xdebug Helper extension, developers can configure its settings to align with the Xdebug configuration in the PHP environment. This involves specifying the IDE key, which acts as a unique identifier for debugging sessions, and defining the debugging mode to ensure seamless communication between Chrome and Xdebug. By synchronizing the Xdebug Helper settings with the configured parameters in PHP, developers establish a cohesive debugging environment that facilitates uninterrupted debugging interactions.
Initiating Debugging Sessions
With the Xdebug Helper extension configured, developers can initiate debugging sessions directly from Chrome. By clicking on the Xdebug Helper icon and selecting the desired debugging mode, such as "Debug" or "Profile," developers trigger the initiation of debugging sessions, allowing Xdebug to intercept PHP code execution and communicate debugging information to Chrome's developer tools. This streamlined process empowers developers to seamlessly transition between code inspection and debugging actions within the familiar Chrome interface.
Leveraging Chrome Developer Tools
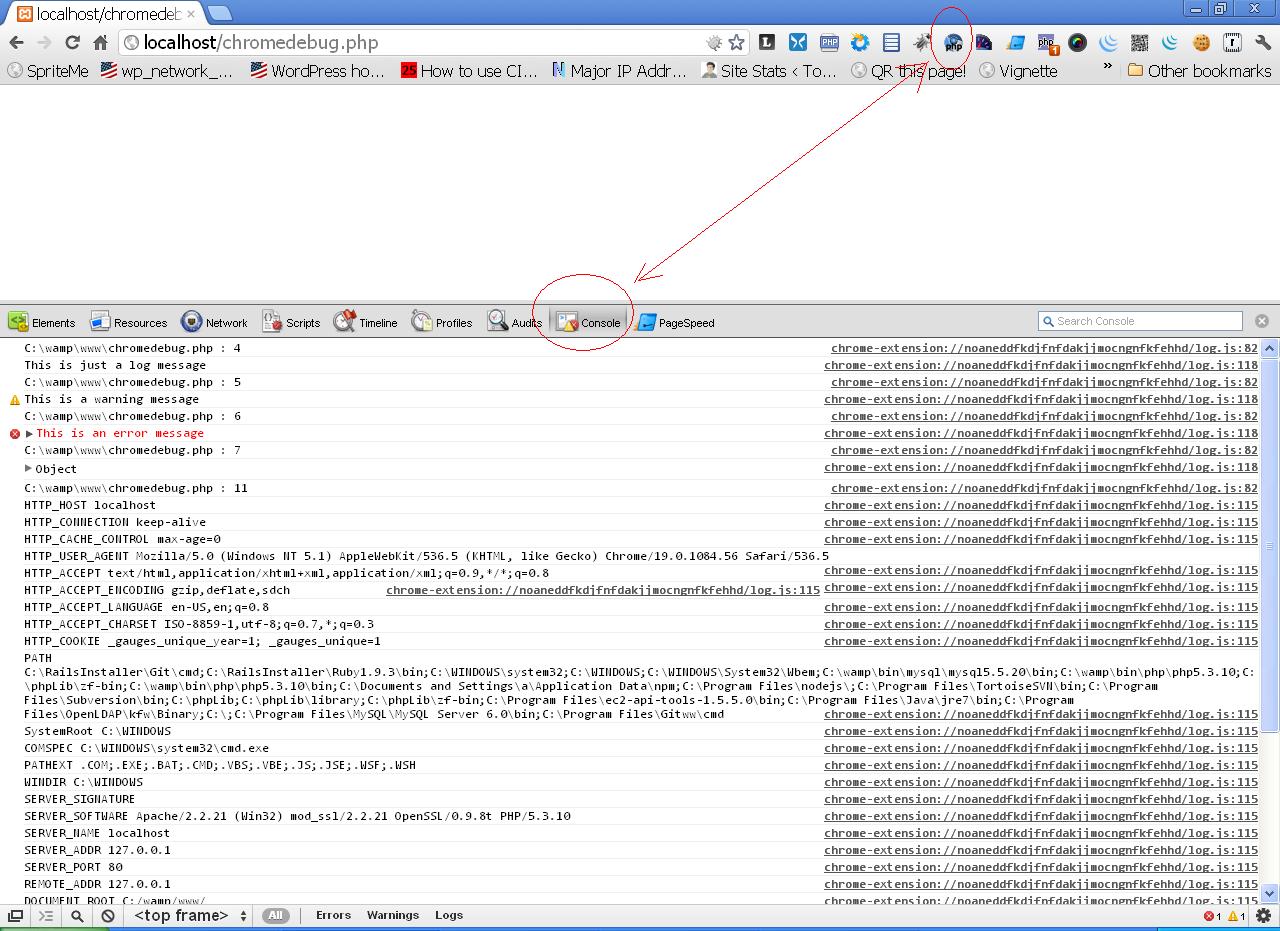
Once the debugging session is initiated, developers can leverage Chrome's developer tools to explore and analyze the debugging information provided by Xdebug. The "Sources" panel enables developers to set breakpoints, inspect variable values, and step through code execution, offering a comprehensive view of the PHP code's behavior during debugging sessions. Additionally, the "Network" panel provides insights into debugging interactions, allowing developers to monitor debugging requests and responses between Chrome and the PHP environment.
Seamless Integration and Enhanced Productivity
By configuring Chrome for Xdebug, developers unlock a powerful and intuitive platform for debugging PHP code. The seamless integration of Xdebug with Chrome's developer tools streamlines the debugging workflow, empowering developers to identify and resolve code issues with precision and efficiency. With real-time insights and interactive debugging capabilities at their fingertips, developers can elevate their debugging proficiency and enhance the overall quality of PHP applications.
In summary, configuring Chrome for Xdebug establishes a cohesive and efficient debugging environment, enabling developers to harness the full potential of Chrome as a robust platform for debugging PHP code. By seamlessly integrating Xdebug with Chrome's developer tools and leveraging the Xdebug Helper extension, developers gain unparalleled control and visibility into their PHP code, fostering a proactive approach to debugging and code optimization.
Debugging PHP Code in Chrome
Debugging PHP code in Chrome offers a seamless and efficient approach to identifying and resolving issues within PHP applications. By leveraging the powerful capabilities of Chrome's developer tools and integrating Xdebug, developers can streamline the debugging process and gain valuable insights into their PHP code.
Initiating a Debugging Session
To commence the debugging process, developers can trigger a debugging session directly from Chrome using the Xdebug Helper extension. By selecting the "Debug" mode within the Xdebug Helper icon, developers initiate the debugging session, allowing Xdebug to intercept PHP code execution and communicate debugging information to Chrome's developer tools.
Exploring Code Behavior
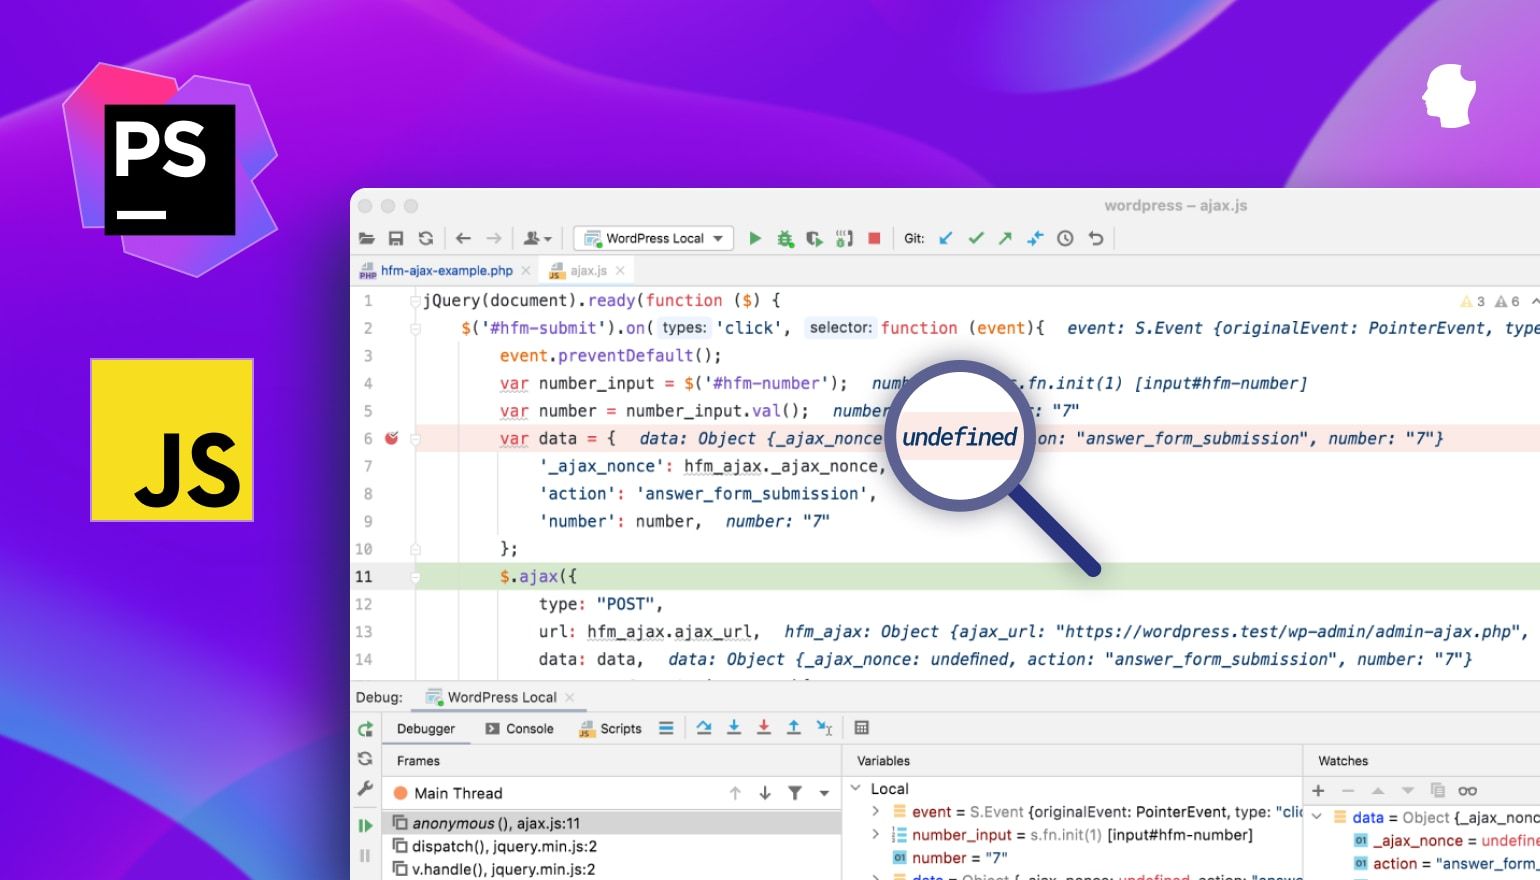
Once the debugging session is active, developers can delve into the behavior of their PHP code using Chrome's developer tools. The "Sources" panel enables developers to set breakpoints, inspect variable values, and step through code execution, providing a comprehensive view of the code's behavior during debugging sessions. This real-time interaction with the code empowers developers to pinpoint issues and understand the flow of their PHP applications.
Analyzing Debugging Information
Chrome's developer tools offer a range of functionalities to analyze the debugging information provided by Xdebug. Developers can inspect variable values, evaluate expressions, and navigate through the call stack, gaining valuable insights into the state of the PHP code during debugging sessions. Additionally, the "Network" panel allows developers to monitor debugging interactions, providing visibility into the communication between Chrome and the PHP environment.
Leveraging Breakpoints and Watches
By strategically placing breakpoints within the PHP code, developers can pause code execution at specific points and inspect the program's state, facilitating in-depth analysis and issue identification. Furthermore, the ability to set watches on variables enables developers to track and monitor specific data elements, empowering them to gain a deeper understanding of the code's behavior and identify potential issues.
Real-Time Collaboration and Precision
The seamless integration of Xdebug with Chrome's developer tools fosters real-time collaboration between developers and their PHP code. With precise control over code execution and comprehensive insights into the code's behavior, developers can efficiently identify and resolve issues, leading to enhanced code quality and optimized PHP applications.
In summary, debugging PHP code in Chrome provides developers with a robust and intuitive platform to unravel code issues and optimize PHP applications. By seamlessly integrating Xdebug with Chrome's developer tools, developers gain unparalleled visibility and control over their PHP code, empowering them to elevate their debugging proficiency and enhance the overall quality of their applications.