Introduction
Having a healthy and well-functioning GPU (Graphics Processing Unit) is crucial for the smooth operation of your computer, especially if you are a gamer, graphic designer, or use GPU-intensive applications. The GPU is responsible for rendering images, videos, and graphics on your screen, making it an essential component for a seamless visual experience.
But how can you determine if your GPU is in good health? Are there any signs or metrics that you can use to assess its performance and identify any potential issues? In this article, we will explore various methods of checking your GPU’s health and monitoring its key aspects.
By keeping an eye on your GPU’s health, you can proactively identify any abnormalities or performance issues before they cause more serious problems. Whether you’re an avid gamer who wants to ensure optimal gaming performance or a professional who relies on GPU-intensive software, understanding how to check your GPU’s health is crucial.
Throughout this article, we will cover various aspects of GPU health, including temperature, usage, VRAM (Video Random Access Memory) usage, fan speed, power usage, clock speed, and performance. We will also explore how to check for GPU driver issues, as outdated or faulty drivers can impact your GPU’s performance significantly.
So, if you’re ready to dive into the world of GPU health monitoring and learn how to keep your graphics card running smoothly, let’s get started with the signs of a healthy GPU.
Signs of a Healthy GPU
When it comes to assessing the health of your GPU, there are several key indicators you can look out for. By keeping an eye on these signs, you can ensure that your graphics card is functioning optimally and avoid potential performance issues. Here are some signs of a healthy GPU:
- Smooth and Stable Performance: A healthy GPU should deliver smooth and stable performance across various applications and games. You should not experience sudden frame rate drops, stuttering, or lag during gameplay or graphic-intensive tasks.
- No Artifacts or Distortions: Artifacts, which are visual glitches such as flickering, pixelated images, or screen tearing, can be indicators of a faulty GPU. If you don’t notice any unusual visual anomalies, it is a good indication that your GPU is in good health.
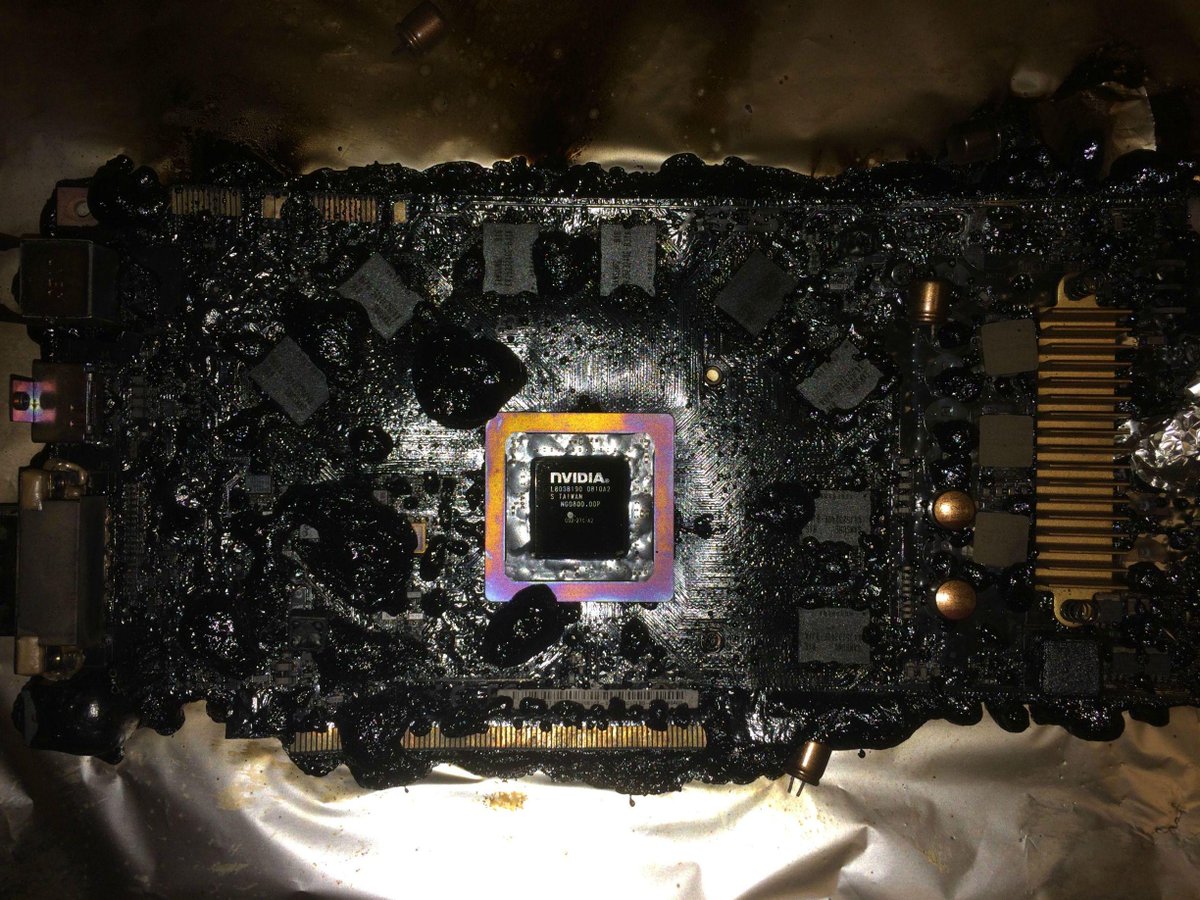
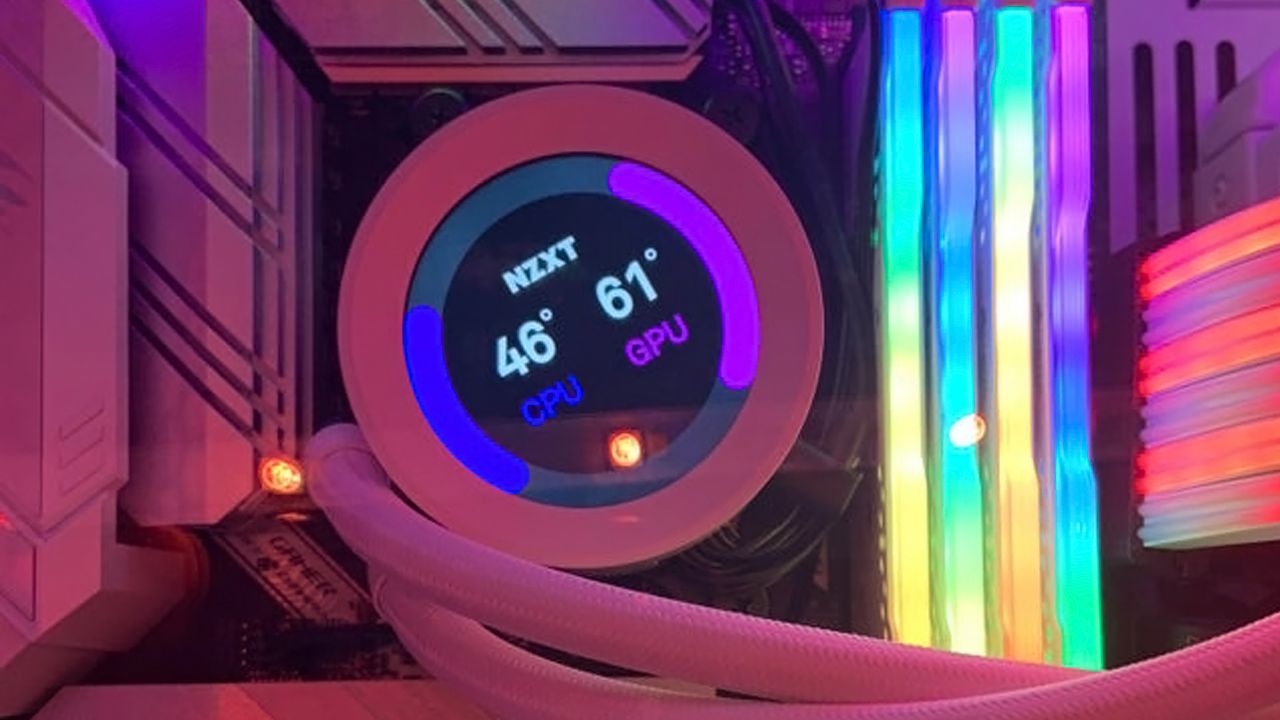
- No Overheating Issues: GPUs generate heat during operation, but a healthy GPU should not overheat excessively. If your GPU runs at reasonable temperatures under load (typically below 90 degrees Celsius), it suggests proper cooling and thermal management.
- Steady Fan Speed: The fan on your GPU helps dissipate heat and keep the temperature within the acceptable range. A healthy GPU should maintain a consistent fan speed, adjusting according to the load and temperature, without any sudden changes in speed or unusual noises.
- Efficient Power Consumption: A well-functioning GPU should consume power efficiently, delivering performance while keeping power usage within reasonable limits. This means that your GPU is not overtaxing your power supply or causing power-related issues.
By regularly monitoring these signs, you can quickly identify if there are any potential issues with your GPU. However, keep in mind that occasional minor fluctuations in performance or temperature are normal and may be influenced by factors such as load intensity or ambient temperature.
Now that you know what to look for in a healthy GPU, it’s time to dive deeper into the various methods of checking specific aspects of your GPU’s health. In the following sections, we will explore how to check GPU temperature, usage, VRAM usage, fan speed, power usage, clock speed, performance, and how to identify GPU driver issues.
How to Check GPU Temperature
Monitoring your GPU temperature is essential to ensure it is operating within safe limits. Excessive heat can lead to performance issues, crashes, or even hardware damage. Luckily, there are various tools you can use to check your GPU temperature.
One of the most popular tools for temperature monitoring is GPU-Z. It provides detailed information about your GPU, including temperature readings. After downloading and installing GPU-Z, open the program and look for the “Temperature” section. Here, you will find the current temperature of your GPU in real-time.
Another option is to use third-party software such as MSI Afterburner or EVGA Precision X1. These tools not only allow you to monitor GPU temperature but also provide additional customization options for overclocking and fan control.
If you prefer a more integrated solution, some graphics card manufacturers offer their own software for temperature monitoring. For example, NVIDIA provides the NVIDIA Control Panel, which allows you to monitor GPU temperature and adjust various settings specific to NVIDIA GPUs.
In addition to software-based monitoring, many modern motherboards come with temperature sensors that can provide GPU temperature readings. Check your motherboard’s documentation or BIOS settings to see if it supports this feature.
Lastly, some GPU manufacturers provide companion applications for their graphics cards. These applications, like AMD Radeon Software or NVIDIA GeForce Experience, often include temperature monitoring functionality alongside other features such as driver updates and game optimization.
When monitoring GPU temperature, it’s important to keep in mind what is considered an acceptable range. Although the specific temperature threshold may vary depending on the GPU model, a general guideline is to keep the GPU temperature below 85-90 degrees Celsius under load. Any temperatures beyond this range may indicate poor cooling or a need for cleaning.
By regularly checking your GPU temperature and ensuring it stays within safe limits, you can prevent overheating-related issues and maintain optimal performance.
How to Check GPU Usage
Monitoring GPU usage allows you to gauge how intensively your graphics card is being utilized. This can be helpful in diagnosing performance issues, optimizing system resources, and identifying whether your GPU is being fully utilized. Here are some methods to check GPU usage:
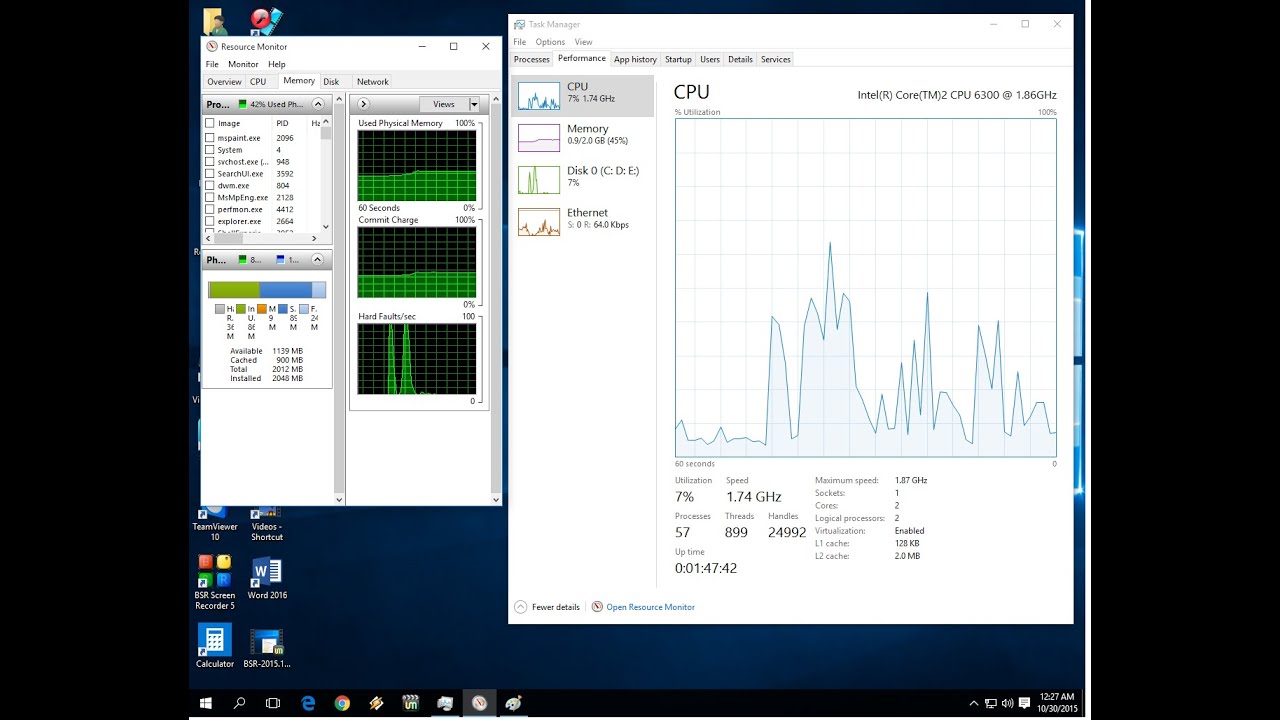
Task Manager is a built-in utility in Windows that provides a basic overview of GPU usage. To access it, right-click the taskbar, select “Task Manager,” and navigate to the “Performance” tab. Under the “GPU” section, you can find the GPU utilization graph and percentage, showcasing the current GPU usage.
Third-party GPU monitoring software, like MSI Afterburner or HWiNFO, offer more comprehensive and detailed information about GPU usage. These tools can display real-time GPU utilization, allowing you to monitor usage fluctuations during specific tasks or gaming sessions.
Some graphics card manufacturers also provide their own software with GPU monitoring capabilities. For example, AMD Radeon Software and NVIDIA GeForce Experience offer detailed GPU usage statistics, including utilization percentages for graphics-intensive applications and games.
If you prefer command-line tools, the Windows Performance Monitor allows you to monitor GPU usage as well. You can launch it by typing “perfmon” in the Windows search bar, selecting “Performance Monitor,” and adding the “GPU Utilization” counter to the monitoring list.
GPU-Z, the same software mentioned in the previous section for temperature monitoring, also provides GPU usage information. Within the application, you can find a graph showcasing GPU usage over time.
It’s important to note that GPU usage will vary depending on the applications or tasks running on your computer. Higher GPU usage indicates that your graphics card is being heavily utilized, which is advantageous in scenarios like gaming or GPU-intensive tasks. However, if you notice unusually high GPU usage when your computer is idle or during low-demand activities, it could indicate a background application or process causing an excessive load on the GPU.
By monitoring GPU usage, you can gain insights into how effectively your graphics card is being utilized and identify any potential performance bottlenecks.
How to Check VRAM Usage
Checking VRAM (Video Random Access Memory) usage is crucial for understanding how much dedicated memory your graphics card is utilizing. Monitoring VRAM usage can help you determine if your GPU has enough memory to handle the demands of your applications or games. Here are some methods to check VRAM usage:
Task Manager is a useful tool for getting a basic overview of VRAM usage. To access it, right-click the taskbar, select “Task Manager,” and go to the “Performance” tab. Under the “GPU” section, you will find the VRAM usage graph and the total memory allocated to your GPU.
GPU-Z, a popular GPU monitoring tool mentioned earlier, provides detailed information about VRAM usage. Launch GPU-Z and navigate to the “Graphics Card” tab. Here, you can find the “Memory Used” field, which shows the current VRAM usage.
Some graphics card manufacturer software, such as AMD Radeon Software and NVIDIA GeForce Experience, also offer VRAM monitoring. These applications provide a comprehensive overview of GPU performance and allow you to track VRAM usage in real-time.
If you are a gamer, many in-game overlays and monitoring tools offer VRAM usage information. Graphics settings optimization software, like NVIDIA GeForce Experience or AMD Radeon Software, often display VRAM usage alongside other performance metrics while gaming.
Another method to check VRAM usage is through third-party monitoring software like MSI Afterburner or HWiNFO. These tools provide detailed VRAM usage statistics, allowing you to monitor memory allocation during different tasks and applications.
Understanding your GPU’s VRAM usage is crucial for optimizing graphical settings in games or selecting the appropriate resolution for your particular workload. If you notice consistently high VRAM usage close to the total available capacity, it may indicate a need for a GPU upgrade with more VRAM or adjusting graphical settings to lower demand.
By regularly monitoring VRAM usage, you can ensure that your graphics card is adequately equipped to handle the demands of your applications and games, leading to smoother performance and enhanced visual quality.
How to Check GPU Fan Speed
Monitoring your GPU fan speed is essential for ensuring proper cooling and preventing your graphics card from overheating. By checking the fan speed, you can confirm if the GPU’s cooling system is functioning as intended. Here are some methods to check GPU fan speed:
Some graphics card manufacturer software, such as MSI Afterburner or EVGA Precision X1, allows you to monitor and adjust your GPU’s fan speed. These applications provide a graphical user interface that displays real-time fan speed, temperature, and other GPU-related information.
If you prefer a more integrated solution, some motherboard manufacturer software might include fan speed monitoring capabilities. Check your motherboard’s documentation or manufacturer’s website to see if they provide a software utility that can display GPU fan speed.
GPU-Z, the same tool mentioned earlier for GPU temperature monitoring, also provides fan speed information. Open GPU-Z and navigate to the “Sensors” tab. Here, you can find the current fan speed in RPM (Revolutions Per Minute).
In addition to software-based solutions, many modern graphics cards have physical fan LEDs that indicate the fan speed visually. These LEDs change color or brightness based on the fan speed, allowing you to quickly assess if the GPU’s cooling system is operating correctly.
In some cases, your GPU’s fan speed may already be controlled by the graphics card firmware or driver, ensuring optimal cooling without the need for manual adjustments. However, monitoring the fan speed can still help identify any potential issues, such as a fan failure or irregular fan behavior.
When monitoring GPU fan speed, it’s important to understand what range is considered normal for your specific graphics card. Fan speed can vary depending on factors like GPU temperature and load. If you notice sudden changes in fan speed or if the fan is consistently running at high speeds even when the GPU is idle, it may indicate an underlying problem that requires further investigation.
By regularly checking your GPU’s fan speed, you can ensure that its cooling system is operating optimally, contributing to better overall GPU performance and longevity.
How to Check GPU Power Usage
Monitoring GPU power usage is important for understanding the power demands of your graphics card during different tasks. By checking the power usage, you can assess the efficiency of your GPU and ensure it is not overloading your power supply. Here are some methods to check GPU power usage:
Some graphics card manufacturer software, such as MSI Afterburner or EVGA Precision X1, provides power usage monitoring features. These applications display the real-time power consumption of your GPU, allowing you to track power fluctuations during different tasks or gaming sessions.
If you prefer a more integrated solution, some motherboard manufacturer software might have power usage monitoring capabilities. Check your motherboard’s documentation or the manufacturer’s website to see if they provide a software utility that can display GPU power usage.
GPU-Z, the same tool mentioned earlier for GPU temperature and fan speed monitoring, also provides power usage information. Open GPU-Z and navigate to the “Sensors” tab. Here, you can find the power consumption of your GPU in Watts.
In addition to software-based monitoring, some high-end power supply units (PSUs) come with monitoring or reporting capabilities. These PSUs allow you to monitor the power draw of your GPU and other components directly from the PSU itself or through software provided by the PSU manufacturer.
It’s important to keep in mind that GPU power usage can vary based on factors like GPU workload, clock speed, and voltage settings. Higher power usage is expected during intensive tasks like gaming or GPU rendering. However, if you notice excessively high power usage in idle or low-demand situations, it could indicate an issue with power management settings or a power-hungry background process.
Monitoring GPU power usage can help you identify any power-related issues and ensure that your power supply is sufficient for your graphics card. It can also be useful when adjusting overclocking or undervolting settings to optimize performance and power efficiency.
By regularly checking your GPU power usage, you can ensure that your graphics card is operating within the expected power consumption range and maintain a stable and efficient power delivery system for your computer.
How to Check GPU Clock Speed
Monitoring GPU clock speed is important for understanding how fast your graphics card is running and to ensure it is reaching its optimal performance levels. GPU clock speed determines the speed at which the GPU processes information, including rendering frames and executing calculations. Here are some methods to check GPU clock speed:
Third-party monitoring software, like MSI Afterburner or HWiNFO, provides detailed information about GPU clock speed. These tools display real-time clock speeds, allowing you to monitor fluctuations during different tasks or gaming sessions. Additionally, they often offer customization options for overclocking or underclocking your graphics card.
GPU-Z, the mentioned tool for GPU temperature and fan speed monitoring, also provides GPU clock speed information. Open GPU-Z and navigate to the “Sensors” tab. Here, you can find the GPU core clock speed and memory clock speed.
Graphics card manufacturer software, such as AMD Radeon Software or NVIDIA Control Panel, allows you to check GPU clock speed and adjust various settings specific to your graphics card. These applications provide an intuitive interface for monitoring clock speeds and managing performance profiles.
In some cases, your graphics card might have physical indicators that display the current clock speed. These indicators can be found on high-end graphics cards and usually consist of LEDs that change color or brightness based on the clock speed level.
It’s worth noting that GPUs are designed to dynamically adjust their clock speeds based on workload and power management settings. This feature, known as GPU Boost (for NVIDIA) or PowerTune (for AMD), allows the GPU to increase clock speeds during demanding tasks and reduce them during idle or less intensive periods.
By monitoring GPU clock speed, you can ensure that your graphics card is operating within the expected clock speed range and identify any abnormalities or performance bottlenecks. It can also be helpful when troubleshooting performance issues or when tuning your GPU for better gaming or rendering performance.
Remember that overclocking your GPU to higher clock speeds can increase performance but may also increase heat generation and require additional cooling. It is advised to follow proper guidelines and precautions when overclocking to avoid any potential damage.
Regularly checking your GPU clock speed enables you to optimize performance and ensure that your graphics card is running at its full potential.
How to Check GPU Memory Clock Speed
Monitoring GPU memory clock speed is key to understanding the speed at which your graphics card’s memory is operating. GPU memory clock speed influences the rate at which data is transferred between the GPU and graphics memory. Checking the memory clock speed can help you assess the memory performance of your GPU and optimize its usage. Here are some methods to check GPU memory clock speed:
Third-party monitoring software, like MSI Afterburner or HWiNFO, provides detailed information about GPU memory clock speed. These tools offer real-time monitoring capabilities, allowing you to keep track of memory clock speed fluctuations during different tasks or gaming sessions.
GPU-Z, a popular GPU monitoring tool mentioned earlier, also provides GPU memory clock speed information. Open GPU-Z and navigate to the “Sensors” tab. Here, you can find the GPU memory clock speed, typically expressed in MHz.
Graphics card manufacturer software, such as AMD Radeon Software or NVIDIA Control Panel, often includes options to check and modify GPU memory clock speed. These applications provide an intuitive interface for managing various performance settings and monitoring memory clock speeds.
If you’re using an AMD GPU, Radeon Wattman is another tool available for monitoring and adjusting GPU memory clock speed. It provides advanced control over GPU settings, including memory clock speed, allowing you to fine-tune your graphics card’s memory performance.
Some graphics cards may have physical indicators, such as LEDs or displays, that show the current GPU memory clock speed. These indicators are typically found on high-end graphics cards and can give you an instant visual confirmation of the memory clock speed level.
Monitoring GPU memory clock speed allows you to assess the memory performance and overall efficiency of your graphics card. Understanding the memory clock speed can be crucial for optimizing performance in tasks that heavily rely on memory bandwidth, such as gaming or GPU-accelerated applications.
It is important to note that like GPU core clock speed, GPU memory clock speed can dynamically adjust based on workload and power management settings. The memory clock speed will increase during demanding tasks and decrease during idle or less intensive periods, maintaining a balance between power consumption and performance.
By regularly checking your GPU memory clock speed, you can ensure that your graphics card is operating within the expected range and optimize memory performance for tasks that require high memory bandwidth.
How to Check GPU Performance
Checking GPU performance is crucial for assessing the overall capabilities and efficiency of your graphics card. Whether you’re a gamer looking to optimize your gaming experience or a professional working with GPU-intensive applications, monitoring GPU performance can help you identify any performance bottlenecks or areas for improvement. Here are some methods to check GPU performance:
Benchmarking software is widely used to measure and compare GPU performance across different systems. Popular benchmarking tools like 3DMark or Unigine Heaven/Valley allow you to run a series of tests that stress your GPU and provide detailed performance metrics, including frame rates, scores, and comparisons to other systems.
In-game benchmarking tools are often included within many modern games. These tools run automated tests specifically tailored to the game’s graphics and provide performance metrics, allowing you to assess your GPU’s performance within that specific game.
Third-party monitoring software, like MSI Afterburner, provides real-time monitoring of GPU performance. These tools display key metrics such as GPU usage, temperature, clock speeds, and fan speed while your system is under load. Monitoring software allows you to track and analyze performance fluctuations during various tasks or gaming sessions.
Graphics card manufacturer software, such as AMD Radeon Software or NVIDIA Control Panel, also includes performance monitoring features. These applications provide an interface for checking and optimizing various performance settings specific to your graphics card.
Online databases and forums dedicated to GPU performance, such as userbenchmark.com or tech support communities, can provide a wealth of information regarding typical performance figures and user experiences with specific graphics cards. These resources can help you compare your GPU’s performance to others of the same model or similar configurations.
Regularly monitoring GPU performance enables you to identify potential performance bottlenecks, such as insufficient cooling, outdated drivers, or hardware limitations. By understanding your GPU’s performance capabilities, you can make informed decisions to optimize settings, upgrade components, or troubleshoot any performance-related issues.
It’s important to note that GPU performance can vary based on factors such as GPU load, clock speed, memory, and optimization settings. Additionally, newer graphics drivers or software updates might introduce performance improvements or optimizations for specific applications or games.
By leveraging benchmarking tools, monitoring software, and community resources, you can gain valuable insights into your GPU’s performance and make informed decisions to enhance your overall computing experience.
How to Check for GPU Driver Issues
GPU driver issues can cause a range of problems, including crashes, graphical glitches, and performance issues. Regularly checking for GPU driver issues ensures that your graphics card operates optimally and provides the best possible performance. Here are some methods to check for GPU driver issues:
Graphics card manufacturer software, such as AMD Radeon Software or NVIDIA GeForce Experience, provides a convenient way to check for driver updates. These applications not only allow you to monitor GPU performance but also include features that automatically scan for and install the latest driver updates.
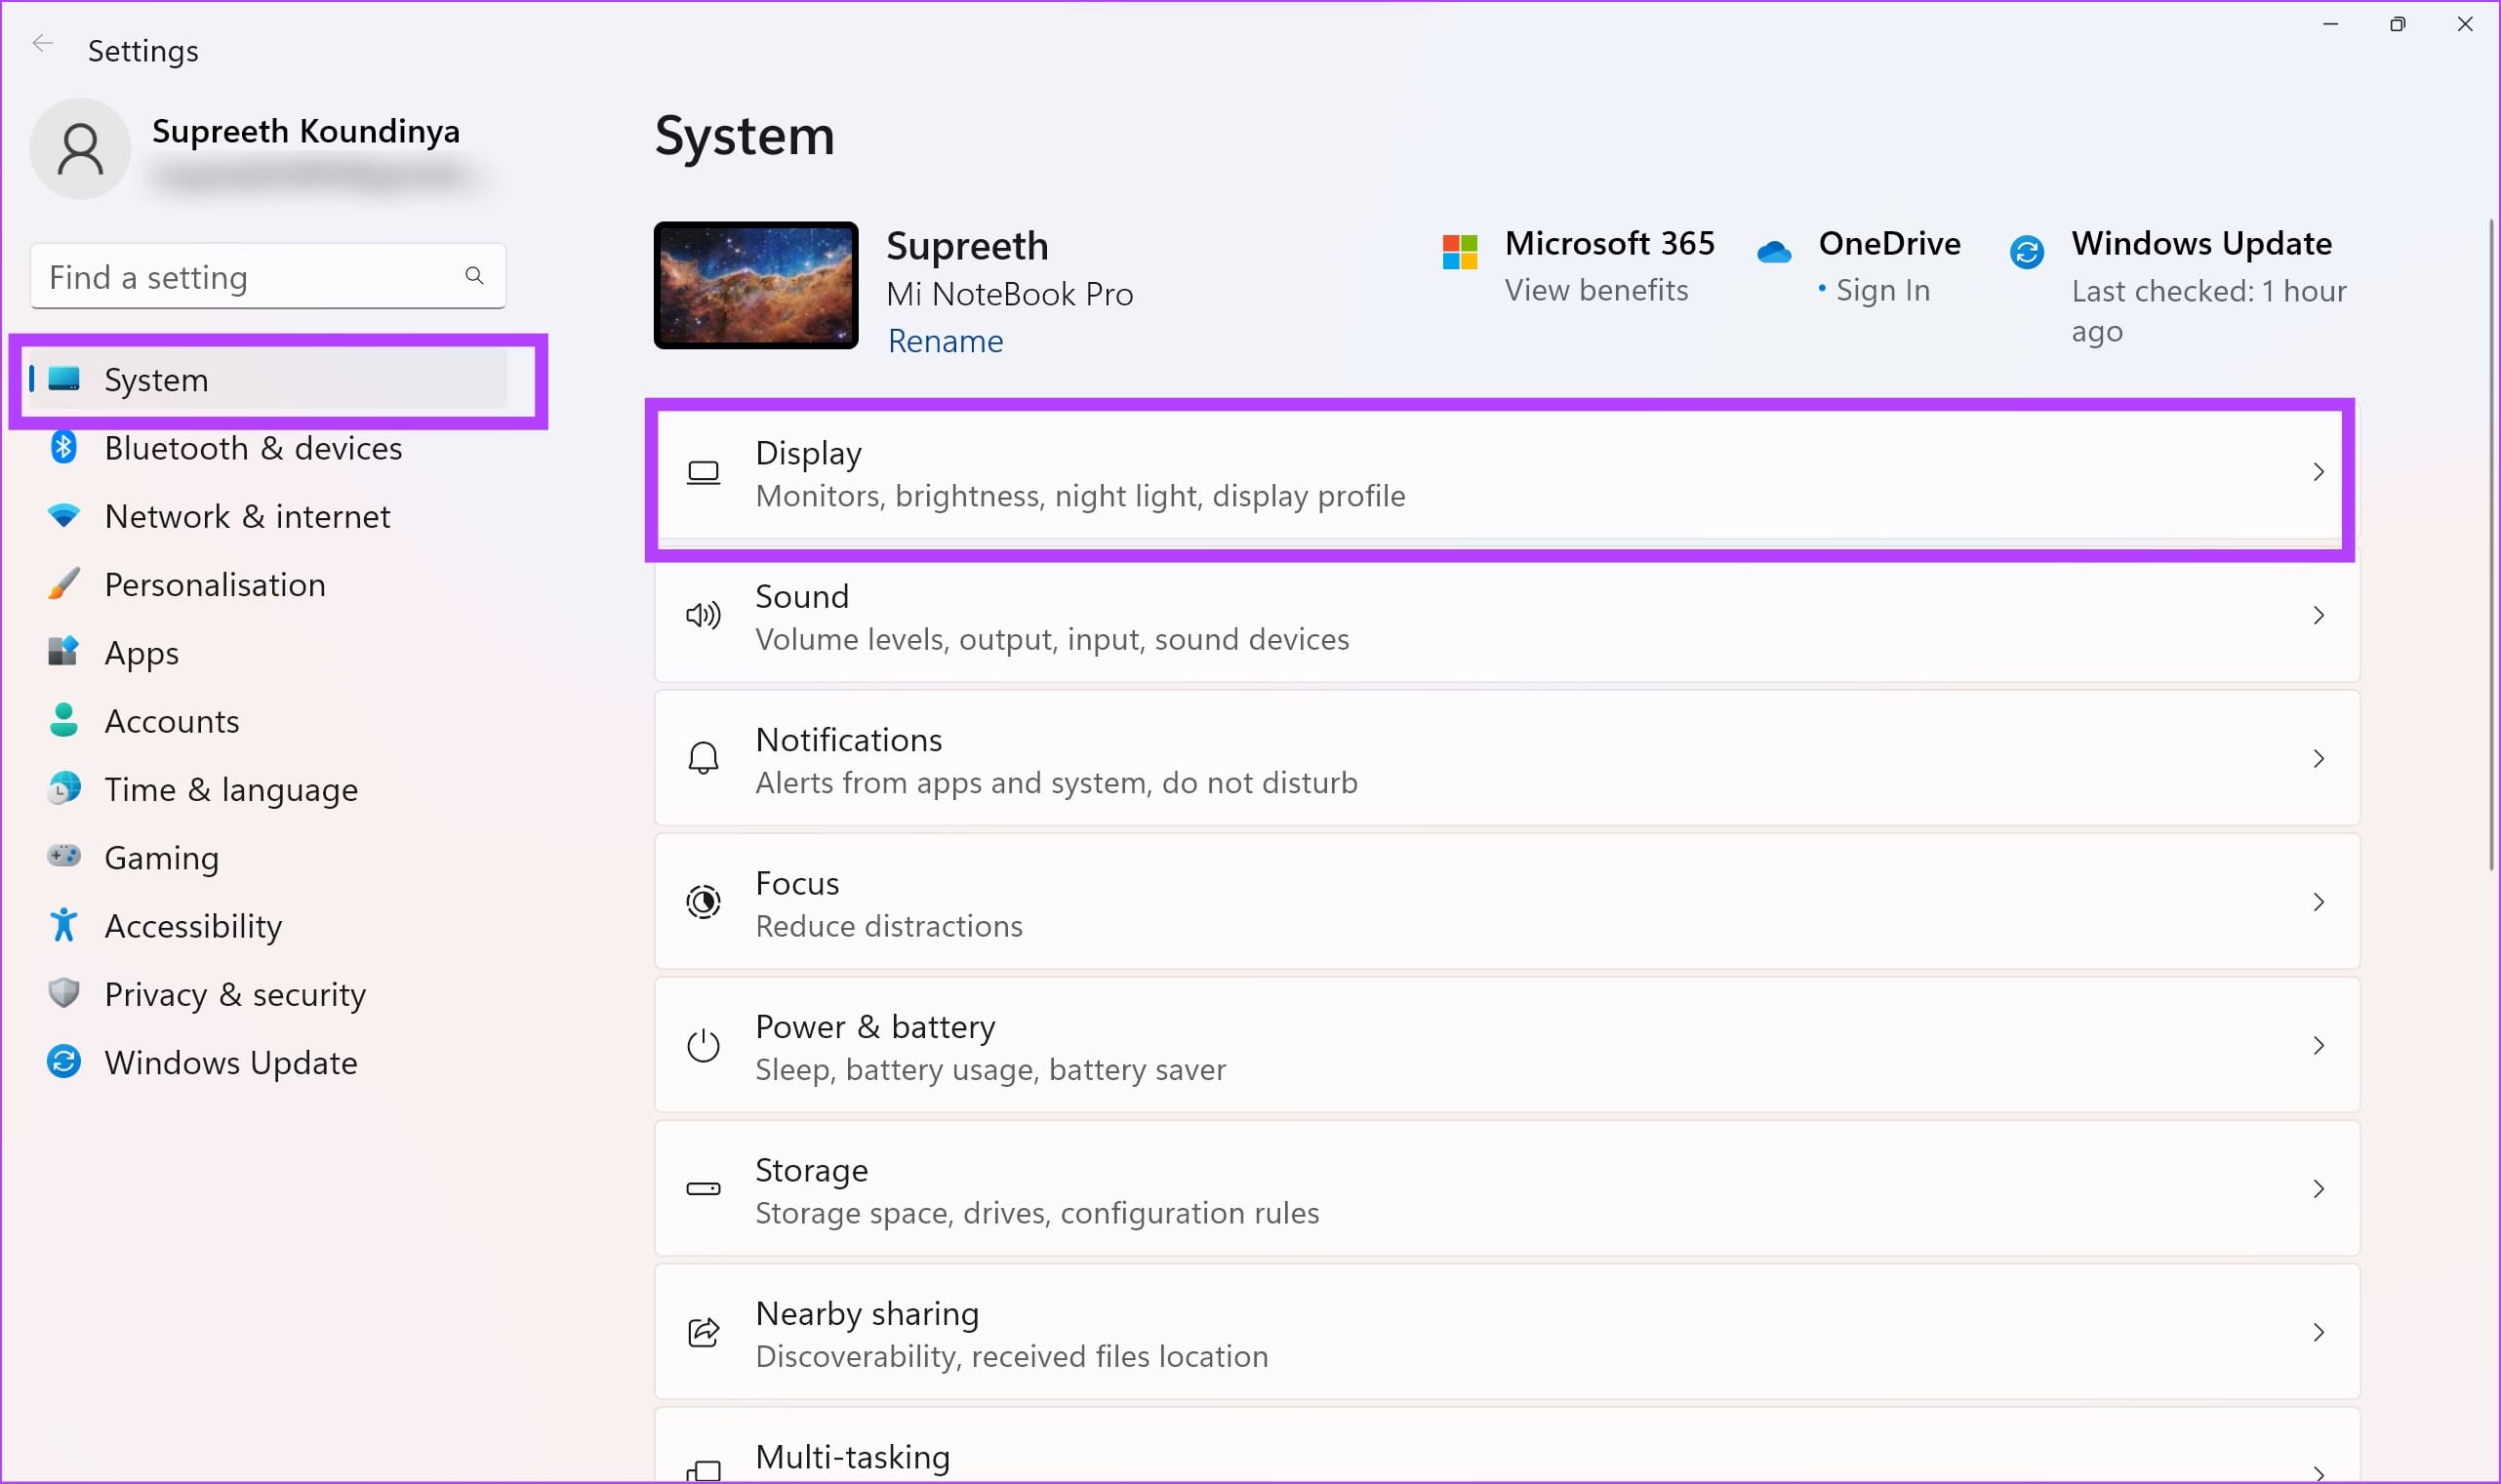
Windows Update also plays a significant role in managing GPU drivers. The Windows Update feature frequently checks for driver updates and provides them through the Windows Update service. To check for driver updates, go to “Settings,” then “Update & Security,” and click on “Check for updates.”
The official websites of GPU manufacturers typically offer driver download sections where you can find the latest drivers for your specific graphics card model. Visit the website of your GPU manufacturer, navigate to the support or drivers section, and follow the prompts to download and install the correct driver.
Third-party software, such as Driver Easy or Driver Booster, can scan your system and check for outdated or missing GPU drivers. These tools simplify the process of driver updates by automatically detecting the drivers that need updating and downloading the latest versions.
Monitoring forums and communities dedicated to GPU and driver discussions can provide valuable insights into common driver issues. Engaging with these communities can help you identify and troubleshoot any driver-related problems you might encounter.
If you experience persistent or recurring issues with your GPU, rolling back the driver to a previous version can be a potential solution. Open Device Manager, locate your graphics card under “Display adapters,” right-click on it, select “Properties,” go to the “Driver” tab, and click on “Roll Back Driver” if available.
Performing a clean reinstall of the GPU driver can also help resolve driver issues. To do this, use a driver uninstaller tool like Display Driver Uninstaller (DDU) to completely remove the existing driver, then download and install the latest driver from the manufacturer’s website.
Regularly checking for GPU driver updates and addressing any driver issues ensures that your graphics card performs optimally and without any compatibility or stability problems. Keeping your drivers up to date allows you to take advantage of bug fixes, performance improvements, and new features introduced by the GPU manufacturer.
It’s worth noting that before updating, rolling back, or reinstalling GPU drivers, it is wise to create a system restore point or backup your data to ensure you can revert back in case any issues arise during the driver update process.
By staying vigilant and proactive in monitoring for GPU driver issues, you can maintain a smooth and stable computing experience while harnessing the full potential of your graphics card.
Conclusion
Monitoring the health and performance of your GPU is essential for ensuring optimal functionality and maximizing the potential of your graphics card. By regularly checking various aspects such as temperature, usage, VRAM, fan speed, power usage, clock speed, and addressing driver issues, you can keep your GPU running smoothly and avoid potential problems.
Signs of a healthy GPU include smooth performance, absence of artifacts, proper cooling, steady fan speed, and efficient power consumption. Checking GPU temperature and fan speed helps to prevent overheating and ensure proper cooling. Monitoring GPU usage and VRAM usage allows you to gauge the workload and memory demands on your graphics card.
Checking GPU power usage and clock speed provides insights into power efficiency and performance levels. Examining GPU memory clock speed helps optimize memory performance, while monitoring GPU performance and troubleshooting for driver issues ensures smooth operation and compatibility with software applications.
Utilizing various tools and software options such as GPU-Z, MSI Afterburner, HWiNFO, and manufacturer-specific software allows for accurate and real-time monitoring of GPU health and performance. In addition, online resources like forums and community discussions provide valuable insights and user experiences.
Remember to exercise caution and follow proper guidelines when overclocking or adjusting settings to prevent damage or instability. Also, keep in mind that occasional fluctuations in temperature, usage, and clock speeds are normal, but consistent abnormalities may require further investigation.
By staying proactive in monitoring your GPU’s health and performance, you can identify and address any potential issues promptly, ensuring a reliable and efficient graphics card that delivers optimal performance for your gaming, design, or GPU-intensive work needs.
With these monitoring techniques and practices, you can confidently harness the full potential of your GPU and enjoy a smooth and immersive visual experience on your computer.