Introduction
As a computer user, it is essential to monitor the temperature of your CPU (Central Processing Unit) and GPU (Graphics Processing Unit). The temperature of these components can significantly impact the performance and lifespan of your computer. Overheating can lead to system crashes, reduced performance, and even permanent damage to the hardware.
Checking the CPU and GPU temperature allows you to ensure that your computer is running within safe operating limits. By monitoring these temperatures, you can take appropriate measures to prevent overheating and optimize the performance of your system.
There are various methods to check the CPU and GPU temperature, ranging from using third-party software to accessing the BIOS/UEFI interface. Each method offers its own advantages and can be tailored to your specific needs. Whether you are a gamer, a content creator, or simply a regular computer user, knowing how to check your CPU and GPU temperature is a valuable skill.
In this article, we will explore different methods to check the CPU and GPU temperature on your computer. We will cover both Windows and macOS operating systems and provide step-by-step instructions to help you monitor the temperature of your CPU and GPU effectively. By the end of this article, you will have the knowledge and tools necessary to ensure that your computer remains cool and performs at its best.
Why Check CPU and GPU Temp?
Monitoring the temperature of your CPU and GPU is crucial for several reasons. Here are some of the key reasons why it is important to regularly check the temperature of these components:
- Preventing Overheating: Overheating can adversely affect the performance and stability of your computer. High temperatures can cause the CPU and GPU to throttle, reducing their clock speeds and resulting in sluggish performance. By monitoring the temperature, you can take necessary measures to prevent overheating, such as improving the airflow in your system or upgrading your cooling solution.
- Protecting Hardware: Excessive heat can lead to the degradation of various computer components, including the CPU and GPU. Prolonged exposure to high temperatures can reduce the lifespan of these components and cause irreversible damage. By keeping an eye on the temperature, you can identify potential issues early on and take steps to protect your hardware from long-term damage.
- Optimizing Performance: CPUs and GPUs are designed to operate within specific temperature ranges. When these components run at optimal temperatures, they can perform at their best. Monitoring the temperature allows you to identify any discrepancies and make adjustments to maintain optimal performance.
- Gaming and Overclocking: If you are a gamer or an overclocking enthusiast, monitoring the CPU and GPU temperature becomes even more crucial. Both gaming and overclocking put a significant load on these components, generating more heat. By monitoring the temperature, you can ensure that your hardware is capable of handling the increased workload and avoid potential overheating issues.
By regularly checking the CPU and GPU temperature, you can ensure the longevity and optimal performance of your computer. It allows you to prevent overheating, protect your hardware investment, and optimize the performance of your system. With a better understanding of the temperature of your CPU and GPU, you can make informed decisions regarding cooling solutions, hardware upgrades, and system optimization.
Method 1: Using Third-Party Software
One of the most convenient ways to check the CPU and GPU temperature is by utilizing third-party software. These software programs provide comprehensive monitoring features and real-time temperature readings. Here’s how you can use third-party software to monitor your CPU and GPU temperature:
- Step 1: Research and choose a reliable third-party software that suits your needs. Some popular options include CPU-Z, HWMonitor, Core Temp, Open Hardware Monitor, and MSI Afterburner. These software programs are free to download and offer detailed temperature information.
- Step 2: Visit the official website of the software you have chosen and download the latest version. Install the software by following the provided instructions.
- Step 3: Launch the software on your computer. Once opened, it will display various hardware information, including temperature readings for your CPU and GPU.
- Step 4: Take note of the temperature readings for both the CPU and GPU. The software may present the temperature in degrees Celsius (°C) or Fahrenheit (°F), so make sure you understand the unit of measurement.
- Step 5: Be aware of the safe temperature ranges for your CPU and GPU. It is crucial to compare the readings with the recommended temperature limits provided by the manufacturer. If the temperature exceeds the safe threshold, you may need to take appropriate actions to prevent overheating, such as improving cooling, cleaning dust buildup, or adjusting system settings.
Using third-party software to monitor CPU and GPU temperature provides you with precise and real-time information. These software programs often offer additional features, such as fan speed control and voltage monitoring, allowing you to optimize your system’s cooling. They also provide comprehensive hardware information, making them valuable tools for computer enthusiasts, gamers, and overclockers.
Method 2: BIOS/UEFI Interface
Another method to check the CPU and GPU temperature is by accessing the BIOS (Basic Input/Output System) or UEFI (Unified Extensible Firmware Interface) interface of your computer. The BIOS/UEFI provides a built-in hardware monitoring feature, allowing you to view vital system information including temperature readings. Here’s how you can check the temperature using the BIOS/UEFI interface:
- Step 1: Restart your computer and access the BIOS/UEFI interface during the boot-up process. The key to access the BIOS/UEFI may vary depending on your computer manufacturer (common keys include Del, F2, F10, or F12).
- Step 2: Once inside the BIOS/UEFI interface, navigate to the hardware monitoring section. The location and labeling of this section may differ depending on the BIOS/UEFI version and manufacturer.
- Step 3: Look for temperature readings related to your CPU and GPU. The BIOS/UEFI interface typically displays the temperature in Celsius (°C).
- Step 4: Take note of the temperature readings and compare them with the recommended safe temperature ranges provided by the manufacturer. If the temperatures are too high, it may indicate a cooling issue that needs to be addressed.
- Step 5: Exit the BIOS/UEFI interface and allow your computer to continue booting into the operating system.
Checking the CPU and GPU temperature through the BIOS/UEFI interface provides a reliable and accurate method, as it directly reads the temperature from the motherboard sensors. However, it’s important to note that accessing the BIOS/UEFI interface requires restarting your computer, and the interface may vary depending on the motherboard manufacturer. Therefore, this method is more suitable for users who are familiar with accessing and navigating the BIOS/UEFI on their specific computer systems.
Method 3: Task Manager (Windows)
If you’re using a Windows operating system, another convenient method to check the CPU and GPU temperature is by using the built-in Task Manager. Task Manager provides a quick and easy way to monitor system performance, including temperature readings. Here’s how you can check the temperature using Task Manager:
- Step 1: Right-click on the taskbar and select “Task Manager” from the context menu. Alternatively, you can press Ctrl+Shift+Esc on your keyboard to open Task Manager directly.
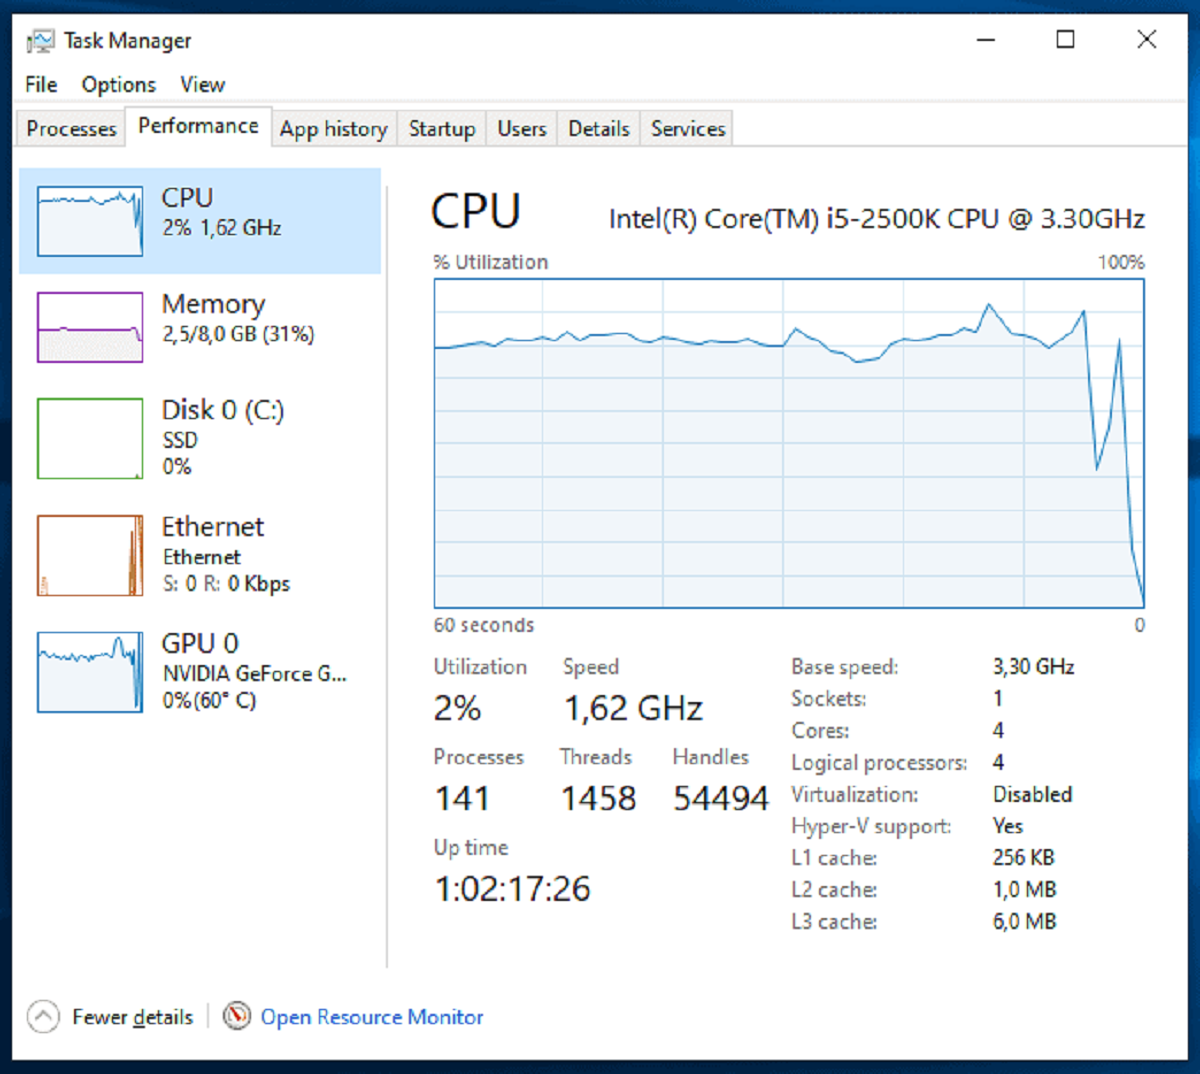
- Step 2: In the Task Manager window, click on the “Performance” tab at the top.
- Step 3: Within the Performance tab, you’ll see several categories on the left. Click on “CPU” or “GPU” to display the usage and temperature graphs for the respective component. The temperature will be displayed in Celsius (°C) on the right side of the graph.
- Step 4: Monitor the temperature readings in real-time. Keep an eye on the temperature levels and ensure they are within the safe operating range specified by the manufacturer. If the temperatures exceed the recommended range, you may need to undertake appropriate measures to cool down your system.
- Step 5: To exit Task Manager, simply click on the “X” button in the top-right corner of the window.
Using Task Manager to check the CPU and GPU temperature is a straightforward method that requires no additional software installation. It provides a convenient way to monitor system performance and temperature readings in real-time. However, it’s important to note that Task Manager’s temperature monitoring feature may not be as detailed or accurate as specialized third-party software or BIOS/UEFI interfaces.
Method 4: Command Prompt/Terminal
For those who prefer a command-line interface, using the Command Prompt (Windows) or Terminal (macOS/Linux) can be an efficient method to check the CPU and GPU temperature. By utilizing specific commands, you can access temperature information directly from the system. Here’s how you can check the temperature using the Command Prompt or Terminal:
- Step 1: Open the Command Prompt on Windows or the Terminal on macOS/Linux. You can typically find these applications by searching for “Command Prompt” or “Terminal” in the respective operating system’s search bar or app launcher.
- Step 2: In the Command Prompt or Terminal, enter the appropriate command to retrieve temperature information. The commands may vary depending on your operating system and hardware. Here are some commonly used commands:
– For Windows:
– Core Temp: `coretemp`
– GPU Temp: `nvidia-smi`, `wmic /namespace:\\root\wmi PATH MSAcpi_ThermalZoneTemperature get CurrentTemperature`, or `wmic /namespace:\\root\wmi PATH MSAcpi_ThermalZoneTemperature get CurrentTemperature /format:list`– For macOS/Linux:
– Core Temp: `sensors` or `lm-sensors` (you may need to install lm-sensors using package manager) - Step 3: The command output will display temperature information for your CPU and GPU, typically in degrees Celsius (°C). Take note of the readings and compare them with the recommended safe temperature ranges specified by the manufacturer.
- Step 4: Close the Command Prompt or Terminal window when you’re finished.
Utilizing the Command Prompt or Terminal to check the CPU and GPU temperature provides a command-line alternative to dedicated software or graphical interfaces. It allows for quick access to temperature information without the need for additional programs. However, it’s important to note that the commands and output may vary based on your operating system version and hardware compatibility.
Method 5: Using GPU-Z (For GPU Temp)
To check the temperature of your GPU (Graphics Processing Unit) specifically, you can utilize a dedicated software program called GPU-Z. GPU-Z is a lightweight and user-friendly tool that provides detailed information about your graphics card, including temperature readings. Here’s how you can use GPU-Z to check the GPU temperature:
- Step 1: Download GPU-Z from the official website and install it on your computer. GPU-Z is available for free and supports both Windows and macOS operating systems.
- Step 2: Launch GPU-Z by double-clicking on the desktop icon or by searching for it in the Start Menu (Windows) or Applications folder (macOS).
- Step 3: Once GPU-Z is open, it will display a range of information about your graphics card. Navigate to the “Sensors” tab located at the top of the window.
- Step 4: In the Sensors tab, you will find real-time data about various aspects of your GPU, such as temperature, fan speed, and clock speeds. Look for the “GPU Temperature” reading to find the current temperature of your graphics card.
- Step 5: Take note of the GPU temperature reading and compare it to the recommended safe temperature range provided by the manufacturer. If the temperature exceeds the recommended range, you may need to address cooling issues or adjust GPU settings.
GPU-Z offers a straightforward and reliable method of checking the temperature of your GPU. It provides accurate real-time data and additional information about your graphics card. Whether you are a gamer, a video editor, or a cryptocurrency miner, monitoring your GPU temperature with GPU-Z ensures optimal performance and prevents overheating-related problems.
Method 6: Using HWMonitor
HWMonitor is a popular and comprehensive software program that allows you to monitor various aspects of your computer’s hardware, including temperature readings for your CPU, GPU, and other components. With its user-friendly interface and real-time monitoring capabilities, HWMonitor provides an excellent way to check the temperature of your system. Here’s how you can use HWMonitor to monitor the CPU and GPU temperature:
- Step 1: Download HWMonitor from the official website and install it on your computer. HWMonitor is compatible with both Windows and macOS operating systems.
- Step 2: Launch HWMonitor by double-clicking on the desktop icon or searching for it in the Start Menu (Windows) or Applications folder (macOS).
- Step 3: Once HWMonitor is open, it will display a list of hardware components and their corresponding temperature readings. Scroll down or navigate through the tabs to find the CPU and GPU temperature readings.
- Step 4: Take note of the temperature readings for the CPU and GPU. HWMonitor displays the temperatures in Celsius (°C) by default, but you can change it to Fahrenheit (°F) in the settings if desired.
- Step 5: Compare the temperature readings to the recommended safe temperature ranges for your CPU and GPU. If the temperatures are outside the safe range, you may need to address cooling issues or adjust system settings to prevent overheating.
Using HWMonitor to check the CPU and GPU temperature provides a comprehensive solution for monitoring system temperatures. With its user-friendly interface and real-time data, HWMonitor is a valuable tool for both casual computer users and enthusiasts who want to ensure their system remains cool and performs optimally.
Method 7: Using Core Temp
Core Temp is a specialized software program designed to monitor the temperature of your CPU. It provides accurate and detailed information about each individual core of your processor, allowing you to keep a close eye on the temperature of your CPU. Here’s how you can use Core Temp to check the CPU temperature:
- Step 1: Download Core Temp from the official website and install it on your computer. Core Temp is available for Windows operating systems.
- Step 2: Launch Core Temp by double-clicking on the desktop icon or searching for it in the Start Menu.
- Step 3: Once Core Temp is open, it will display a list of temperature readings for each core of your CPU. You will also find additional information such as load percentage, frequency, and power usage.
- Step 4: Take note of the temperature readings for each core of your CPU. Core Temp displays the temperatures in degrees Celsius (°C) by default.
- Step 5: Compare the temperature readings to the recommended safe temperature range for your CPU. If any of the cores exceed the safe limit, you may need to investigate cooling solutions or adjust your system setup to prevent overheating.
Core Temp provides a specialized and focused approach to monitoring CPU temperature. With its ability to track individual core temperatures, it allows for a more detailed analysis of CPU performance and temperature distribution. Whether you are a gamer, a content creator, or simply want to keep your CPU running smoothly, Core Temp is an excellent tool for monitoring and managing CPU temperature.
Method 8: Using Speccy
Speccy is a powerful system information tool that provides detailed information about your computer’s hardware, including temperature readings for various components. With its user-friendly interface and comprehensive data, Speccy allows you to easily monitor the temperature of your CPU, GPU, and other key hardware components. Here’s how you can use Speccy to check the temperature:
- Step 1: Download Speccy from the official website and install it on your computer. Speccy is compatible with Windows operating systems.
- Step 2: Launch Speccy by double-clicking on the desktop icon or searching for it in the Start Menu.
- Step 3: Once Speccy is open, it will display a summary of your computer’s hardware components. Click on the “Summary” tab on the left-hand side to view the basic system information.
- Step 4: To check the temperature, click on the “Temperatures” tab on the left-hand side. Here, you will find temperature readings for various components, including the CPU and GPU.
- Step 5: Take note of the temperature readings for the CPU and GPU. Speccy displays the temperature in degrees Celsius (°C) by default.
- Step 6: Compare the temperature readings to the recommended safe temperature ranges for your CPU and GPU. If the temperatures are outside the safe range, you may need to address cooling issues or adjust your system setup to prevent overheating.
Speccy provides a comprehensive and detailed overview of your computer’s hardware, making it a valuable tool for monitoring temperature and system health. With its intuitive interface and real-time data, Speccy is a great choice for both novices and tech enthusiasts who want to keep a close eye on their computer’s temperature and performance.
Method 9: Using Open Hardware Monitor
Open Hardware Monitor is a free and open-source software program that allows you to monitor the temperature and health of your computer’s hardware components. It provides real-time temperature readings for your CPU, GPU, and other important sensors. Here’s how you can use Open Hardware Monitor to check the temperature:
- Step 1: Download Open Hardware Monitor from the official website and install it on your computer. Open Hardware Monitor is compatible with Windows operating systems.
- Step 2: Launch Open Hardware Monitor by double-clicking on the desktop icon or searching for it in the Start Menu.
- Step 3: Once Open Hardware Monitor is open, it will display a list of hardware components and their respective temperature readings. Scroll down or navigate through the sections to find the temperature readings for your CPU and GPU.
- Step 4: Take note of the temperature readings for the CPU and GPU. Open Hardware Monitor displays the temperatures in degrees Celsius (°C) by default.
- Step 5: Compare the temperature readings to the recommended safe temperature ranges for your CPU and GPU. If any of the temperatures exceed the safe range, you may need to address cooling issues or adjust your system setup to prevent potential overheating concerns.
Open Hardware Monitor provides a reliable and open-source solution for monitoring the temperature of your computer’s hardware components. With its intuitive interface and real-time data, Open Hardware Monitor is a valuable tool for keeping your system cool and operating optimally.
Method 10: Using MSI Afterburner
MSI Afterburner is a powerful overclocking utility that also offers robust monitoring features, including temperature readings for your GPU and CPU. While primarily known for its overclocking capabilities, it can be utilized to monitor the temperature of your system as well. Here’s how you can use MSI Afterburner to check the temperature:
- Step 1: Download MSI Afterburner from the official website and install it on your computer. MSI Afterburner is compatible with both NVIDIA and AMD graphics cards.
- Step 2: Launch MSI Afterburner by double-clicking on the desktop icon. Ensure that your graphics card is compatible and properly detected by the software.
- Step 3: In the main MSI Afterburner window, you will find a range of data including the core clock, memory clock, fan speed, and temperature. The temperature reading will be displayed for your GPU.
- Step 4: Take note of the GPU temperature reading provided by MSI Afterburner. The temperature is typically displayed in degrees Celsius (°C).
- Step 5: Compare the GPU temperature reading to the recommended safe temperature range specified by the manufacturer. If the temperature exceeds the safe range, you may need to address cooling issues or adjust your system’s settings.
- Step 6: Additionally, MSI Afterburner provides the ability to create custom fan curves, monitor usage statistics, and record performance benchmarks, making it a versatile tool for both monitoring and optimizing your system.
MSI Afterburner is a feature-rich utility that delivers accurate temperature readings for your GPU and provides additional tools for optimizing your system’s performance. Whether you are an overclocking enthusiast or simply concerned about monitoring the temperature of your GPU, MSI Afterburner is an excellent choice for keeping your system cool and maximizing performance.
Understanding Safe Temperature Ranges
Knowing the safe temperature ranges for your CPU and GPU is crucial to ensure optimal performance and prevent overheating-related issues. While specific temperature ranges may vary depending on the hardware manufacturer and model, understanding the general guidelines can help you gauge the health of your system. Here’s a breakdown of safe temperature ranges:
CPU:
For most CPUs, the safe temperature range during normal operation is typically between 40°C and 80°C (104°F-176°F). However, lower temperatures are always preferred, especially when the CPU is under heavy load, such as during gaming or rendering tasks.
It’s important to note that some high-performance CPUs, like those used in gaming PCs or workstations, may have higher safe temperature limits. These CPUs often feature advanced cooling solutions and can handle elevated temperatures more efficiently. Checking the manufacturer’s specifications or consulting online resources specific to your CPU model is recommended for accurate temperature guidelines.
GPU:
GPUs generally operate at higher temperatures compared to CPUs. The safe temperature range for GPUs is typically between 60°C and 85°C (140°F-185°F) during normal use. However, like CPUs, lower temperatures are preferred for optimal performance and longevity.
Similar to CPUs, certain high-performance GPUs or those employed in heavy gaming or professional applications may have extended safe temperature ranges. Referencing the manufacturer’s specifications or online resources for your specific GPU model is advised to ensure you are aware of the correct safe temperature limits.
It’s important to note that temperature limits may also differ for laptops and small form factor systems, as their cooling capabilities are often more limited. These systems may have more stringent safe temperature ranges to prevent overheating in compact enclosures.
Regularly monitoring the temperature of your CPU and GPU and ensuring they stay within the safe ranges can help prevent performance degradation, stability issues, and potential hardware damage. If you find that your components consistently exceed the recommended limits, consider implementing better cooling solutions, improving ventilation in your system, or seeking professional assistance to address any underlying issues.
Conclusion
Checking the temperature of your CPU and GPU is essential for maintaining optimal performance and ensuring the longevity of your computer. Overheating can cause system instability, reduced performance, and even permanent hardware damage. By regularly monitoring the temperature, you can take proactive measures to prevent overheating and optimize your system’s cooling.
In this article, we explored various methods to check the CPU and GPU temperature. We discussed using third-party software, accessing the BIOS/UEFI interface, utilizing the Task Manager, employing Command Prompt or Terminal commands, and using specialized software such as GPU-Z, HWMonitor, Core Temp, Speccy, Open Hardware Monitor, and MSI Afterburner.
Each method has its own advantages and suitability depending on your specific needs and preferences. Third-party software provides comprehensive monitoring features and user-friendly interfaces, while the BIOS/UEFI interface offers direct access to hardware information. The Command Prompt or Terminal allows for command-line monitoring, and specialized software provides detailed tracking of specific components.
Understanding safe temperature ranges for your CPU and GPU is crucial for assessing the health of your system. While specific safe temperature ranges may vary, general guidelines suggest around 40°C to 80°C (104°F-176°F) for CPUs and 60°C to 85°C (140°F-185°F) for GPUs during normal operation.
By regularly monitoring and managing the temperature of your CPU and GPU, you can optimize performance, prevent overheating-related issues, and ensure the longevity of your hardware. Implementing appropriate cooling solutions, improving airflow, and addressing any overheating concerns promptly will contribute to a smoother and more reliable computing experience.
Remember to choose the method that best suits your needs and preferences, and always refer to the manufacturer’s recommendations and specifications for accurate temperature guidelines. With proper temperature monitoring, you can enjoy a stable and efficient computer system for years to come.