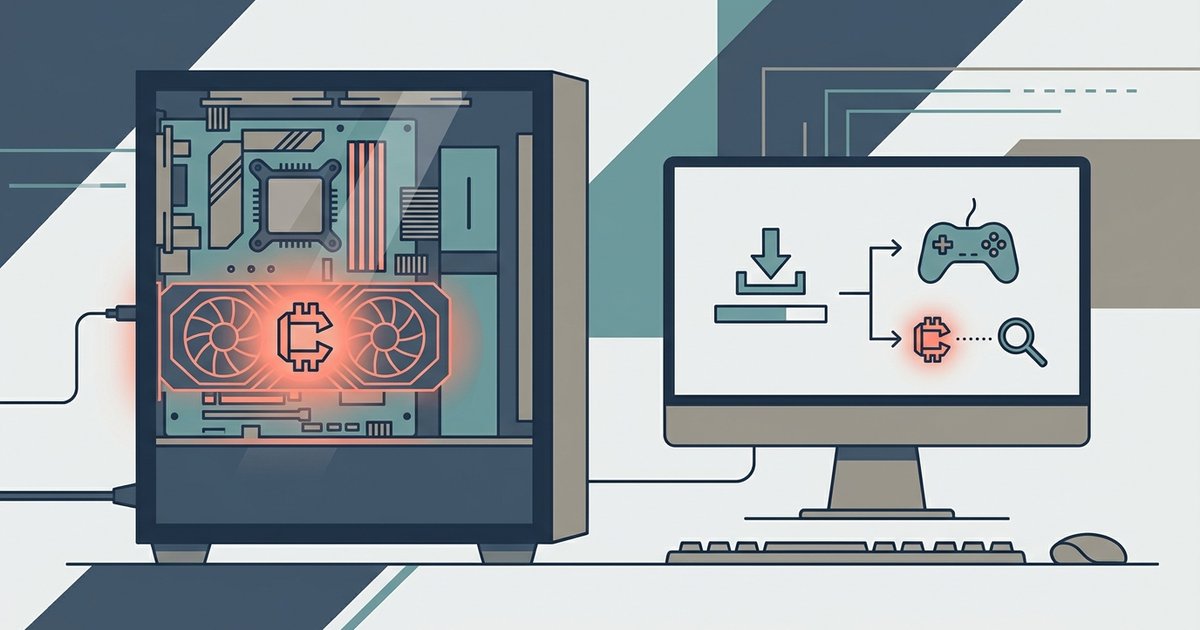





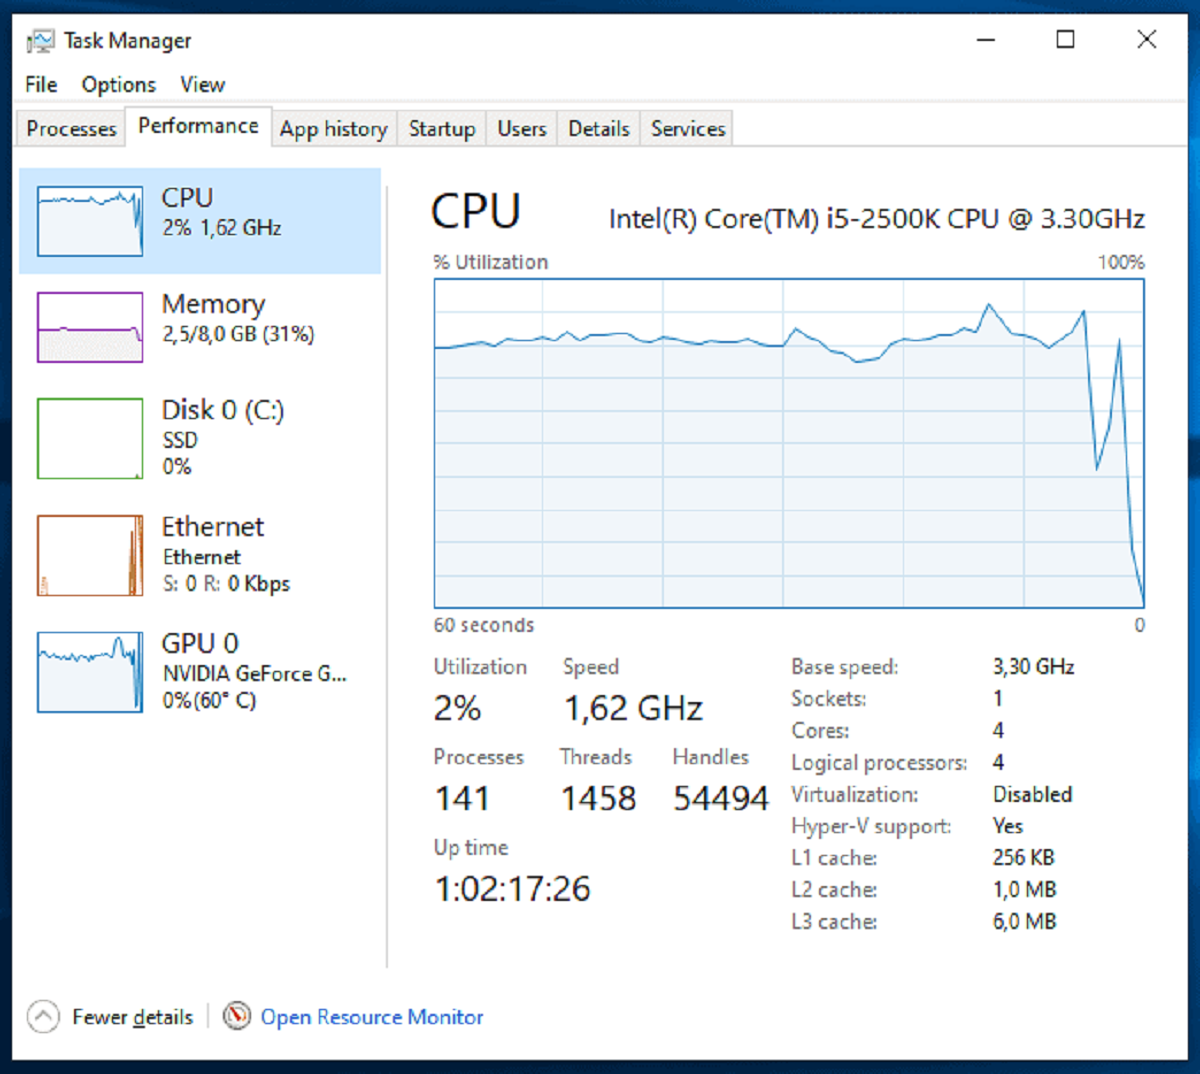
To check CPU temp in Windows, you need to use a third-party monitoring tool because Task Manager does not display CPU temperature. While Task Manager is excellent for monitoring CPU usage and diagnosing performance issues, it lacks a built-in temperature sensor readout, so you must rely on dedicated software for thermal data.
Does task manager show CPU temp?
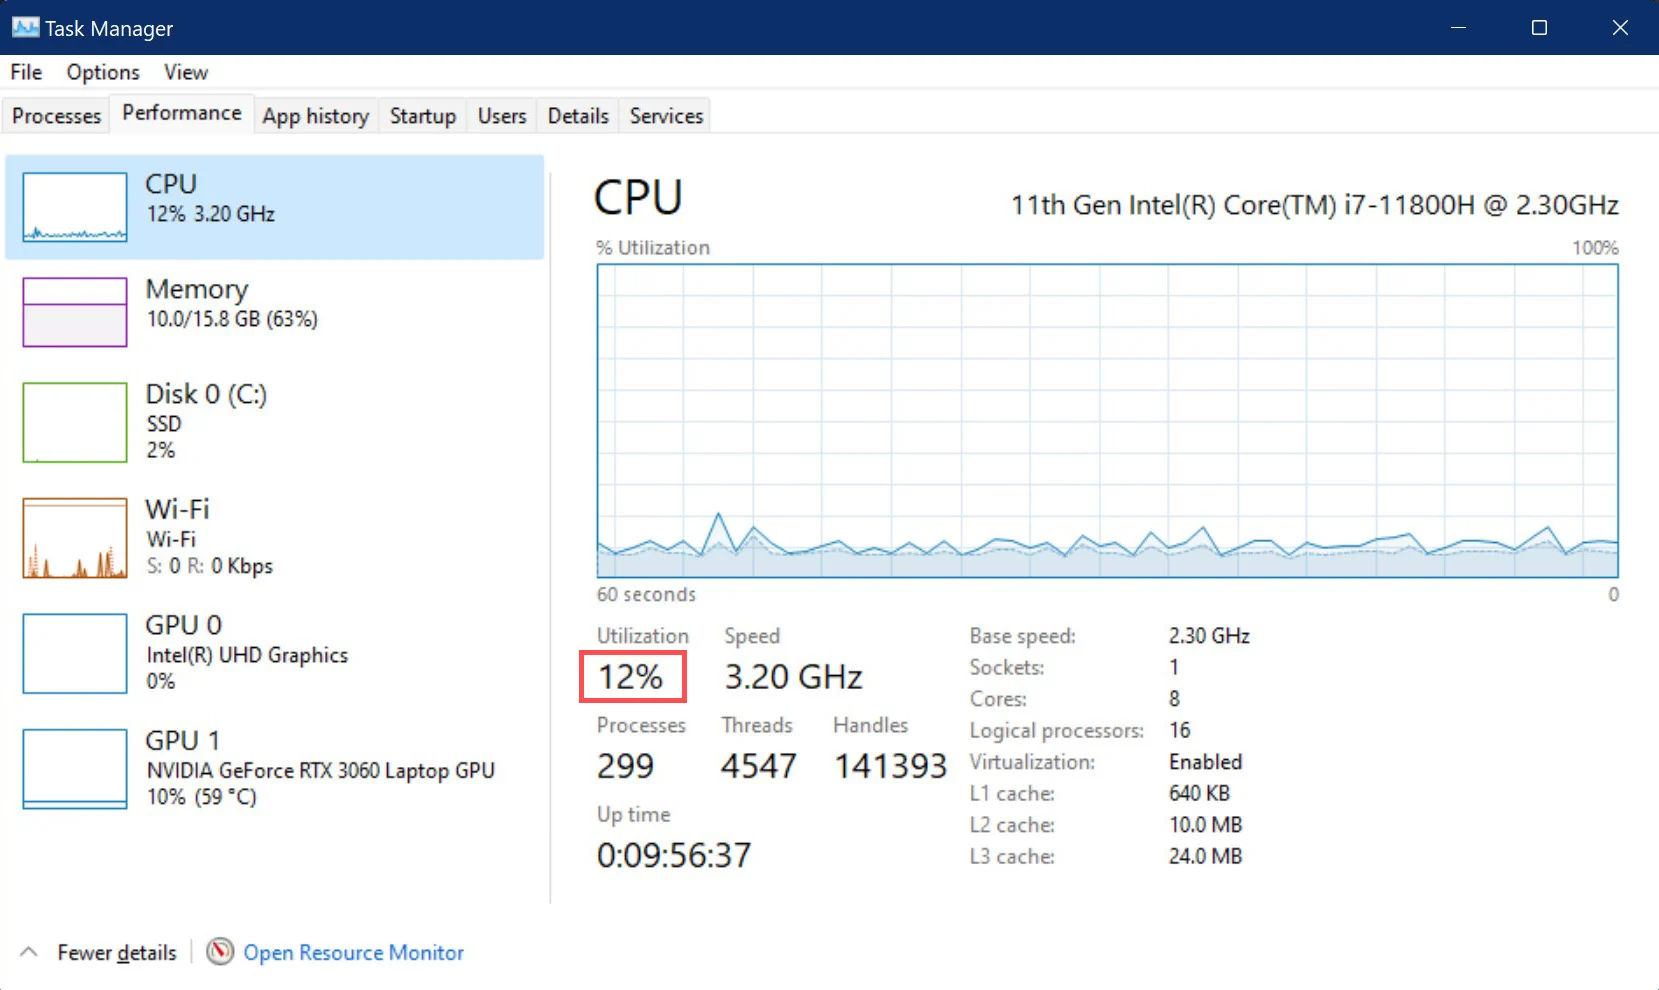
No, Windows Task Manager does not show CPU temperature. Despite what some outdated or misleading sources may claim, the Performance tab in Task Manager displays CPU utilization, speed, and core counts, but never a temperature reading. This is a common misconception because Task Manager provides such detailed performance metrics that users naturally expect it to include thermal data. However, Microsoft has not added this feature to the default Task Manager, and the majority of verified sources confirm that temperature monitoring requires separate software. If you see any mention of temperature in Task Manager, it is likely a misunderstanding or a feature from a third-party overlay.
How to actually check your CPU temp
The correct method to check CPU temperature is to install a trusted third-party monitoring utility. These programs read the sensors built into your CPU and motherboard, giving you accurate real-time temperature data. Reliable options include Core Temp, HWiNFO, HWMonitor, and Speccy. Core Temp is particularly useful because it shows the temperature of each individual core in a compact window that can sit on your desktop or taskbar. HWiNFO provides a comprehensive system overview, including CPU, GPU, and motherboard temperatures, fan speeds, and voltages. To use these tools, download them from the official developer website, install the software, and launch it. The main interface will display your CPU temperature in degrees Celsius (or Fahrenheit if you change the setting). You can keep the software running in the background to monitor temperatures during gaming, video editing, or other intensive tasks. If you're working with a compact single-board computer, you'll need a different approach to check my CPU usage on Raspberry Pi.
Using task manager to diagnose overheating
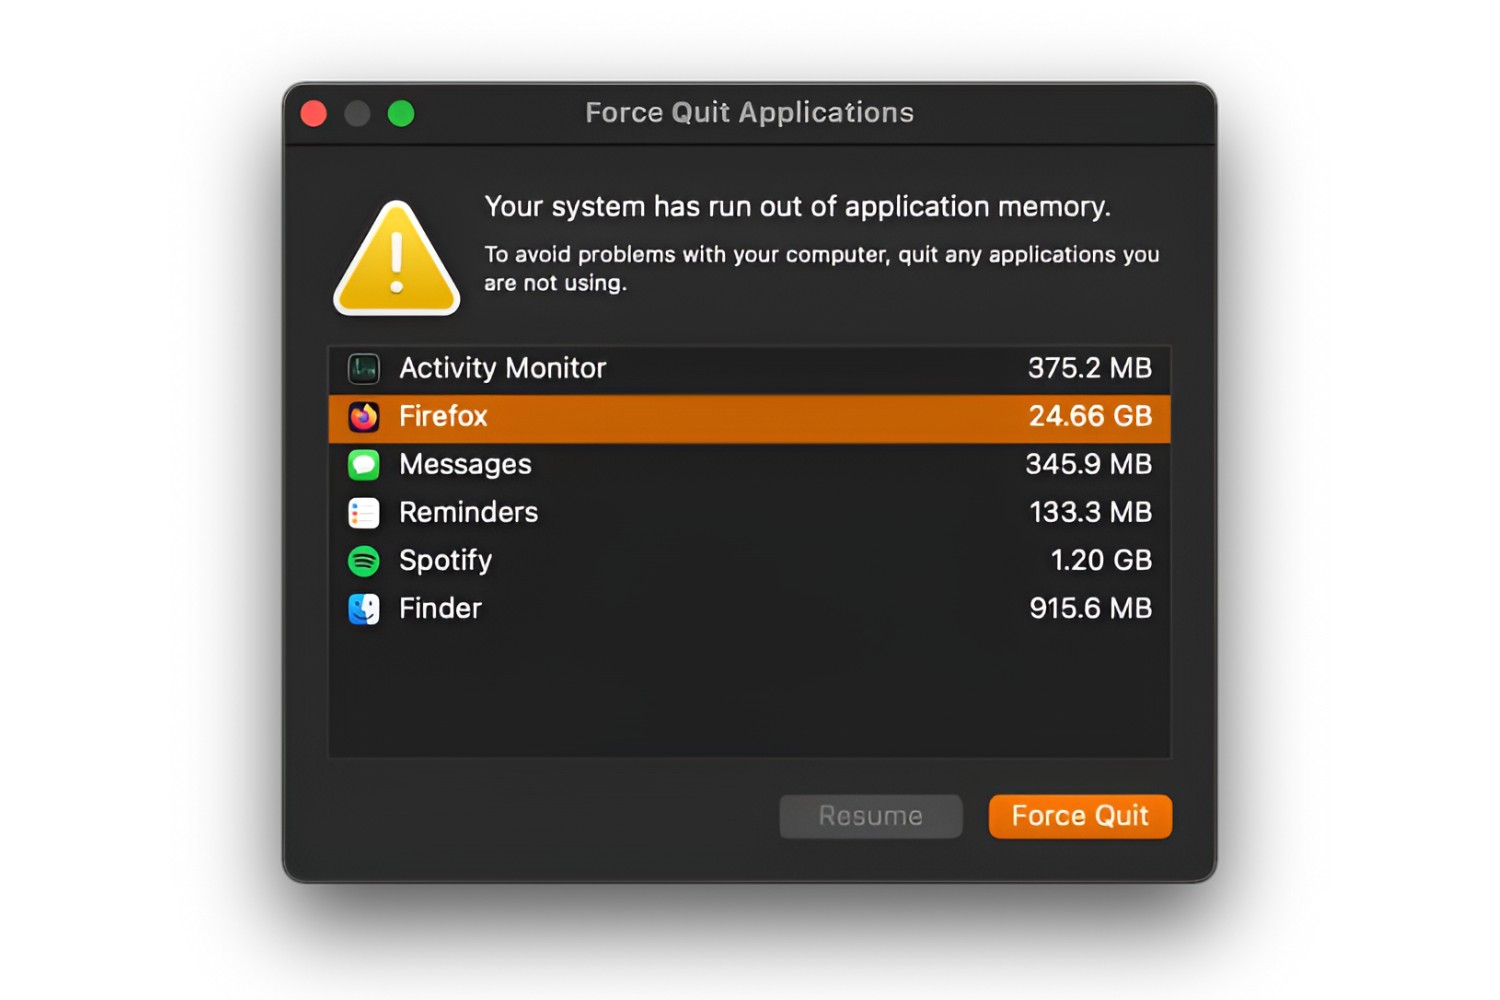
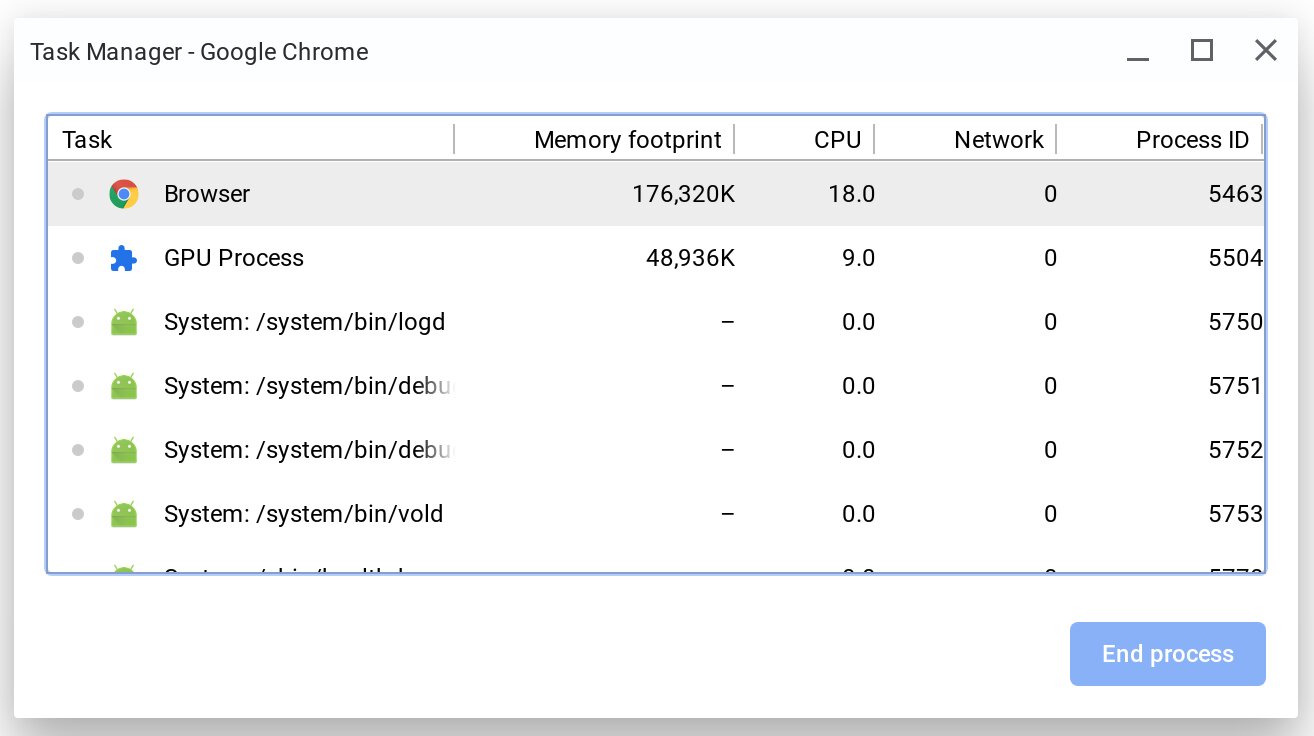
Even though Task Manager cannot show temperature, it is still a vital tool for diagnosing overheating issues. When your CPU is running hot, the most common cause is a process or application consuming excessive processing power. Open Task Manager by pressing Ctrl+Shift+Esc or right-clicking the taskbar and selecting "Task Manager." Click the "Processes" tab to see a list of all running programs and background processes sorted by CPU usage. If you notice a single process using 80% or more of your CPU for an extended period, that process is generating significant heat. You can end that task by selecting it and clicking "End task" to immediately reduce CPU load and temperature. The "Performance" tab shows a real-time graph of overall CPU utilization, which helps you confirm whether high usage coincides with high temperatures reported by your monitoring software. This combination of tools lets you pinpoint exactly which software is causing your CPU to overheat.
Understanding safe CPU temperature ranges
Knowing what temperature readings mean is essential for protecting your hardware. When you check CPU temp in your monitoring software, normal idle temperatures typically range from 30°C to 50°C (86°F to 122°F), though this varies by CPU model and ambient temperature. Your CPU's exact safe limit depends on the specific model, which you can find in the manufacturer's specifications. The monitoring software you install will often include a max recorded temperature, helping you see the peak heat your CPU reached during a session.
Troubleshooting high CPU temperatures
If your monitoring software shows temperatures consistently exceeding safe limits, take these actionable steps to fix the issue. First, clean dust from your computer's fans, heatsinks, and air vents using compressed air, as dust buildup blocks airflow and traps heat. Second, check that your CPU cooler is properly seated and that the thermal paste between the CPU and cooler has not dried out; reapplying thermal paste can dramatically lower temperatures. Third, use Task Manager to close unnecessary background processes that are driving up CPU utilization. Fourth, improve your computer's ventilation by ensuring the case has adequate intake and exhaust fans and that the system is not placed on soft surfaces like carpet. Fifth, update your motherboard BIOS and chipset drivers, as manufacturers sometimes release fixes for thermal management. If temperatures remain high after these steps, your CPU cooler may be inadequate for your workload, and upgrading to a more powerful air or liquid cooler is the next solution.
\nRelated reading: How To Allocate More CPU To A Game and Why Is My CPU Usage So High With Nothing Running.