Introduction
Google Chrome is not just a web browser; it's a powerful tool that offers a wide array of features to enhance the browsing experience and aid developers in creating and optimizing websites and web applications. One of the most valuable components of Chrome for developers is the built-in Developer Tools, also known as DevTools. These tools provide a comprehensive set of utilities for inspecting, debugging, and optimizing web pages and applications.
Whether you're a seasoned developer or just starting out, understanding how to access and utilize Chrome's Developer Tools can significantly improve your productivity and efficiency. By gaining proficiency in these tools, you can troubleshoot issues, optimize performance, and gain valuable insights into the inner workings of websites and web applications.
In this article, we will explore the various tabs and functionalities within Chrome's Developer Tools, providing an in-depth look at how each component can be leveraged to streamline development processes and enhance the overall browsing experience. From inspecting and modifying the DOM (Document Object Model) to analyzing network activity and performance metrics, Chrome's Developer Tools offer a wealth of capabilities that can benefit developers, designers, and anyone interested in understanding the intricacies of web technologies.
So, let's embark on a journey through the different tabs and features of Chrome's Developer Tools, uncovering the wealth of resources at your disposal for building, debugging, and optimizing web content. Whether you're a web developer, designer, or simply curious about the inner workings of the web, this exploration of Chrome's Developer Tools will equip you with valuable knowledge and practical skills to elevate your web development endeavors.
Accessing Developer Tools
Accessing Chrome's Developer Tools is a straightforward process that empowers users to delve into the inner workings of web pages and applications. Whether you're a developer, designer, or simply curious about the underlying structure of websites, gaining access to these tools is the first step toward unlocking a wealth of insights and capabilities.
To access Developer Tools in Chrome, you can utilize several methods, each offering quick and convenient access to the suite of powerful utilities. Here are the primary ways to access Developer Tools:
-
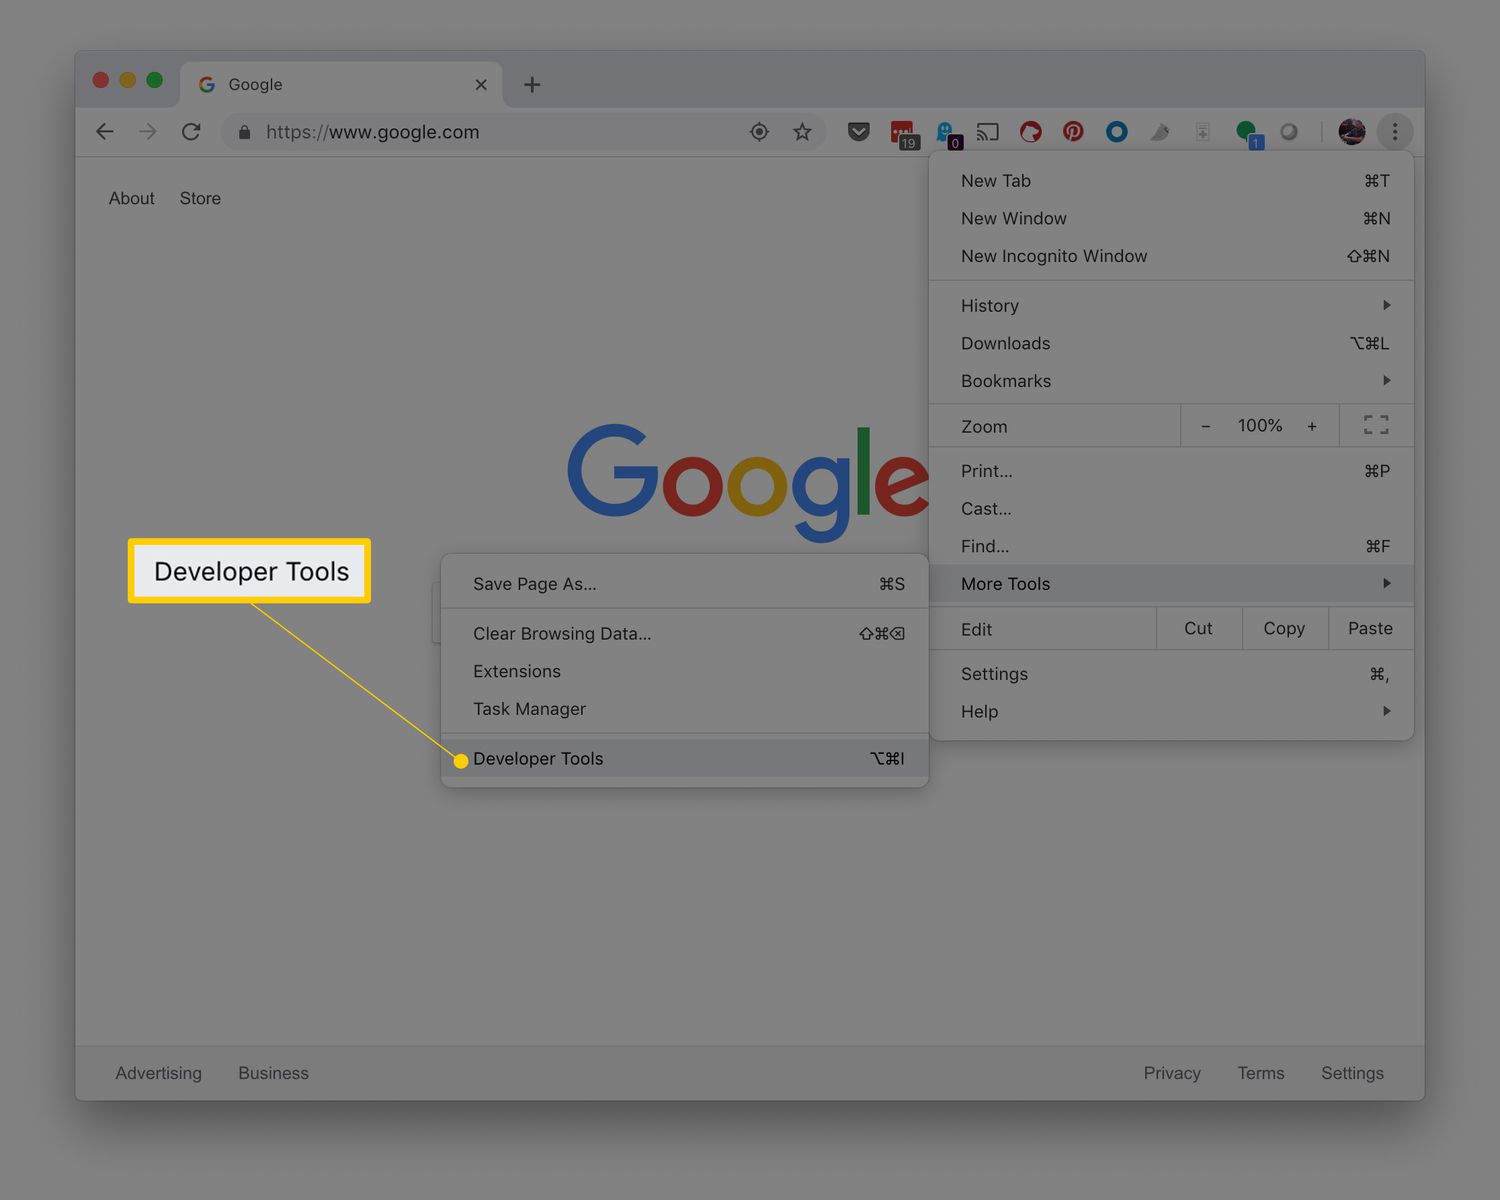
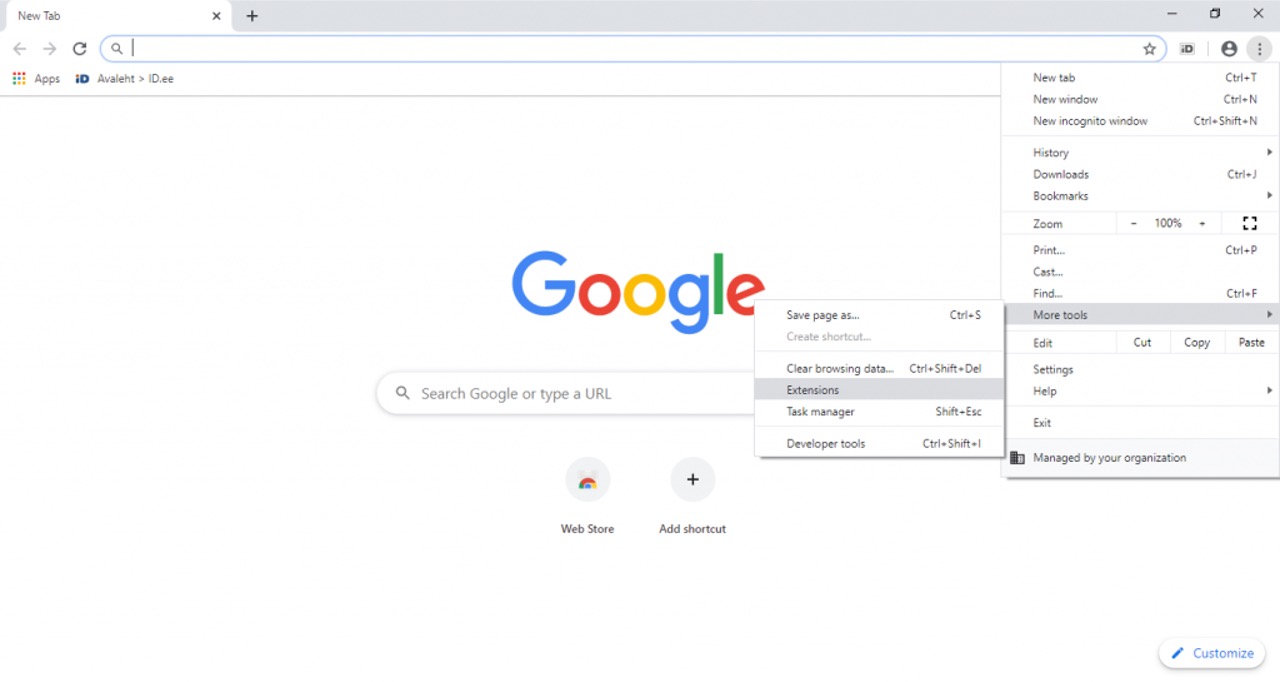
Using the Menu Bar:
- Click on the three-dot menu icon in the top-right corner of the Chrome window.
- Navigate to "More Tools" and select "Developer Tools" from the dropdown menu.
-
Using Keyboard Shortcuts:
- For Windows and Linux users, press
Ctrl + Shift + Ito open Developer Tools. - For Mac users, press
Cmd + Option + I.
- For Windows and Linux users, press
-
Right-Click Context Menu:
- Right-click on any element within a web page and select "Inspect" from the context menu. This action will open Developer Tools and automatically highlight the corresponding HTML element.
Once you've accessed Developer Tools, a panel will appear at the bottom or right side of the Chrome window, depending on your configuration. This panel is divided into several tabs, each offering distinct functionalities for inspecting, debugging, and optimizing web content.
By accessing Developer Tools, users gain the ability to inspect and modify the Document Object Model (DOM), analyze network activity, debug JavaScript, optimize performance, and much more. These tools provide invaluable insights into the structure and behavior of web pages, empowering developers and designers to create and optimize web content with precision and efficiency.
With Developer Tools at your fingertips, you have the power to unravel the intricacies of web technologies, troubleshoot issues, and optimize the performance of websites and web applications. Whether you're a seasoned developer or a newcomer to web development, mastering the art of accessing and utilizing Chrome's Developer Tools is a pivotal step toward enhancing your proficiency and productivity in the digital realm.
Elements Tab
The Elements tab within Chrome's Developer Tools is a fundamental component that provides a comprehensive view of the Document Object Model (DOM) and CSS styles associated with a web page. Upon accessing the Elements tab, users are presented with a visual representation of the HTML structure of the page, allowing them to inspect and manipulate individual elements with precision and ease.
At the core of the Elements tab is the DOM tree, which visually represents the hierarchical structure of HTML elements on the page. By expanding and collapsing nodes within the tree, users can navigate through the various elements comprising the web page, gaining a clear understanding of the relationships and nesting of HTML elements.
One of the most powerful features of the Elements tab is the ability to inspect and modify HTML and CSS in real time. By simply hovering over elements within the DOM tree or selecting them directly within the rendered page, users can view and manipulate the associated CSS styles, attributes, and content. This real-time editing capability empowers developers and designers to experiment with changes, instantly observing the impact on the page's layout and appearance.
Furthermore, the Elements tab offers a wealth of additional functionalities, including the ability to add, remove, or modify HTML attributes and content, as well as the capability to toggle CSS styles and classes. This level of granular control provides users with the means to fine-tune the visual presentation and behavior of web pages, facilitating the process of debugging and refining the layout and styling of web content.
In addition to inspecting and modifying individual elements, the Elements tab also provides a robust set of tools for analyzing box models, computed styles, event listeners, and more. These tools enable users to gain insights into the positioning, dimensions, and styling of elements, as well as the interactions and event handling associated with specific elements on the page.
In essence, the Elements tab serves as a gateway to the inner workings of web pages, offering a visual and interactive interface for inspecting, manipulating, and understanding the structure and styling of HTML elements. By harnessing the capabilities of the Elements tab, developers and designers can gain a deeper understanding of web content, troubleshoot layout and styling issues, and refine the visual presentation of websites and web applications with precision and efficiency.
Console Tab
The Console tab within Chrome's Developer Tools serves as a versatile and powerful tool for debugging JavaScript, logging messages, and interacting with the JavaScript runtime environment of web pages and applications. Upon accessing the Console tab, users are presented with a command-line interface that enables them to execute JavaScript code, log messages, and capture runtime errors and warnings.
At its core, the Console tab provides a JavaScript console that allows users to interact with the JavaScript environment of the web page. This interactive console empowers developers to execute JavaScript expressions and statements directly within the context of the page, facilitating rapid experimentation and testing of code snippets. By leveraging the console, developers can evaluate expressions, manipulate the DOM, and interact with the underlying JavaScript runtime, gaining valuable insights into the behavior and state of web pages.
One of the primary functions of the Console tab is to log messages, errors, and warnings generated by JavaScript code running on the page. Developers can utilize the console.log() method to output custom messages, variables, and objects to the console, providing a means to track the flow of execution, inspect variable values, and diagnose issues within their JavaScript code. Additionally, the console offers methods such as console.error() and console.warn() to specifically log error and warning messages, aiding in the identification and resolution of runtime issues.
Furthermore, the Console tab serves as a platform for capturing and analyzing runtime errors and exceptions thrown by JavaScript code. When an error occurs during the execution of JavaScript, the console provides detailed information about the error type, stack trace, and context in which the error occurred, empowering developers to pinpoint the source of the issue and take corrective action. By leveraging the error logging capabilities of the console, developers can efficiently troubleshoot and resolve JavaScript errors, ensuring the robustness and reliability of web applications.
In addition to logging messages and errors, the Console tab offers a range of additional features, including autocomplete for JavaScript expressions, syntax highlighting, and the ability to filter and search through logged messages. These features enhance the usability and efficiency of the console, enabling developers to navigate and analyze console output with ease.
In essence, the Console tab is a vital component of Chrome's Developer Tools, providing developers with a powerful environment for debugging JavaScript, logging messages, and interacting with the JavaScript runtime of web pages. By harnessing the capabilities of the Console tab, developers can gain valuable insights into the behavior of JavaScript code, diagnose and resolve runtime issues, and streamline the development and debugging of web applications.
Sources Tab
The Sources tab within Chrome's Developer Tools is a pivotal component that offers a comprehensive set of functionalities for inspecting, debugging, and analyzing JavaScript source code within web pages and applications. Upon accessing the Sources tab, users are presented with a rich interface that empowers them to explore and interact with the JavaScript source files associated with the page, gaining valuable insights into the structure, behavior, and execution of JavaScript code.
At the core of the Sources tab is the ability to view and navigate through the JavaScript source files that comprise the web page. The tab provides a file tree view, allowing users to explore the hierarchy of JavaScript files and folders associated with the page, facilitating seamless navigation and inspection of the codebase. By selecting individual source files, users can delve into the contents of the files, gaining visibility into the JavaScript code and associated resources.
One of the primary functionalities of the Sources tab is the capability to set breakpoints within JavaScript code, enabling users to pause the execution of code at specific points and inspect the state of variables, objects, and the call stack. By setting breakpoints, developers can gain precise control over the execution flow of JavaScript, facilitating the process of debugging and diagnosing issues within the code. Additionally, the tab offers features for stepping through code, resuming execution, and observing the values of variables, empowering users to gain valuable insights into the behavior of JavaScript code.
Furthermore, the Sources tab provides a robust set of tools for managing and debugging asynchronous code, including the ability to inspect and debug event listeners, timers, and asynchronous function calls. This functionality is particularly valuable for understanding and troubleshooting complex interactions and asynchronous behavior within JavaScript code, providing users with the means to gain clarity and control over the execution flow of asynchronous operations.
In addition to debugging capabilities, the Sources tab offers features for live editing and persisting changes to JavaScript source files, empowering users to experiment with modifications to the code and observe the real-time impact on the behavior of the web page. This real-time editing capability facilitates rapid iteration and testing of code changes, enhancing the efficiency and effectiveness of the development process.
In essence, the Sources tab serves as a vital resource within Chrome's Developer Tools, providing developers with a powerful environment for inspecting, debugging, and analyzing JavaScript source code. By harnessing the capabilities of the Sources tab, developers can gain valuable insights into the behavior and execution of JavaScript, troubleshoot and diagnose issues within the code, and optimize the performance and reliability of web applications.
Network Tab
The Network tab within Chrome's Developer Tools is a critical component that offers comprehensive insights into the network activity associated with web pages and applications. Upon accessing the Network tab, users are presented with a wealth of information and tools for monitoring, analyzing, and optimizing network requests, empowering them to gain a deep understanding of the network performance and behavior of web content.
At the core of the Network tab is the network request log, which provides a detailed overview of all HTTP requests and responses made by the web page. Each entry in the log includes essential details such as the request method, URL, status code, response size, and timing information, enabling users to track the sequence and performance of network requests. By inspecting individual entries in the log, users can gain insights into the timing, headers, and content of each request and response, facilitating the process of diagnosing and optimizing network performance.
One of the primary functionalities of the Network tab is the ability to analyze the timing and performance metrics of network requests, including the duration of DNS resolution, TCP connection, SSL handshake, request, and response phases. By examining the timing breakdown of individual requests, users can identify potential bottlenecks and inefficiencies within the network activity, enabling them to optimize the performance and responsiveness of web pages and applications.
Furthermore, the Network tab offers powerful tools for capturing and analyzing network traffic, including the ability to record and replay network requests. By initiating network recording, users can capture a comprehensive log of all network activity occurring during a specific interaction with the web page, facilitating in-depth analysis and troubleshooting of network-related issues. Additionally, the tab provides features for filtering and sorting network requests based on various criteria, enhancing the usability and efficiency of network analysis.
In addition to monitoring network requests, the Network tab offers insights into resource loading and caching behavior, enabling users to evaluate the efficiency of resource utilization and caching strategies within web pages. By examining the caching status and headers of network requests, users can gain visibility into the caching behavior of resources, facilitating the optimization of caching policies and the reduction of redundant network activity.
In essence, the Network tab serves as a vital resource within Chrome's Developer Tools, providing developers with a powerful environment for monitoring, analyzing, and optimizing network activity. By harnessing the capabilities of the Network tab, developers can gain valuable insights into the performance and behavior of network requests, diagnose and resolve network-related issues, and optimize the responsiveness and efficiency of web applications.
Performance Tab
The Performance tab within Chrome's Developer Tools is a pivotal component that offers a comprehensive set of functionalities for analyzing and optimizing the performance of web pages and applications. Upon accessing the Performance tab, users are presented with a rich interface that empowers them to capture, analyze, and visualize performance metrics, gaining valuable insights into the runtime behavior and efficiency of web content.
At the core of the Performance tab is the capability to record and analyze performance profiles, enabling users to capture a detailed timeline of events and activities occurring within the web page. By initiating a performance recording, users can capture a comprehensive log of activities such as JavaScript execution, rendering, painting, and user interactions, providing a holistic view of the runtime behavior and responsiveness of the page.
One of the primary functionalities of the Performance tab is the ability to analyze and interpret performance profiles, including the visualization of key performance metrics such as CPU utilization, JavaScript execution time, rendering performance, and network activity. By examining the performance profile, users can identify potential bottlenecks, inefficiencies, and opportunities for optimization within the web page, enabling them to streamline the performance and responsiveness of web applications.
Furthermore, the Performance tab offers powerful tools for diagnosing and resolving performance issues, including the ability to identify and analyze long-running JavaScript tasks, layout recalculations, and rendering bottlenecks. This functionality empowers users to pinpoint the sources of performance degradation and take targeted actions to optimize the runtime behavior and efficiency of web pages.
In addition to performance analysis, the Performance tab provides features for simulating and evaluating the performance of web pages on mobile devices, enabling users to gain insights into the responsiveness and efficiency of web content across different device profiles. By simulating mobile performance, developers can optimize the user experience and responsiveness of web applications, ensuring a seamless and performant experience for mobile users.
In essence, the Performance tab serves as a vital resource within Chrome's Developer Tools, providing developers with a powerful environment for capturing, analyzing, and optimizing the performance of web pages and applications. By harnessing the capabilities of the Performance tab, developers can gain valuable insights into the runtime behavior and efficiency of web content, diagnose and resolve performance issues, and optimize the responsiveness and user experience of web applications.
Memory Tab
The Memory tab within Chrome's Developer Tools is a critical component that provides developers with insights into the memory usage and allocation patterns of web pages and applications. Upon accessing the Memory tab, users are presented with a comprehensive set of functionalities for analyzing memory usage, identifying memory leaks, and optimizing the memory footprint of web content.
At the core of the Memory tab is the capability to capture and analyze memory snapshots, enabling users to gain visibility into the memory allocation and retention of objects within the web page. By initiating a memory snapshot, users can capture a detailed representation of the memory heap at a specific point in time, facilitating the analysis of memory consumption and the identification of potential memory-related issues.
One of the primary functionalities of the Memory tab is the ability to visualize and analyze memory snapshots, including the representation of memory allocation, object retention, and memory distribution within the heap. By examining the memory snapshot, users can identify memory-intensive objects, detect memory leaks, and gain insights into the memory utilization patterns of the web page, enabling them to optimize memory usage and address potential memory-related issues.
Furthermore, the Memory tab offers powerful tools for detecting and diagnosing memory leaks, including the ability to compare memory snapshots and identify objects that are retained in memory unnecessarily. This functionality empowers users to pinpoint memory leaks, understand the root causes of excessive memory consumption, and take corrective actions to optimize the memory footprint of web applications.
In addition to memory analysis, the Memory tab provides features for simulating and evaluating memory usage under different scenarios, enabling users to gain insights into the impact of memory allocation on the performance and stability of web content. By simulating memory usage, developers can optimize memory management strategies, mitigate memory-related issues, and ensure the efficient utilization of memory resources within web applications.
In essence, the Memory tab serves as a vital resource within Chrome's Developer Tools, providing developers with a powerful environment for analyzing, diagnosing, and optimizing memory usage within web pages and applications. By harnessing the capabilities of the Memory tab, developers can gain valuable insights into memory consumption, detect and resolve memory leaks, and optimize the memory efficiency and stability of web applications.
Application Tab
The Application tab within Chrome's Developer Tools is a multifaceted component that offers a comprehensive suite of functionalities for inspecting and managing various aspects of web applications. Upon accessing the Application tab, users are presented with a rich interface that empowers them to explore and interact with resources such as storage, caches, service workers, and more, gaining valuable insights into the inner workings and capabilities of web applications.
At the core of the Application tab is the ability to inspect and manage various types of storage utilized by web applications, including local and session storage, cookies, and IndexedDB. By navigating through the Storage section of the tab, users can view and manipulate the data stored by web applications, gaining visibility into the persistent and temporary storage mechanisms employed by the applications. This functionality enables developers to troubleshoot storage-related issues, manage stored data, and gain insights into the data management strategies of web applications.
One of the primary functionalities of the Application tab is the capability to manage and inspect caches utilized by web applications, including the Cache Storage and Application Cache. By exploring the Caches section of the tab, users can view the contents of cached resources, inspect cache entries, and manage the caching behavior of web applications. This functionality empowers developers to optimize caching strategies, troubleshoot caching issues, and gain insights into the resource caching mechanisms employed by web applications.
Furthermore, the Application tab offers tools for managing and debugging service workers, including the ability to inspect registered service workers, view their associated resources, and analyze their lifecycle and behavior. This functionality is particularly valuable for understanding and troubleshooting the operation of service workers within web applications, providing users with insights into the offline capabilities and background processing features enabled by service workers.
In addition to storage, caching, and service workers, the Application tab provides features for managing and debugging various application-related settings, including manifest files, app icons, and installed web apps. By exploring the Manifest and Installed Apps sections of the tab, users can gain insights into the configuration and installation status of web applications, facilitating the management and optimization of app-related resources and settings.
In essence, the Application tab serves as a vital resource within Chrome's Developer Tools, providing developers with a powerful environment for inspecting, managing, and debugging various aspects of web applications. By harnessing the capabilities of the Application tab, developers can gain valuable insights into the storage, caching, service worker, and application-related features of web applications, troubleshoot and optimize application behavior, and ensure the robustness and reliability of web applications.
Security Tab
The Security tab within Chrome's Developer Tools is a crucial component that provides developers with comprehensive insights into the security aspects of web pages and applications. Upon accessing the Security tab, users are presented with a wealth of information and tools for analyzing, diagnosing, and optimizing the security posture of web content.
At the core of the Security tab is the capability to assess the security status of web pages, including the presence of secure connections, valid SSL certificates, and adherence to secure web standards. By examining the security overview provided in the tab, users can gain insights into the encryption, identity, and security protocols employed by the web page, facilitating the evaluation of its security posture and the identification of potential vulnerabilities.
One of the primary functionalities of the Security tab is the ability to inspect the security properties of connections, including the encryption algorithms, key exchange mechanisms, and certificate details associated with HTTPS connections. By examining the security details of connections, users can verify the strength and integrity of encryption, identify potential security weaknesses, and ensure the secure transmission of sensitive data over the network.
Furthermore, the Security tab offers tools for diagnosing and resolving security issues, including the ability to identify and address mixed content warnings, insecure origins, and insecure resource loading within web pages. This functionality empowers users to pinpoint security vulnerabilities, understand the implications of insecure content, and take corrective actions to enhance the security posture of web applications.
In addition to security analysis, the Security tab provides features for evaluating the security headers and policies implemented by web pages, including Content Security Policy (CSP), HTTP Strict Transport Security (HSTS), and Referrer Policy. By examining the security headers and policies, developers can gain insights into the protective measures and security controls employed by web applications, ensuring the enforcement of secure communication and data handling practices.
In essence, the Security tab serves as a vital resource within Chrome's Developer Tools, providing developers with a powerful environment for analyzing, diagnosing, and optimizing the security of web pages and applications. By harnessing the capabilities of the Security tab, developers can gain valuable insights into the security posture of web content, identify and resolve security vulnerabilities, and ensure the robustness and integrity of web applications from a security standpoint.
Audits Tab
The Audits tab within Chrome's Developer Tools is a powerful and versatile tool that enables developers to conduct comprehensive audits of web pages and applications, evaluating various aspects such as performance, accessibility, SEO, and best practices. Upon accessing the Audits tab, users are presented with a robust set of functionalities for running audits, analyzing audit results, and obtaining actionable recommendations to enhance the overall quality and effectiveness of web content.
At the core of the Audits tab is the capability to perform audits across multiple categories, including performance, accessibility, best practices, SEO, and progressive web app (PWA) features. By initiating an audit, users can leverage the built-in Lighthouse engine to evaluate the web page against a set of predefined metrics and standards, gaining insights into areas for improvement and optimization.
One of the primary functionalities of the Audits tab is the ability to customize audit configurations, allowing users to tailor the audit scope and parameters based on specific requirements and objectives. This flexibility enables developers to focus on specific areas of concern, such as performance optimization, accessibility enhancements, SEO best practices, or PWA compliance, ensuring that audits align with the goals and priorities of the web development project.
Furthermore, the Audits tab offers detailed and actionable recommendations based on audit results, providing users with specific guidance and best practices to address identified issues and improve the overall quality of the web page. By examining the audit report, developers can gain insights into opportunities for performance optimization, accessibility enhancements, SEO improvements, and adherence to web development best practices, empowering them to implement targeted changes and enhancements.
In addition to audit recommendations, the Audits tab provides features for visualizing audit results, including interactive reports that highlight areas of success and areas requiring attention. This visualization capability facilitates the interpretation of audit findings, enabling developers to prioritize and address issues effectively, ultimately leading to the enhancement of the web page's performance, accessibility, SEO, and overall user experience.
In essence, the Audits tab serves as an invaluable resource within Chrome's Developer Tools, providing developers with a comprehensive environment for evaluating and improving the quality and effectiveness of web pages and applications. By harnessing the capabilities of the Audits tab, developers can gain valuable insights into performance, accessibility, SEO, and best practices, obtain actionable recommendations, and drive continuous improvement in the development and optimization of web content.
Lighthouse Tab
The Lighthouse tab within Chrome's Developer Tools is a powerful and comprehensive tool that empowers developers to conduct thorough audits of web pages and applications, focusing on key areas such as performance, accessibility, SEO, best practices, and progressive web app (PWA) features. Upon accessing the Lighthouse tab, users are presented with a robust set of functionalities for running audits, analyzing audit results, and obtaining actionable recommendations to enhance the overall quality and effectiveness of web content.
At the core of the Lighthouse tab is the Lighthouse audit engine, which leverages a set of predefined metrics and standards to evaluate the web page against industry best practices and performance benchmarks. By initiating a Lighthouse audit, developers can gain valuable insights into the performance characteristics, accessibility features, SEO compliance, and adherence to best practices exhibited by the web page. This comprehensive evaluation enables developers to identify areas for improvement and optimization, ultimately leading to the enhancement of the web page's overall quality and user experience.
One of the primary functionalities of the Lighthouse tab is the ability to customize audit configurations, allowing users to tailor the audit scope and parameters based on specific requirements and objectives. This flexibility enables developers to focus on specific areas of concern, such as performance optimization, accessibility enhancements, SEO best practices, or PWA compliance, ensuring that audits align with the goals and priorities of the web development project.
Furthermore, the Lighthouse tab offers detailed and actionable recommendations based on audit results, providing users with specific guidance and best practices to address identified issues and improve the overall quality of the web page. By examining the audit report, developers can gain insights into opportunities for performance optimization, accessibility enhancements, SEO improvements, and adherence to web development best practices, empowering them to implement targeted changes and enhancements.
In addition to audit recommendations, the Lighthouse tab provides features for visualizing audit results, including interactive reports that highlight areas of success and areas requiring attention. This visualization capability facilitates the interpretation of audit findings, enabling developers to prioritize and address issues effectively, ultimately leading to the enhancement of the web page's performance, accessibility, SEO, and overall user experience.
In essence, the Lighthouse tab serves as an invaluable resource within Chrome's Developer Tools, providing developers with a comprehensive environment for evaluating and improving the quality and effectiveness of web pages and applications. By harnessing the capabilities of the Lighthouse tab, developers can gain valuable insights into performance, accessibility, SEO, and best practices, obtain actionable recommendations, and drive continuous improvement in the development and optimization of web content.
Conclusion
In conclusion, Chrome's Developer Tools represent a powerhouse of functionalities that cater to the diverse needs of developers, designers, and anyone seeking to gain insights into the inner workings of web pages and applications. The seamless integration of these tools within the Chrome browser empowers users to inspect, debug, and optimize web content with precision and efficiency.
From the foundational Elements tab, which provides a visual representation of the DOM and CSS styles, to the versatile Console tab, offering a command-line interface for JavaScript interaction, each component of the Developer Tools contributes to a holistic understanding of web technologies. The Sources tab facilitates in-depth analysis and debugging of JavaScript source code, while the Network tab offers comprehensive insights into network activity and performance metrics.
The Performance tab enables developers to capture, analyze, and optimize the runtime behavior of web pages, while the Memory tab provides invaluable tools for diagnosing memory usage and addressing potential memory-related issues. The Application tab offers a comprehensive environment for inspecting and managing various aspects of web applications, including storage, caching, and service workers.
Furthermore, the Security tab equips developers with the means to assess and enhance the security posture of web content, ensuring the robustness and integrity of web applications. The Audits and Lighthouse tabs serve as invaluable resources for evaluating and improving the quality and effectiveness of web pages, providing actionable recommendations to drive continuous improvement in performance, accessibility, SEO, and best practices.
In essence, Chrome's Developer Tools stand as a testament to the commitment to empowering developers and creators with the tools and insights needed to build, optimize, and secure web content. By harnessing the capabilities of these tools, users can elevate their proficiency in web development, streamline the debugging and optimization processes, and ultimately deliver exceptional user experiences across the digital landscape. Whether you're a seasoned developer, a budding designer, or simply curious about the inner workings of the web, Chrome's Developer Tools offer a gateway to a world of possibilities, creativity, and innovation in the realm of web technologies.