Introduction
When it comes to web development, having the right tools at your disposal can make all the difference. One such tool that has revolutionized the way developers work with JavaScript is Chrome DevTools. This powerful set of web authoring and debugging tools, built directly into the Google Chrome browser, provides developers with a wide array of features to inspect, edit, and debug their web applications with ease.
Whether you're a seasoned developer or just starting out, understanding how to edit JavaScript in Chrome using DevTools can significantly streamline your development process. From making quick tweaks to debugging complex issues, Chrome DevTools offers a seamless environment for editing JavaScript code directly within the browser.
In this article, we'll delve into the various methods for editing JavaScript in Chrome, exploring the features and functionalities of Chrome DevTools that empower developers to modify and experiment with their JavaScript code effortlessly. By the end of this guide, you'll have a comprehensive understanding of how to harness the full potential of Chrome DevTools to edit JavaScript and enhance your web development workflow. So, let's dive in and uncover the capabilities of Chrome DevTools for editing JavaScript!
Opening Chrome DevTools
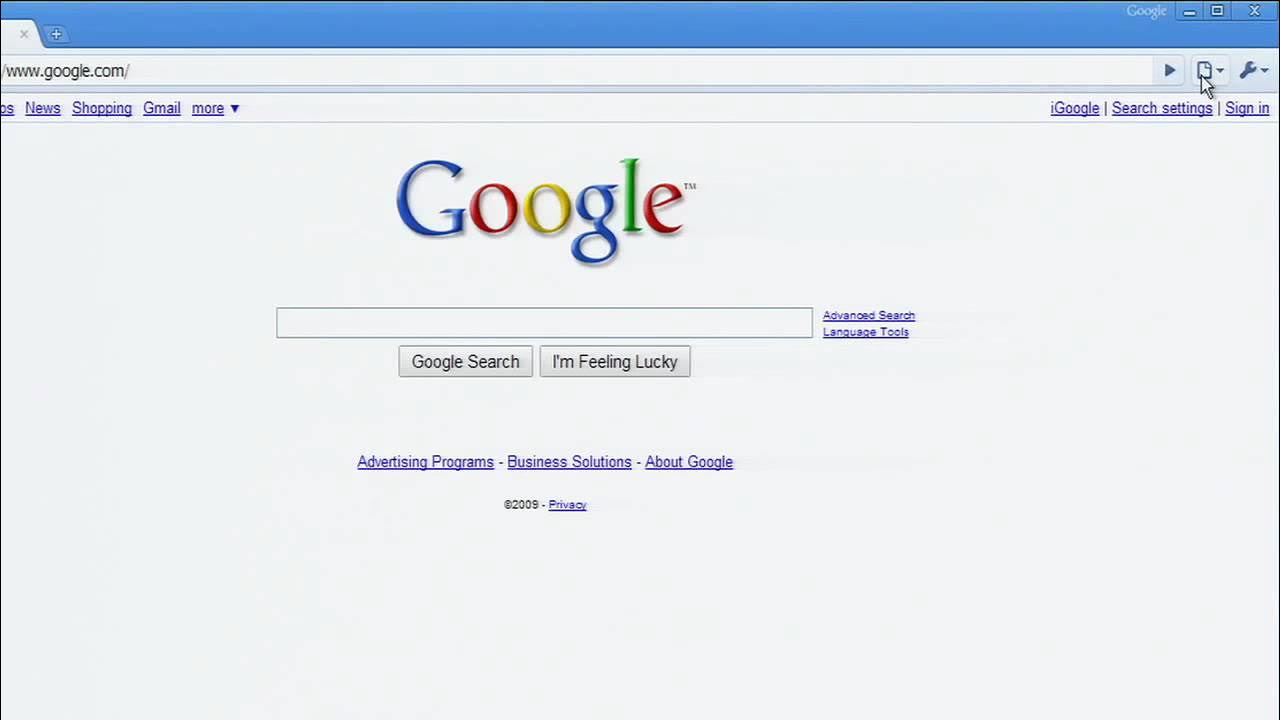
Opening Chrome DevTools is the first step towards unlocking a world of powerful web development capabilities. To access Chrome DevTools, simply right-click on any element within a web page and select "Inspect" from the context menu. Alternatively, you can use the keyboard shortcut Ctrl + Shift + I (Windows/Linux) or Cmd + Option + I (Mac) to open DevTools directly.
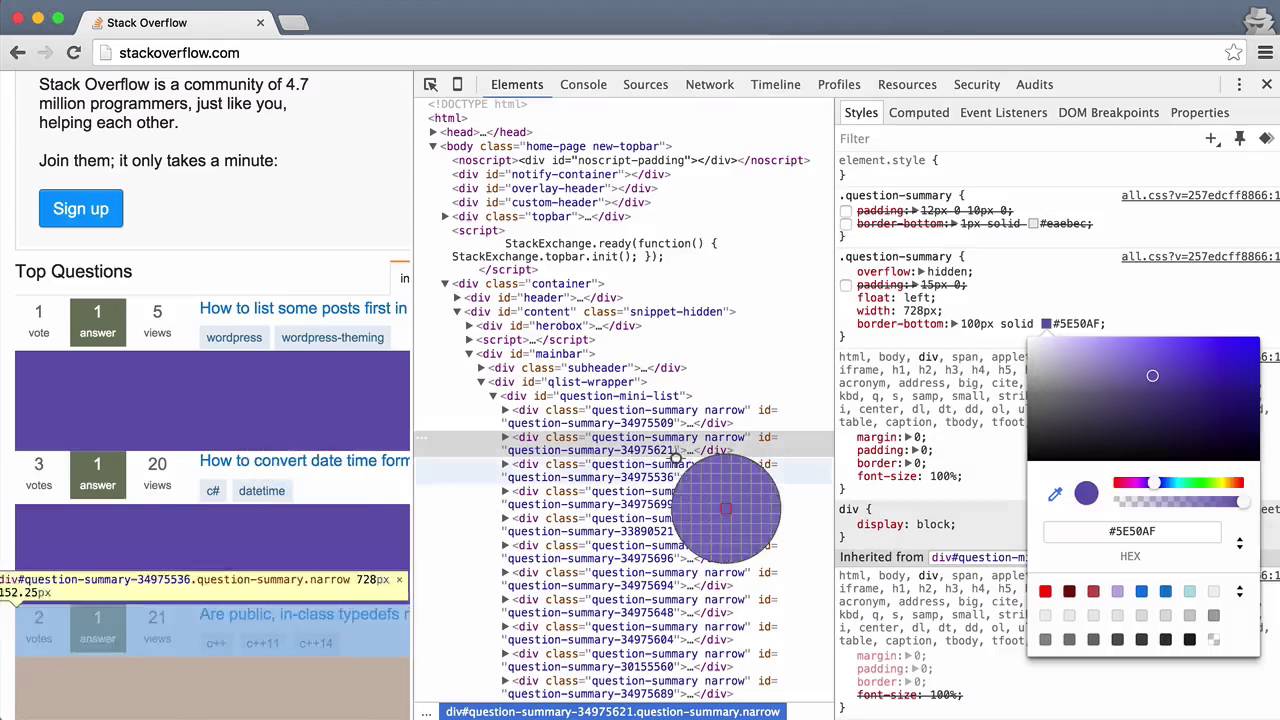
Upon opening DevTools, you'll be greeted with a comprehensive suite of tools neatly organized into different panels, each serving a specific purpose. The main interface is divided into several sections, including the Elements panel for inspecting and editing HTML and CSS, the Console for executing JavaScript code and logging messages, the Sources panel for debugging and editing JavaScript, and more.
The Sources panel is particularly crucial for editing JavaScript within Chrome DevTools. It provides a user-friendly interface for viewing and modifying JavaScript source files, setting breakpoints, and stepping through code execution. Additionally, the panel offers advanced features such as live editing, allowing developers to make real-time changes to their JavaScript code and see the effects instantly.
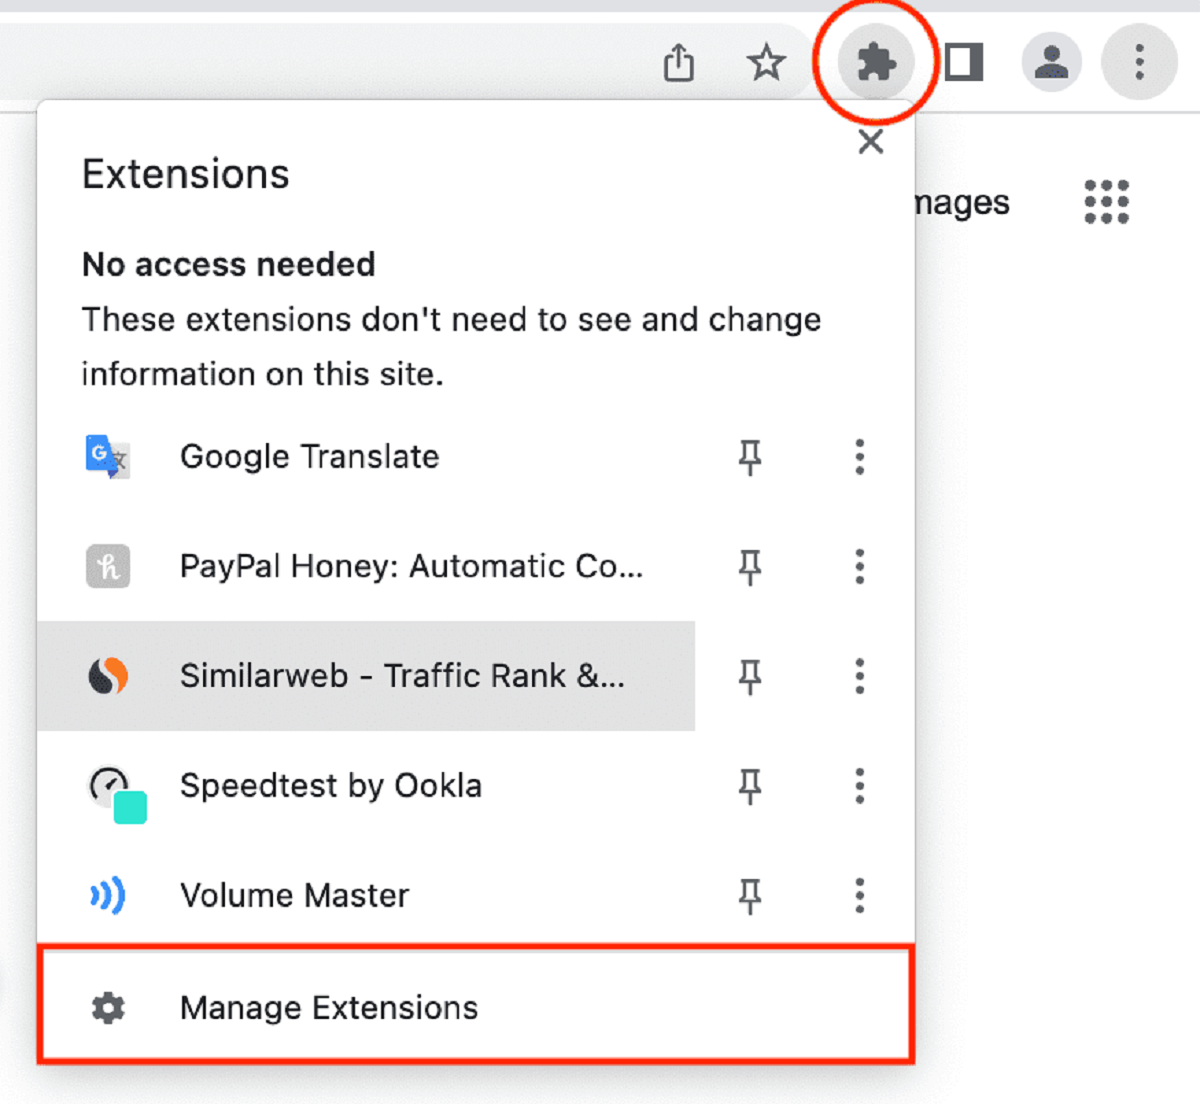
In addition to the traditional method of opening DevTools, Chrome also offers a variety of ways to access the developer tools, catering to different preferences and workflows. For instance, you can open DevTools from the Chrome menu by navigating to "More Tools" and selecting "Developer Tools." Furthermore, you can customize the DevTools window layout, dock it to the right or bottom of the browser window, or even detach it into a separate window for a more flexible development experience.
By familiarizing yourself with the various methods of opening and customizing Chrome DevTools, you can seamlessly integrate this indispensable tool into your web development workflow. Whether you're inspecting elements, debugging JavaScript, or fine-tuning CSS styles, Chrome DevTools provides a rich set of functionalities to empower developers and elevate the web development experience.
In the next sections, we'll explore how to leverage Chrome DevTools to edit JavaScript, from making quick changes in the Sources panel to utilizing the Console for interactive JavaScript editing. Let's continue our journey into the world of Chrome DevTools and uncover the art of editing JavaScript directly within the browser!
Editing JavaScript in the Sources Panel
The Sources panel in Chrome DevTools serves as a central hub for debugging and editing JavaScript code directly within the browser. This powerful feature empowers developers to inspect, modify, and debug JavaScript source files with ease, offering a seamless environment for enhancing and fine-tuning web applications.
Upon navigating to the Sources panel within Chrome DevTools, you'll be presented with a hierarchical view of the JavaScript files associated with the current web page. This intuitive interface allows you to explore the structure of the JavaScript codebase, making it effortless to locate and edit specific files.
To edit a JavaScript file in the Sources panel, simply click on the file name to open it in the code editor. Here, you can view the entire contents of the JavaScript file, including functions, variables, and other code elements. The code editor provides essential functionalities such as syntax highlighting, code folding, and line numbering, enhancing the readability and navigability of the JavaScript code.
One of the standout features of the Sources panel is its support for live editing, enabling developers to make real-time changes to the JavaScript code and witness the immediate impact on the web page. Whether it's tweaking a function, updating a variable, or experimenting with new logic, the live editing capability in Chrome DevTools streamlines the process of iterating and refining JavaScript code.
In addition to live editing, the Sources panel offers robust debugging features, including breakpoints, watch expressions, and call stack navigation. Setting breakpoints within the JavaScript code allows you to pause the execution at specific points, inspect the current state of variables, and step through the code to identify and resolve issues effectively.
Furthermore, the Sources panel provides seamless integration with version control systems, allowing you to work with JavaScript files from Git repositories directly within Chrome DevTools. This integration streamlines the development workflow, enabling you to edit, stage, and commit changes to JavaScript files without leaving the browser environment.
By leveraging the powerful capabilities of the Sources panel in Chrome DevTools, developers can elevate their JavaScript editing experience, from making quick adjustments to debugging intricate code scenarios. The seamless integration of live editing, debugging tools, and version control support empowers developers to iterate and refine JavaScript code directly within the browser, fostering a more efficient and productive web development process.
Using the Console to Edit JavaScript
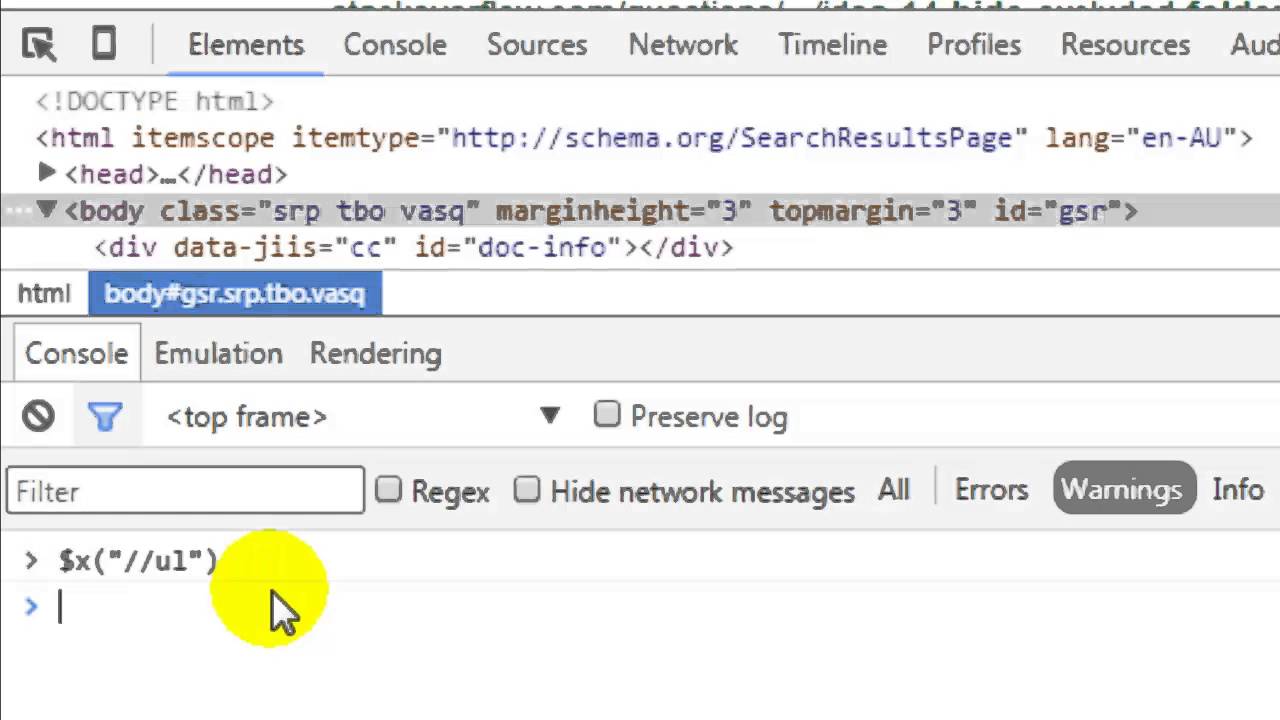
The Console in Chrome DevTools serves as a versatile environment for executing JavaScript code, logging messages, and interacting with web pages in real time. While it's commonly known for its debugging and logging capabilities, the Console also offers a powerful feature that allows developers to edit JavaScript code directly within the browser environment.
When it comes to editing JavaScript using the Console, developers can leverage the interactive nature of this tool to experiment with code snippets, modify variables, and execute custom functions on the fly. This dynamic approach to JavaScript editing provides a quick and efficient way to test and refine code logic without the need to navigate to external text editors or development environments.
To edit JavaScript using the Console, developers can simply access the Console panel within Chrome DevTools and start typing JavaScript code directly into the command line. Whether it's defining new variables, manipulating existing objects, or invoking functions, the Console provides an interactive playground for making real-time changes to JavaScript code.
One of the key advantages of using the Console for JavaScript editing is the immediate feedback it offers. As developers input and execute JavaScript code snippets, they can instantly observe the results and behavior of the code within the context of the web page. This real-time feedback loop facilitates rapid experimentation and iteration, allowing developers to fine-tune JavaScript logic with precision.
Furthermore, the Console supports multi-line input, enabling developers to write and execute more complex JavaScript code blocks seamlessly. This capability is particularly valuable when working on intricate JavaScript logic or testing out custom algorithms, as it provides a convenient space to craft and refine code snippets directly within the browser environment.
In addition to editing JavaScript code, the Console also allows developers to interact with the Document Object Model (DOM) of the web page, manipulate CSS styles, and access various browser APIs. This broad spectrum of functionalities makes the Console a versatile tool for not only editing JavaScript but also for exploring and experimenting with different aspects of web development.
By harnessing the interactive and dynamic nature of the Console in Chrome DevTools, developers can elevate their JavaScript editing experience, fostering a more agile and exploratory approach to code refinement. Whether it's prototyping new features, troubleshooting complex logic, or simply experimenting with JavaScript concepts, the Console provides a flexible and responsive environment for editing JavaScript directly within the browser, empowering developers to iterate and refine their code with ease.
Saving Changes in Chrome DevTools
Once you've made modifications to your JavaScript code using Chrome DevTools, it's essential to understand how to save these changes effectively. While DevTools provides a seamless environment for editing JavaScript directly within the browser, it's important to ensure that your changes are preserved for future use or testing. Fortunately, Chrome DevTools offers multiple methods for saving JavaScript modifications, empowering developers to capture their edits and integrate them into their web development workflow.
One of the primary ways to save changes in Chrome DevTools is through the Sources panel. After making edits to a JavaScript file, you can simply right-click within the code editor and select the "Save" option. This action commits your modifications, ensuring that the updated JavaScript code is preserved and ready for use. Additionally, the Sources panel provides keyboard shortcuts for saving changes, offering a quick and convenient way to capture your edits without interrupting your workflow.
In addition to manual saving, Chrome DevTools also supports automatic detection of changes made to JavaScript files. As you modify the code within the Sources panel, DevTools actively monitors these changes and prompts you to save them when navigating away from the edited file. This intelligent feature serves as a safeguard, preventing accidental loss of modifications and promoting a seamless editing experience.
Furthermore, Chrome DevTools seamlessly integrates with version control systems, allowing developers to leverage Git and other source control platforms directly within the browser environment. By connecting DevTools to a version control repository, you can stage and commit your JavaScript changes, ensuring that they are tracked and managed within the context of your project's version history.
It's important to note that while Chrome DevTools provides robust capabilities for saving JavaScript changes, it's always advisable to maintain a backup of your original code and follow best practices for version control. By combining the power of DevTools with established version control workflows, developers can confidently edit, save, and manage JavaScript code within the browser, fostering a more efficient and organized development process.
In summary, Chrome DevTools offers a range of methods for saving JavaScript changes, from manual saving within the Sources panel to automatic change detection and seamless integration with version control systems. By mastering these saving techniques, developers can ensure that their JavaScript edits are captured, preserved, and seamlessly integrated into their web development projects, ultimately enhancing their productivity and code management practices.