
Introduction
Welcome to this comprehensive guide on how to inspect elements on a Chromebook! Whether you’re a web developer, designer, or just curious about how websites are built, understanding how to inspect and modify elements using the Inspect Element tool is a valuable skill.
Inspect Element is a powerful web development tool that is built into the Google Chrome browser. It allows you to view and modify the HTML, CSS, and JavaScript code of a webpage and analyze its network activity. This tool is particularly useful for debugging, troubleshooting, and learning how different web elements interact with each other.
With the rise of Chromebooks as popular lightweight devices, it’s important to know how to take full advantage of their capabilities, including web development tasks. While Chromebooks may have some limitations compared to traditional desktops, you can still use Inspect Element to inspect, modify, and test web elements on the Chrome OS.
In this guide, we’ll walk you through the step-by-step process of opening the Inspect Element tool on your Chromebook, understanding its window layout, and utilizing its various tools and features. We’ll also cover how to inspect and modify HTML elements, modify CSS styles, test JavaScript code, and analyze network traffic.
Whether you’re a seasoned web developer or just starting your journey in web development, mastering the art of using Inspect Element on Chromebook will greatly enhance your ability to understand and manipulate web elements. So let’s dive in and explore the world of Inspect Element on Chromebook!
What is Inspect Element?
Inspect Element is a powerful web development feature that is built into the Google Chrome browser. It allows you to view and modify the underlying HTML, CSS, and JavaScript code of a webpage, giving you a detailed insight into how a webpage is structured and how different elements are styled.
When you “inspect” an element on a webpage, you are essentially peering behind the scenes to see the code that powers it. This can be incredibly useful for web developers, designers, and anyone who wants to learn more about how websites are constructed.
The Inspect Element feature provides a window into the Document Object Model (DOM) of a webpage. The DOM is a representation of the structure of a webpage, organized in a hierarchical tree-like structure. Each element on a webpage, such as headings, paragraphs, images, buttons, and links, is represented as a node in the DOM tree.
By right-clicking on any element on a webpage and selecting the “Inspect” option, or by using keyboard shortcuts, you can open the Inspect Element tool. This tool opens a separate panel that displays the HTML code for the selected element and provides a variety of tools and features to examine and manipulate it.
Inspect Element is not only useful for inspecting the structure of a webpage but also for troubleshooting and debugging. If you encounter an issue with the layout or functionality of a webpage, you can use Inspect Element to identify the problem area and make changes within the tool to see the immediate impact on the webpage.
Furthermore, Inspect Element lets you test and experiment with different CSS styles and JavaScript code. You can modify the styles of elements in real-time and see the results instantly, allowing you to fine-tune the visual appearance of a webpage. You can also interact with and test JavaScript code to understand how it affects the behavior of web elements.
In summary, Inspect Element is a valuable tool for developers and designers, empowering them to delve into the inner workings of webpages. It provides a visual representation of the DOM, allows for real-time modifications, and aids in troubleshooting and experimentation. So let’s continue our journey and learn how to open Inspect Element on your Chromebook!
How to Open Inspect Element on Chromebook
Opening the Inspect Element tool on your Chromebook is a straightforward process. There are a few different methods you can use to access it:
- Method 1: Right-click on an element
- Method 2: Keyboard shortcuts
- Method 3: Chrome Developer Tools
The simplest way to open Inspect Element is by right-clicking on any element on a webpage. This could be an image, text, button, or any other visible element. Once you right-click, a context menu will appear. From there, select the “Inspect” option. The Inspect Element panel will open, displaying the HTML code and other relevant information for the selected element.
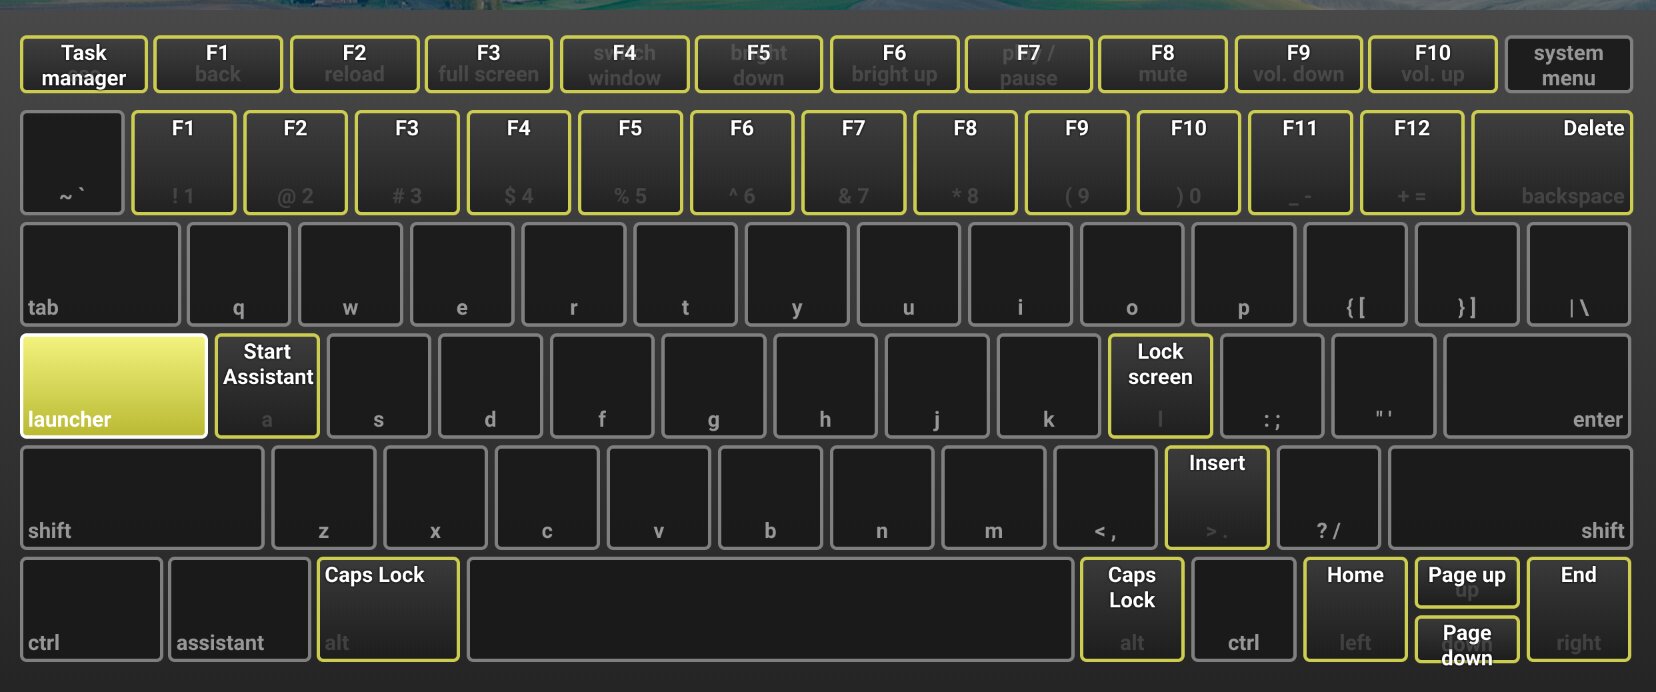
Chromebooks have built-in keyboard shortcuts that allow you to quickly access the Inspect Element tool. Pressing Ctrl + Shift + I will open the Inspect Element panel directly. You can also use the F12 key as a shortcut, as it functions the same as Ctrl + Shift + I.
If you prefer a more comprehensive view of web development tools, you can access Inspect Element through the Chrome Developer Tools. To open the Developer Tools, click on the three-dot menu icon located in the top-right corner of the Chrome browser window. From the dropdown menu, navigate to “More tools” and then select “Developer tools”. This will open a panel with a wide range of developer tools, including the Inspect Element feature. You can also use the keyboard shortcut Ctrl + Shift + J to directly open the Chrome Developer Tools.
Once you’ve successfully opened the Inspect Element tool on your Chromebook, you’ll be greeted with a window divided into different sections. These sections include the HTML structure, CSS styles, JavaScript code, and network activity, among others. Understanding how to navigate and utilize these sections is essential to effectively inspect and modify web elements, which we will explore further in the following sections.
Now that you know how to open the Inspect Element tool on your Chromebook, let’s continue our journey by understanding the layout and functionality of the Inspect Element window!
Understanding the Inspect Element Window
When you open the Inspect Element tool on your Chromebook, you’ll be presented with a window that provides a comprehensive view of the webpage’s structure and code. Understanding the different sections and functionality within this window will enable you to effectively inspect and modify web elements. Let’s explore the various components of the Inspect Element window:
- Elements Panel: The Elements panel, also known as the HTML panel, displays the hierarchical structure of the webpage’s HTML code. Each element is represented as a node in a tree-like structure, allowing you to navigate and examine the HTML elements. You can expand and collapse elements to explore their child elements.
- Styles Panel: The Styles panel provides information about the CSS styles applied to a selected HTML element. Here, you can view and modify the element’s styles, including properties such as color, font-size, margins, and more. You can also add new styles or override existing ones.
- Console Panel: The Console panel is a command-line interface that allows you to interact with the webpage using JavaScript. You can test and execute JavaScript code here, retrieve logged information, and debug any errors or issues. It’s a powerful tool for experimenting with and analyzing JavaScript functionality.
- Sources Panel: The Sources panel provides access to the webpage’s underlying JavaScript, CSS, and HTML files. You can view, edit, and debug these files directly within the panel. This is especially useful for in-depth troubleshooting and modification of your web code.
- Network Panel: The Network panel displays the network activity associated with loading the webpage. You can see the requests made to servers, the response status codes, and various network details. This panel helps identify any issues related to loading resources, server errors, or network latency.
- Application Panel: The Application panel gives you access to various application-related information, such as cookies, local storage, cache, and more. You can inspect and modify these aspects of the webpage, allowing you to fine-tune application behavior and troubleshoot storage-related issues.
By familiarizing yourself with the different panels in the Inspect Element window, you’ll have a solid foundation for inspecting and modifying web elements on your Chromebook. Each panel serves a specific purpose and provides powerful tools for web development tasks. Now that you understand the layout, let’s dive deeper into exploring the individual tools and features available within the Inspect Element window.
Inspect Element Tools and Features
The Inspect Element tool on your Chromebook comes equipped with a variety of useful tools and features that allow you to effectively inspect, modify, and debug web elements. Let’s explore some of the key tools and features available within the Inspect Element window:
- Element Selection: With the Inspect Element tool, you can easily select and inspect specific elements on a webpage. By hovering over an element in the Elements panel or directly on the webpage, you can locate and highlight the corresponding HTML code in the panel. This enables you to analyze the selected element and its related properties.
- Live Editing: Inspect Element allows you to make live edits to HTML and CSS code. By double-clicking on specific HTML attributes or CSS properties, you can modify their values directly in the Elements or Styles panel. This live editing capability is particularly valuable for experimenting with different styles or troubleshooting layout issues.
- Property Filtering: In the Styles panel, you can filter properties based on various criteria. This enables you to quickly identify specific properties and their corresponding values, making it easier to locate and modify specific elements or styles.
- Responsive Design Mode: Inspect Element includes a responsive design mode that allows you to simulate different device sizes and resolutions. With this feature, you can test how your webpage responds and adapts to different screen sizes, ensuring an optimal user experience across various devices.
- DOM Manipulation: Inspect Element enables you to manipulate the DOM of a webpage. You can add, remove, or modify HTML elements, as well as rearrange their positions within the structure. This feature allows you to experiment with different layouts and see the immediate effect on the webpage.
- JavaScript Debugger: The Console panel within Inspect Element includes a powerful JavaScript debugger. You can set breakpoints, step through code, and analyze variables and their values during runtime. This debugging capability helps identify and resolve issues related to JavaScript functionality.
- Network Analysis: The Network panel provides detailed information about the network activity associated with loading the webpage. You can analyze requests, view response headers, and perform network throttling to simulate different network conditions. This helps identify performance issues, server errors, or slow-loading resources.
- Source Mapping: Inspect Element supports source mapping, which allows you to correlate the minified or compiled code with your original source code. This is especially useful when debugging JavaScript or inspecting CSS styles, as it provides a clearer understanding of the code structure.
These tools and features within the Inspect Element window offer immense value for web development and debugging tasks. By utilizing them effectively, you can gain a deeper understanding of your web elements, identify and resolve issues efficiently, and fine-tune the appearance and functionality of your webpages.
Now that you’re familiar with the different tools and features of Inspect Element, let’s move on to exploring how you can inspect and modify HTML elements within the Inspect Element window on your Chromebook!
Inspecting and Modifying HTML Elements
The Inspect Element tool on your Chromebook allows you to easily inspect and modify HTML elements within a webpage. This functionality is particularly useful for understanding how the elements are structured and making necessary changes for troubleshooting or customization purposes. Let’s explore how you can inspect and modify HTML elements using Inspect Element:
Inspecting Elements:
With Inspect Element, you can select and inspect specific HTML elements on a webpage. By hovering over an element in the Elements panel or directly on the webpage, the corresponding HTML code will be highlighted, allowing you to examine its structure and associated attributes. You can expand and collapse elements to explore their child elements, gaining a deeper understanding of the webpage’s HTML structure.
Modifying Elements:
Inspect Element allows you to make live modifications to HTML elements. By double-clicking on an HTML attribute within the Elements panel, you can edit its value and see the changes reflect directly on the webpage. This feature is particularly helpful for experimenting with different attribute values or quickly fixing layout issues. You can also add or remove elements by right-clicking and selecting the appropriate options.
Element Styles:
Inspect Element provides access to the CSS styles applied to HTML elements. By selecting an element in the Elements panel, you can navigate to the Styles panel to view its associated styles. Here, you can see the applied styles, including properties such as color, font-size, margins, and more. You can modify existing styles or add new styles to customize the appearance of the selected element.
Computed Styles:
In the Styles panel, Inspect Element also displays the computed styles for the selected HTML element. Computed styles are the final styles applied after considering inheritance, overrides, and other factors. This information is useful for understanding how different CSS rules are affecting the appearance of an element. You can also modify computed styles to experiment with different visual effects.
Element Hierarchy:
Inspect Element helps you analyze the hierarchy and relationships between HTML elements. By expanding and collapsing elements in the Elements panel, you can visualize how elements are nested and structured within the webpage. This understanding is essential for identifying the parent-child relationships and reorganizing elements if required.
Element Attributes:
Inspect Element provides a detailed view of the attributes associated with HTML elements. By selecting an element in the Elements panel, you can inspect and modify attributes such as class, id, data attributes, and more. Understanding and manipulating these attributes allows you to control element behavior and customize functionality.
By leveraging these features of Inspect Element, you can effectively inspect and modify HTML elements within a webpage. Whether you are troubleshooting layout issues, customizing the appearance of web elements, or understanding the structure of a page, Inspect Element is a powerful tool at your disposal.
Now that you’re familiar with inspecting and modifying HTML elements, let’s move on to exploring how you can modify CSS styles within the Inspect Element window on your Chromebook!
Modifying CSS Styles in Inspect Element
Inspect Element on your Chromebook allows you to easily modify CSS styles applied to HTML elements within a webpage. This feature is particularly beneficial for customizing the appearance of web elements or troubleshooting styling issues. Let’s explore how you can modify CSS styles using the Inspect Element tool:
Selecting Elements:
To modify CSS styles, start by selecting the HTML element in the Elements panel that you wish to modify. As you select the element, the associated CSS styles will be displayed in the Styles panel, allowing you to view and edit them.
Adding and Modifying Styles:
In the Styles panel, you can add, edit, or override existing CSS styles. By double-clicking on a specific style property, you can modify its value. This change will be instantly applied to the selected element on the webpage. Additionally, you can add new styles by clicking on the ‘+’ icon or overriding existing styles by directly typing in the CSS properties and values.
Property Suggestions:
As you type CSS properties and values in the Styles panel, Inspect Element provides suggestions based on valid CSS syntax. These suggestions help ensure accuracy and speed up the styling process, especially if you’re not familiar with all the available CSS properties off the top of your head.
Box Model Adjustment:
The Styles panel within Inspect Element also allows you to adjust the box model properties such as margin, padding, and border. By modifying these properties, you can alter the spacing, alignment, and overall size of HTML elements.
Live Preview:
One of the key advantages of using Inspect Element is the ability to see live changes in real-time. As you modify CSS styles, the selected HTML element on the webpage will instantly reflect the updated styles. This immediate feedback allows you to experiment and fine-tune the appearance until you achieve the desired visual effect.
Note:
It is important to note that any changes made using Inspect Element are only temporary and will not persist when you refresh the webpage. If you want to make permanent changes to your CSS, it’s recommended to do so in your actual CSS file.
By utilizing the CSS editing capabilities of Inspect Element, you can have fine-grained control over the visual appearance of HTML elements on a webpage. Whether it’s adjusting colors, fonts, margins, or even applying animations and transitions, Inspect Element provides a powerful toolset for modifying CSS styles and creating a customized web experience.
Now that you know how to modify CSS styles using Inspect Element, let’s move on to exploring how you can inspect and test JavaScript code within the Inspect Element window on your Chromebook!
Inspecting and Testing JavaScript in Inspect Element
The Inspect Element tool on your Chromebook not only allows you to inspect and modify HTML and CSS, but it also provides powerful capabilities for inspecting and testing JavaScript code within a webpage. Whether you’re debugging JavaScript errors or experimenting with interactive functionality, Inspect Element gives you the tools you need. Let’s explore how you can inspect and test JavaScript using the Inspect Element tool:
Console Interaction:
Inspect Element includes a Console panel that allows you to interact with the webpage’s JavaScript code. You can execute JavaScript commands, test functions, and retrieve logged information directly in the console. This feature is invaluable for experimenting with code snippets and validating JavaScript functionality.
Debugging JavaScript:
The Console panel within Inspect Element doubles as a JavaScript debugger. You can set breakpoints in your JavaScript code, pause the execution, and step through the code line-by-line. This debugging feature helps identify and fix errors, evaluate variables and their values, and get a deeper understanding of the JavaScript code’s flow.
Error Logging:
The Console panel also captures JavaScript errors and logs them for easy identification. By inspecting the error messages, stack traces, and related information, you can pinpoint the source of the error and troubleshoot the JavaScript code accordingly.
Code Tracing:
Inspect Element allows you to trace specific JavaScript functions and monitor their execution flow. By using the `console.trace()` method within your code or directly in the console, you can track how functions are being invoked and see the call stack, helping you understand the overall execution path of your JavaScript code.
Variable Inspection:
You can also examine and inspect the values of JavaScript variables within the Console panel. By simply typing the variable name, you can view its value, type, and any associated properties or methods. This feature is particularly helpful for understanding how variables are being used and manipulated during runtime.
Live Editing:
Inspect Element allows you to live-edit JavaScript code within the Console panel. You can modify variables, reassign values, and even add new JavaScript code snippets to test their impact in real-time. This capability is useful when you want to experiment with code changes and observe their immediate effects.
With these powerful JavaScript inspection and testing features, Inspect Element empowers you to dig deeper into the functionality and behavior of webpages. Whether you’re troubleshooting JavaScript errors, testing functions, or experimenting with different code snippets, Inspect Element provides a comprehensive toolkit for JavaScript development and debugging.
Now that you know how to inspect and test JavaScript using Inspect Element, let’s move on to exploring how you can analyze network traffic within the Inspect Element window on your Chromebook!
Analyzing Network Traffic in Inspect Element
The Inspect Element tool on your Chromebook provides a powerful feature that allows you to analyze network traffic and gain insights into how a webpage interacts with servers to load resources. This capability is helpful for troubleshooting slow-loading pages, identifying network-related issues, and optimizing website performance. Let’s explore how you can analyze network traffic using the Inspect Element tool:
Network Requests:
The Inspect Element window includes a Network panel that displays all the network requests made by the webpage. These requests include fetching HTML, CSS, JavaScript files, images, API calls, and more. By analyzing the requests in chronological order, you can understand the sequence in which resources are loaded and identify any delays or errors.
Request Details:
For each network request, the Network panel provides detailed information such as the request URL, request method (GET, POST, etc.), response status code, and response headers. These details help you identify issues like broken links, incorrect URLs, and server errors that may cause problems with loading resources.
Response Preview:
The Network panel allows you to preview the responses received for each network request. You can view the content of HTML, CSS, JavaScript files, or images directly within the panel. This feature enables you to quickly inspect the response data and verify if the resource is loaded correctly.
Timing Analysis:
Inspect Element provides a detailed timeline that displays the timings of each network request, including the DNS lookup time, connection time, request and response times, and more. This timeline allows you to pinpoint any bottlenecks or delays in the loading process, helping you identify areas for optimization.
Network Throttling:
You can simulate different network conditions within the Network panel by using the network throttling feature. This feature allows you to test the webpage’s performance under various network speeds such as 3G, 4G, or custom bandwidth settings. Simulating different network conditions helps identify how the webpage behaves in real-world scenarios and enables performance optimization.
Resource Analysis:
Within the Network panel, you can filter and analyze specific types of resources (e.g., images, scripts) using the resource type filters. This helps you understand the composition of the webpage in terms of resource types, their sizes, and loading times.
Request Headers:
The Network panel provides access to the request headers sent during each network request. You can inspect and modify the request headers to simulate different user agents, languages, or custom headers. This can be helpful when debugging issues related to specific headers or server-side behavior.
By leveraging the network analysis capabilities of Inspect Element, you can gain valuable insights into how your webpage interacts with servers, troubleshoot loading issues, and optimize the performance of your website. Understanding the network traffic helps ensure a smooth and efficient browsing experience for your users.
Now that you know how to analyze network traffic using Inspect Element, let’s move on to exploring some tips and tricks for using Inspect Element effectively on your Chromebook!
Tips and Tricks for Using Inspect Element on Chromebook
As you delve into the world of web development and utilize the Inspect Element tool on your Chromebook, here are some helpful tips and tricks to enhance your experience and maximize your productivity:
1. Keyboard Shortcuts: Familiarize yourself with essential keyboard shortcuts for quick access to Inspect Element. For example, use Ctrl + Shift + I to open Inspect Element directly or F12 as a shortcut for the same command. Additionally, learn other useful shortcuts within the tool, such as Ctrl + L to focus on the search bar.
2. Docking the DevTools: Optimize your workspace by docking the DevTools panel to the side or the bottom of the browser window. This way, you can have a larger viewport for testing and debugging while having the Inspect Element tool readily accessible.
3. Preserve Log: Enable the “Preserve log” option in the Console panel to persist log messages even when navigating between different pages or performing page reloads. This is useful for maintaining a history of logs and errors for debugging purposes.
4. Use the $0 Selector: In the Console panel, you can reference the currently selected element in the Elements panel using the special selector $0. This allows you to interactively work with the selected element and perform operations or retrieve information directly in the console.
5. Emulate Mobile Devices: Inspect Element allows you to emulate various mobile devices and test how your webpage appears and behaves on different screen sizes. Use the “Toggle device toolbar” button or the shortcut Ctrl + Shift + M to enter the responsive design mode.
6. Use the Command Menu: Access the Command Menu within the Inspect Element tool by pressing Ctrl + Shift + P. This menu allows you to quickly access various features and commands, making it easier to navigate and perform actions within Inspect Element.
7. Save Changes Locally: Experiment with CSS modifications and JavaScript code without affecting the live webpage by using the “Local modifications” feature. This allows you to make temporary changes and save them locally, helping you test and iterate on your code before implementing permanent changes.
8. Regularly Clear Console Logs: To keep the Console panel clutter-free, periodically clear the console logs using the “Clear console” button or the shortcut Ctrl + L. This ensures a clean environment for debugging and helps prevent confusion from old log messages.
9. Read Documentation and Tutorials: Inspect Element is a powerful tool with numerous features. To fully utilize its capabilities, invest time in exploring official documentation, tutorials, and online resources. This will deepen your understanding of the tool and help you discover advanced techniques and workflows.
10. Practice and Experiment: The best way to become proficient in using Inspect Element is by practicing and experimenting with different elements, styles, and code snippets. Don’t be afraid to make modifications, test new ideas, and delve into the various tools and features available. With time and hands-on experience, you’ll become more proficient and efficient in utilizing Inspect Element to its maximum potential.
By following these tips and tricks, you can unlock the full potential of Inspect Element on your Chromebook. From improving your efficiency to deepening your understanding of web development, Inspect Element will become an invaluable tool in your toolkit.
Now that you have a solid grasp on utilizing Inspect Element effectively let’s wrap up our guide on inspecting elements on a Chromebook!
Conclusion
Inspect Element on your Chromebook is a powerful tool that empowers you to analyze, modify, and debug web elements with ease. By understanding how to open Inspect Element, navigate its window layout, and utilize its various tools and features, you can gain valuable insights into the structure, styling, and functionality of webpages. Whether you’re a web developer, designer, or simply curious about how websites are built, Inspect Element is a valuable asset in your web development arsenal.
Through this comprehensive guide, we’ve covered the essential aspects of using Inspect Element on your Chromebook. We explored how to open Inspect Element using right-click, keyboard shortcuts, or through the Chrome Developer Tools. We also delved into understanding the Inspect Element window, including its different panels like Elements, Styles, Console, Sources, Network, and Application. Additionally, we discussed how to inspect and modify HTML elements, modify CSS styles, test and debug JavaScript code, and analyze network traffic using the Inspect Element tool.
To enhance your experience with Inspect Element, we provided tips and tricks for utilizing keyboard shortcuts, docking the DevTools, preserving logs, emulating mobile devices, and more. Investing time in familiarizing yourself with these techniques will help you become more proficient and efficient in inspecting and modifying web elements.
Remember, practicing and experimenting are key to becoming proficient in using Inspect Element. By continuously honing your skills and gaining hands-on experience, you’ll be able to leverage this powerful tool to its maximum potential.
Now that you have a solid understanding of how to inspect elements on a Chromebook using Inspect Element, I encourage you to explore further, refer to official documentation, and continue learning about web development. Whether you’re fine-tuning the appearance of a website, debugging JavaScript issues, or optimizing performance, Inspect Element will be your partner in achieving your development goals.
So, go ahead, dive into the world of web development, and make the most out of Inspect Element on your Chromebook! Happy inspecting!


![How to Turn On Developer Mode on Chromebook [Step-by-step Guide]](https://robots.net/wp-content/uploads/2020/09/chrome-os-developer-mode-1-300x200.jpg)