Introduction
Chromebooks have gained popularity in recent years due to their simplicity, affordability, and ease of use. These lightweight laptops run on Chrome OS, a minimalist operating system developed by Google. While Chromebooks offer a streamlined user experience, they also provide powerful tools for developers. One such tool is the ability to access the developer console using the F12 key.
In this article, we will explore how to press the F12 key on a Chromebook and how to leverage its functionality to enhance web development. Whether you are a seasoned developer or just starting out, understanding how to utilize the F12 key can greatly improve your productivity.
From inspecting and modifying web page elements to debugging JavaScript code, the F12 key opens up a world of possibilities for developers. By learning how to access the developer console and navigate its various features, you can efficiently troubleshoot issues, fine-tune CSS styles, and optimize the performance of your web applications.
Throughout this article, we will guide you step-by-step on how to locate the F12 key on your Chromebook and demonstrate its usage in different scenarios. So, let’s dive in and discover the power of the F12 key on a Chromebook!
Understanding the Chromebook Keyboard
Before we delve into using the F12 key on a Chromebook, it’s important to have a basic understanding of the Chromebook keyboard layout. While it may differ slightly from traditional keyboards, the Chromebook keyboard is designed to be intuitive and user-friendly.
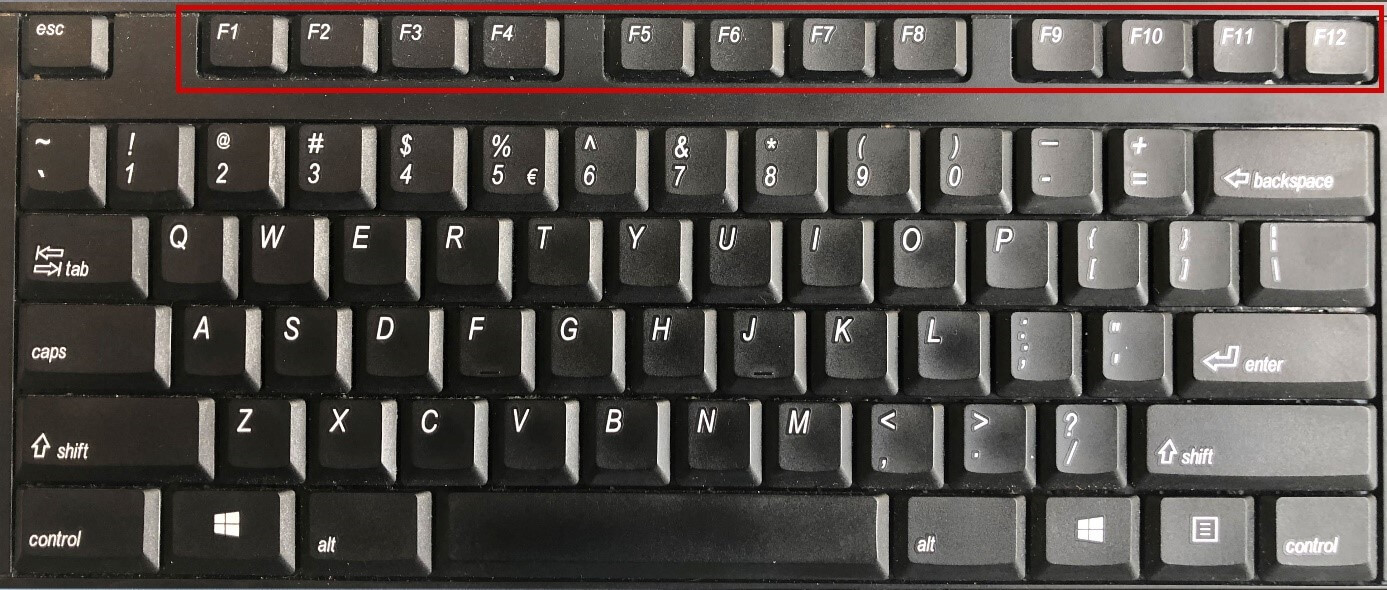
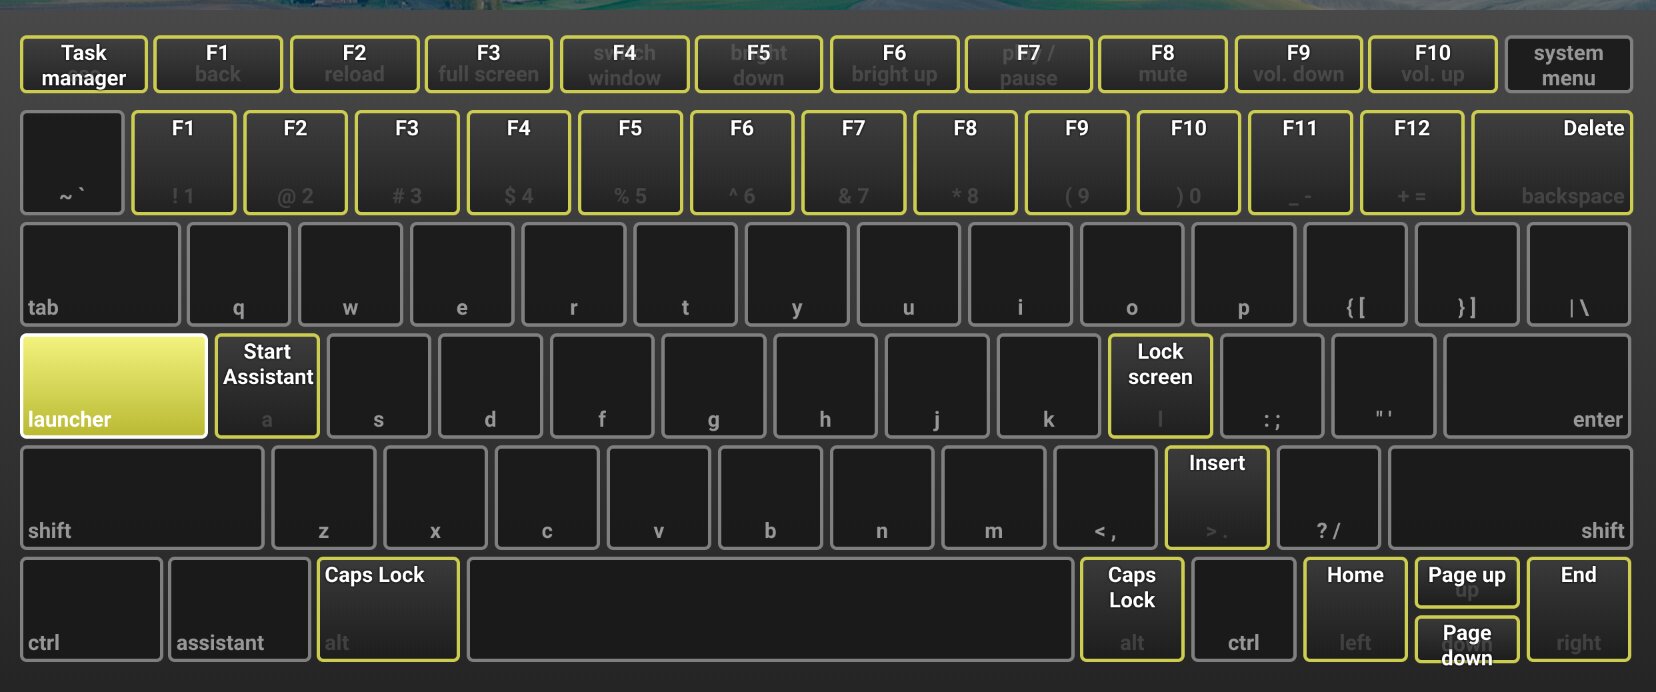
One notable difference is the absence of function keys (F1, F2, etc.) on the top row of the keyboard. Instead, the top row consists of a series of special keys that serve different functions. These keys include brightness controls, volume controls, and multimedia shortcuts.
However, hidden beneath these multimedia keys lies the F1 to F12 keys, which can be accessed by holding down the “Search” or “Launcher” key and tapping the desired function key. In our case, we are interested in accessing the F12 key.
The “Search” or “Launcher” key is typically represented by the magnifying glass icon or the Google logo located in the bottom row, left to the “Alt” key. By pressing and holding this key, along with the desired function key, you can access the special functionality associated with the F12 key.
Now that we have a better understanding of the Chromebook keyboard layout and how to access the function keys, let’s move on to locating the F12 key and exploring its capabilities.
Locating the F12 Key
Locating the F12 key on a Chromebook is straightforward. Just like on any standard keyboard, the F12 key is located in the top row, following the F11 key and preceding the “Power” button.
On most Chromebook models, the F12 key is labeled with the inscription “F12” or “Dev.” However, depending on the specific Chromebook model you are using, there might be slight variations in the labeling or design.
If you are having trouble locating the F12 key, you can look for a small “Fn” or “Function” key on the bottom row of your keyboard. By pressing and holding the “Fn” key and then pressing the “F12” key, you can activate the F12 function without the need to hold down the “Search” or “Launcher” key.
Now that you know where to find the F12 key on your Chromebook, it’s time to explore how to use it to access the developer tools and unleash its full potential.
Accessing Developer Tools Using F12
The F12 key on a Chromebook serves as a shortcut to access the developer tools in the Chrome browser. These tools provide a variety of functionalities that assist developers in debugging, inspecting, and optimizing web pages.
To access the developer tools using the F12 key, follow these simple steps:
- Open the Chrome browser on your Chromebook.
- Navigate to the web page you want to inspect or debug.
- Press and hold the “Search” or “Launcher” key on your keyboard.
- While holding down the “Search” or “Launcher” key, tap the F12 key.
Alternatively, if your Chromebook has a dedicated “Fn” or “Function” key, you can press and hold the “Fn” key and then press the F12 key to access the developer tools.
Once you’ve successfully triggered the F12 key combination, the developer tools panel will appear at the bottom or right side of the Chrome browser window, depending on your Chromebook’s display settings.
Now that you have accessed the developer tools using the F12 key, you can explore the various tabs and functionalities available to help you analyze and manipulate web page elements, debug JavaScript code, modify CSS styles, and much more.
Next, we will discuss how to use the F12 key to inspect elements on a web page and gain insights into its structure and styling.
Using F12 to Inspect Elements on a Web Page
With the developer tools panel open, you can utilize the F12 key to inspect elements on a web page and gain a deeper understanding of its structure, layout, and styling.
Here’s how you can use the F12 key to inspect elements:
- Select the “Elements” tab in the developer tools panel.
- Hover your mouse cursor over an element on the web page, and the corresponding HTML code will be highlighted in the developer tools.
- Click on the element in the HTML code to reveal its properties, attributes, and styles in the developer tools panel.
By inspecting elements on a web page, you can identify and understand the HTML structure, see the applied CSS styles, and even make temporary modifications to test different designs or layout changes.
The developer tools panel allows you to view and edit HTML attributes, modify CSS styles, and preview the changes in real-time. This feature is invaluable for web developers and designers, as it helps streamline the debugging and design process.
Remember, any changes made using the developer tools panel are temporary and only affect the current session. To permanently modify the web page, you will need to edit the source code.
Now that you know how to use the F12 key to inspect elements on a web page, let’s move on to exploring how the console tab can be accessed using the F12 key.
Utilizing the Console Tab Using F12
The console tab in the developer tools panel is a powerful tool that allows developers to interact with and manipulate JavaScript code on a web page. By utilizing the F12 key, you can easily access and utilize the console tab to debug and execute JavaScript commands.
To access the console tab using the F12 key, follow these steps:
- Open the Chrome browser on your Chromebook.
- Navigate to the web page you want to inspect or debug.
- Press and hold the “Search” or “Launcher” key on your keyboard.
- While holding down the “Search” or “Launcher” key, tap the F12 key.
- Select the “Console” tab in the developer tools panel that appears at the bottom or right side of the browser window.
Once you have accessed the console tab, you can start experimenting with JavaScript commands and interact with the web page in real-time.
The console tab is a valuable tool for debugging JavaScript errors, printing output, testing code snippets, and even manipulating the web page’s behavior on the fly. Developers can execute JavaScript commands directly in the console and receive immediate feedback.
Furthermore, the console offers a range of helpful functions and utilities, such as inspecting variables, logging messages, and even setting breakpoints for more advanced debugging purposes.
By utilizing the console tab and the F12 key, you can leverage the power of JavaScript to enhance the functionality and interactivity of your web applications.
Now that you have learned how to access and utilize the console tab using the F12 key, let’s move on to exploring how to modify CSS styles with F12.
Modifying CSS Styles with F12
The F12 key and the developer tools panel provide an efficient way to modify CSS styles on a web page. By accessing the “Elements” tab and leveraging the F12 key, you can make temporary changes to the CSS styles and see the visual impact in real-time.
Follow these steps to modify CSS styles using the F12 key:
- Select the “Elements” tab in the developer tools panel.
- Navigate to the element whose CSS style you want to modify.
- Locate the CSS styles displayed in the “Styles” pane of the developer tools.
- Click on a specific CSS property to modify its value.
As you make changes to the CSS styles, you will immediately see the effects reflected on the web page. This allows you to experiment with different styles, colors, and layouts, helping you fine-tune the appearance of your web page.
It’s important to note that any changes made using the developer tools panel are temporary and only affect the current session. To permanently modify the CSS styles of a web page, you will need to implement the changes in the source code.
Moreover, the developer tools panel provides a convenient feature called “Live Edit” that allows you to directly edit CSS styles by double-clicking on the corresponding values. This can speed up the process of making quick adjustments to the styling of your web page.
By using the F12 key to modify CSS styles, you can achieve a better visual representation of your design ideas and quickly iterate on the look and feel of your web page.
Now that you have learned how to modify CSS styles using the F12 key, let’s move on to exploring how to debug JavaScript code with F12.
Debugging JavaScript with F12
The F12 key and the developer tools panel provide an invaluable toolset for debugging JavaScript code. By utilizing the console tab and the various debugging features available, developers can efficiently identify and resolve errors in their JavaScript code.
To debug JavaScript using the F12 key, follow these steps:
- Open the Chrome browser on your Chromebook.
- Navigate to the web page that contains the JavaScript code you want to debug.
- Press and hold the “Search” or “Launcher” key on your keyboard.
- While holding down the “Search” or “Launcher” key, tap the F12 key.
- Select the “Sources” tab in the developer tools panel that appears at the bottom or right side of the browser window.
- Locate the JavaScript file you want to debug in the file tree.
- Set breakpoints in your JavaScript code by clicking on the line number in the file.
- Interact with your web page to trigger the JavaScript code.
- As the code execution reaches a breakpoint, the developer tools panel will pause at that line, allowing you to inspect variables, step through the code, and identify the cause of any errors.
The debugger in the developer tools panel provides powerful capabilities such as stepping through code, examining variable values, and evaluating expressions. By leveraging these features, you can gain insights into the flow of your JavaScript code and quickly identify and fix issues.
In addition to breakpoints, the console in the developer tools panel enables you to log messages, errors, and warnings, providing further visibility into the execution of your JavaScript code.
By using the F12 key to debug JavaScript, you can ensure the optimal performance and functionality of your web applications.
Now that you have learned how to debug JavaScript using the F12 key, you have acquired a powerful tool for troubleshooting and optimizing your code.
With access to the developer tools and the ability to modify CSS styles, inspect elements, manipulate JavaScript, and debug code, you are well-equipped to enhance your web development workflow using the F12 key on your Chromebook.
Conclusion
The F12 key on a Chromebook serves as a gateway to powerful tools and functionalities that can greatly enhance your web development experience. By understanding how to access the developer tools using the F12 key, you can unlock a range of capabilities that assist with debugging, inspecting, and optimizing web pages.
Throughout this article, we have explored the various aspects of using the F12 key on a Chromebook, from understanding the Chromebook keyboard layout to locating the F12 key itself. We have learned how to access the developer tools, inspect elements on a web page, utilize the console tab, modify CSS styles, and debug JavaScript code.
By leveraging the F12 key and the developer tools panel, you can streamline your development process, identify and fix issues efficiently, and create visually appealing and high-performing web applications.
Remember, the changes made using the F12 key and the developer tools are temporary and only affect the current session. To make permanent modifications to a web page, you will need to edit the source code.
Whether you are a seasoned developer or just starting out, understanding and utilizing the F12 key on your Chromebook can greatly improve your productivity and enable you to create outstanding web experiences.
So, go ahead and unleash the power of the F12 key on your Chromebook and take your web development skills to new heights!