Introduction
Testing JavaScript in Chrome is an essential skill for web developers and programmers. Chrome, being one of the most popular web browsers, offers a robust set of developer tools that can be utilized for testing and debugging JavaScript code. Whether you are a seasoned developer or just starting out, understanding how to effectively test JavaScript in Chrome can significantly improve your workflow and help you identify and fix issues in your code.
In this article, we will explore various methods and tools available in Chrome for testing JavaScript code. From using the built-in developer tools to leveraging extensions, we will cover a range of techniques that can streamline the testing process and enhance the overall development experience.
By mastering these techniques, you can gain a deeper understanding of how JavaScript behaves in the browser environment and become more proficient in identifying and resolving potential issues. Whether you are working on a personal project or collaborating with a team, the ability to test JavaScript effectively in Chrome can make a substantial difference in the quality and performance of your web applications.
So, let's dive into the world of Chrome developer tools and discover how they can empower you to test and debug JavaScript with confidence and efficiency. Whether you're troubleshooting a complex piece of code or simply exploring the capabilities of JavaScript, Chrome's developer tools provide a versatile and powerful platform for testing and experimentation.
Setting Up Chrome Developer Tools
Chrome Developer Tools is a robust set of features built into the Chrome browser that empowers developers to inspect, debug, and optimize their web applications. Before delving into the specifics of testing JavaScript, it's essential to ensure that Chrome Developer Tools is readily accessible and configured to suit your development needs.
To access Chrome Developer Tools, simply right-click on any element within a web page and select "Inspect" from the context menu. Alternatively, you can press "Ctrl + Shift + I" on Windows/Linux or "Cmd + Option + I" on macOS to open the Developer Tools panel. This action will reveal a comprehensive suite of tools designed to aid in web development, including the testing and debugging of JavaScript code.
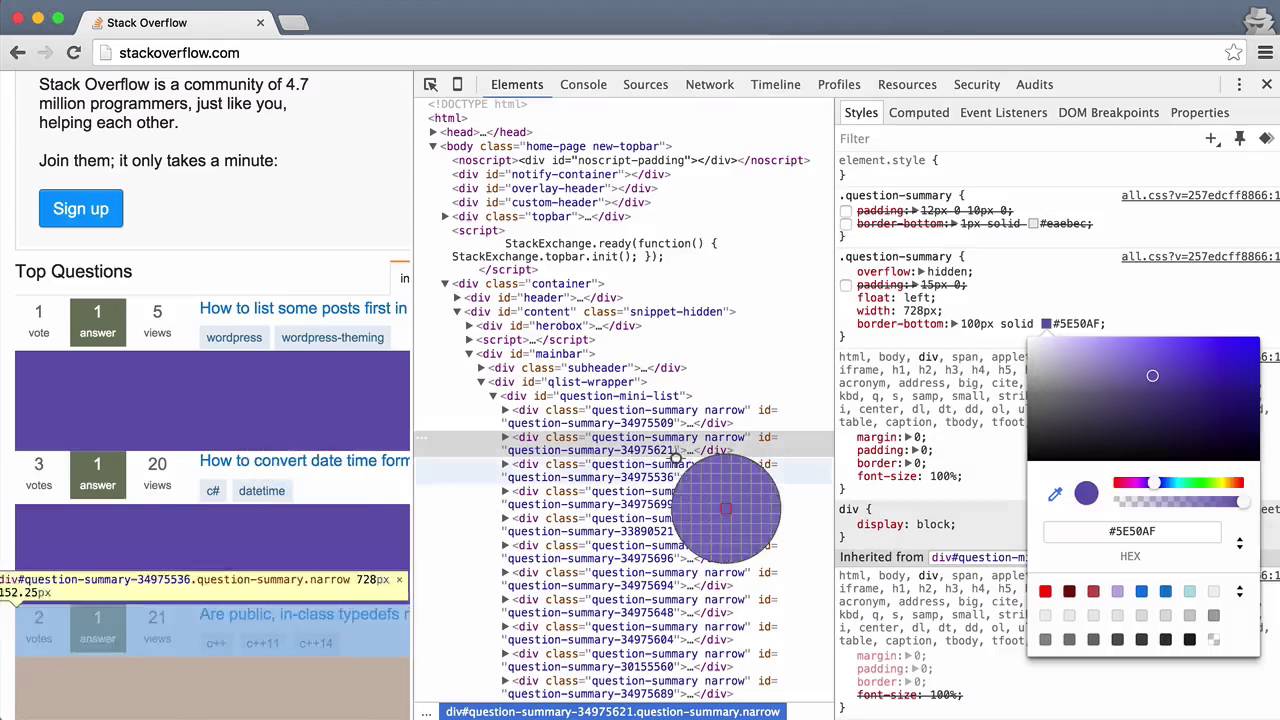
Upon opening Chrome Developer Tools, you will be presented with a multifaceted interface comprising several tabs, each serving a distinct purpose. The "Elements" tab allows you to inspect and manipulate the HTML and CSS of the current page, while the "Console" tab provides a JavaScript console for executing code and logging messages. Additionally, the "Sources" tab offers a comprehensive environment for debugging and testing JavaScript code, complete with features such as breakpoints, watch expressions, and call stacks.
To further customize your testing environment, Chrome Developer Tools provides a range of settings and preferences that can be tailored to your specific requirements. By navigating to the "Settings" panel within Developer Tools, you can configure options related to appearance, preferences, experiments, and more. This level of customization ensures that your testing environment is optimized for efficiency and productivity, allowing you to focus on the task at hand without unnecessary distractions.
In addition to the built-in features, Chrome Developer Tools also supports extensions that can augment its capabilities for testing JavaScript. These extensions, which can be installed from the Chrome Web Store, offer additional functionalities such as performance analysis, code profiling, and network monitoring, further enhancing the testing and debugging experience.
By familiarizing yourself with the setup and customization of Chrome Developer Tools, you can establish a solid foundation for testing JavaScript code effectively. Whether you are a novice developer or an experienced professional, leveraging the full potential of Chrome Developer Tools can significantly elevate your ability to test, debug, and optimize JavaScript in the browser environment.
Using Console for Testing
The Console tab within Chrome Developer Tools serves as a versatile and powerful platform for testing and experimenting with JavaScript code. Whether you are seeking to validate the behavior of specific functions, troubleshoot unexpected errors, or gain insights into variable values during runtime, the Console offers a range of features that can streamline the testing process and enhance your understanding of JavaScript execution.
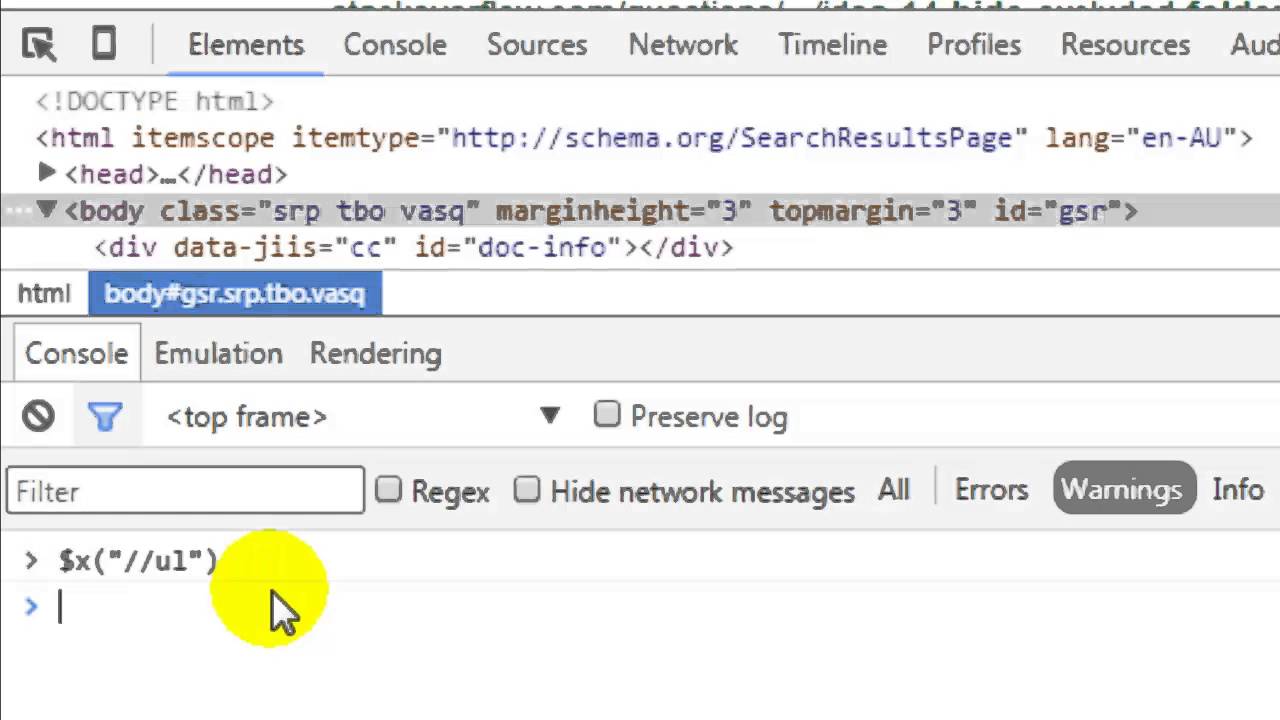
One of the fundamental capabilities of the Console is its ability to execute JavaScript code directly within the context of the current web page. By simply typing JavaScript expressions or statements into the Console prompt and pressing Enter, you can instantly observe the results of your code. This real-time interaction enables you to test individual lines of code, evaluate expressions, and verify the expected outcomes, all without the need to modify the original source files.
Furthermore, the Console provides a mechanism for logging messages, warnings, errors, and other output generated by JavaScript code. By utilizing functions such as console.log(), console.warn(), and console.error(), you can strategically insert diagnostic messages into your code to track the flow of execution and identify potential issues. This logging capability is invaluable for understanding the sequence of operations within your JavaScript code and can be instrumental in pinpointing areas that require further testing and refinement.
In addition to executing and logging code, the Console offers a rich set of features for inspecting and manipulating JavaScript objects and variables. You can access and modify the properties of objects, inspect the structure of arrays, and even interact with the Document Object Model (DOM) of the current web page. This level of introspection and manipulation empowers you to delve deep into the inner workings of your JavaScript code, enabling thorough testing and validation of complex data structures and interactions.
Moreover, the Console supports the use of console.assert() to perform assertions on specific conditions within your code. This function allows you to define logical expressions that, when evaluated to false, trigger an assertion failure and display a customizable error message in the Console. By incorporating assertions into your testing workflow, you can establish checkpoints for critical conditions and ensure that your JavaScript code adheres to expected behaviors and constraints.
By leveraging the capabilities of the Console within Chrome Developer Tools, you can elevate your ability to test and validate JavaScript code with precision and confidence. Whether you are conducting ad-hoc experiments, diagnosing runtime issues, or refining the functionality of your web applications, the Console serves as an indispensable companion for testing JavaScript in the browser environment.
Using Debugger for Testing
The Debugger feature within Chrome Developer Tools offers a comprehensive and powerful environment for testing and debugging JavaScript code. By leveraging the capabilities of the Debugger, developers can gain deep insights into the runtime behavior of their code, identify and resolve issues, and validate the functionality of complex JavaScript applications.
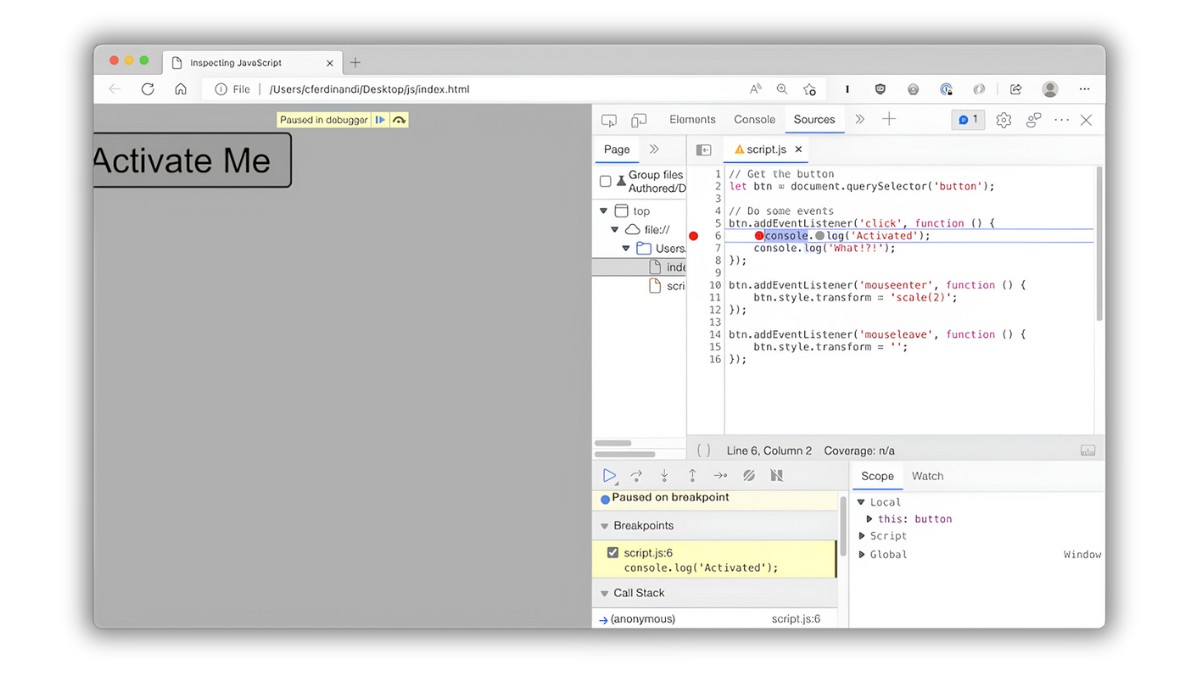
One of the primary functions of the Debugger is the ability to set breakpoints within JavaScript code. By placing breakpoints at strategic locations, such as specific lines of code or function declarations, developers can pause the execution of their code at precise moments and inspect the state of variables, objects, and the call stack. This level of control enables thorough testing of individual code segments, allowing developers to verify the expected behavior and identify any deviations from the intended logic.
Upon reaching a breakpoint, the Debugger provides a rich set of tools for inspecting and manipulating the runtime environment. Developers can examine the values of variables, step through the execution of code line by line, and observe the interactions between different components of their JavaScript applications. This granular visibility into the inner workings of the code facilitates comprehensive testing, empowering developers to validate the correctness and integrity of their JavaScript logic.
Furthermore, the Debugger offers features such as watch expressions, which allow developers to monitor specific variables and expressions during runtime. By defining watch expressions, developers can track the evolution of critical values and conditions, gaining valuable insights into the behavior of their JavaScript code. This capability is instrumental in testing and validating complex algorithms, conditional logic, and data transformations, ensuring that the code behaves as intended under various scenarios.
In addition to breakpoints and watch expressions, the Debugger provides facilities for stepping into, over, and out of function calls, enabling developers to trace the flow of execution and understand the sequence of operations within their JavaScript applications. This level of control and visibility is invaluable for testing and validating the behavior of functions, methods, and asynchronous operations, allowing developers to identify and address potential issues with precision and efficiency.
By harnessing the capabilities of the Debugger within Chrome Developer Tools, developers can elevate their testing and debugging workflows, gaining a deeper understanding of their JavaScript code and ensuring its reliability and robustness. Whether you are refining the functionality of a web application, diagnosing complex issues, or optimizing performance, the Debugger serves as an indispensable tool for testing JavaScript with precision and confidence.
Using Snippets for Testing
Snippets in Chrome Developer Tools provide a convenient and efficient way to test and experiment with JavaScript code within the context of a web page. These reusable code snippets can be created, edited, and executed directly from the Sources panel, offering a streamlined workflow for testing and validating JavaScript functionality.
To create a new snippet, simply navigate to the Sources panel within Chrome Developer Tools and select the "Snippets" tab. From there, you can right-click and choose "New" to create a new snippet file. Once created, the snippet file presents a dedicated editor where you can input and edit JavaScript code, complete with syntax highlighting and code formatting for enhanced readability.
The ability to create and manage snippets provides a structured approach to organizing and testing JavaScript code snippets, making it ideal for iterative testing and refinement of specific functionalities. Whether you are developing a new feature, debugging a complex algorithm, or exploring the behavior of a particular function, snippets offer a controlled environment for focused testing and experimentation.
Moreover, snippets can be executed within the context of the current web page, allowing you to observe the real-time effects of your JavaScript code on the page's elements and behavior. This live interaction facilitates rapid testing and validation, enabling you to iterate on your code and verify its functionality without the need for external tools or modifications to the original source files.
In addition to execution, snippets support the use of console.log() and other logging functions, enabling you to capture and analyze the output of your JavaScript code. This logging capability is invaluable for tracking the flow of execution, inspecting variable values, and diagnosing potential issues, providing a comprehensive testing environment within the familiar confines of Chrome Developer Tools.
By leveraging snippets for testing, developers can establish a structured and controlled environment for validating JavaScript code, refining its functionality, and gaining insights into its behavior. Whether you are conducting targeted tests, refining algorithms, or experimenting with new features, snippets offer a versatile platform for iterative testing and experimentation, empowering developers to refine and validate their JavaScript code with precision and confidence.
Using Extensions for Testing
In addition to the built-in features of Chrome Developer Tools, developers can leverage a variety of extensions to enhance their testing capabilities for JavaScript. These extensions, available through the Chrome Web Store, offer a diverse range of functionalities that can streamline the testing and debugging process, providing additional tools and insights to aid in the validation of JavaScript code.
One notable category of extensions is focused on performance analysis and profiling. These extensions enable developers to gain deep insights into the runtime performance of their JavaScript code, identifying potential bottlenecks, memory leaks, and inefficiencies that may impact the overall user experience. By profiling the execution of JavaScript code, developers can pinpoint areas for optimization and refinement, ensuring that their applications deliver optimal performance across various devices and usage scenarios.
Furthermore, extensions designed for network monitoring and analysis play a crucial role in testing JavaScript code that interacts with external resources and APIs. By capturing and analyzing network requests, responses, and data transfers, developers can validate the behavior of their JavaScript code in real-world network environments, ensuring robustness and reliability in the face of diverse network conditions and configurations.
Another valuable category of extensions focuses on code validation and error detection. These extensions offer advanced linting, static analysis, and error-checking capabilities for JavaScript code, empowering developers to identify and address potential issues before they manifest in the production environment. By integrating these extensions into their testing workflow, developers can ensure the correctness and adherence to best practices in their JavaScript code, fostering a culture of quality and reliability in their development process.
Additionally, extensions that facilitate cross-browser testing and compatibility validation are instrumental for ensuring the consistent behavior of JavaScript code across different browsers and platforms. By simulating various browser environments and configurations, these extensions enable developers to identify and address compatibility issues, ensuring that their JavaScript code delivers a seamless and consistent experience for users regardless of the browser they choose to use.
By incorporating these extensions into their testing arsenal, developers can augment the capabilities of Chrome Developer Tools, gaining access to specialized functionalities that cater to specific aspects of JavaScript testing and validation. Whether it's performance optimization, network resilience, code quality, or cross-browser compatibility, these extensions offer a wealth of tools and insights to empower developers in their quest to deliver robust and reliable JavaScript applications.