Introduction
Google Chrome is not just a web browser; it's a powerful tool that offers a wide array of features to enhance the browsing experience for users and developers alike. One of its most valuable features is the Developer Tools, often referred to as Dev Tools. These tools provide developers with a comprehensive set of resources to inspect, debug, and optimize websites and web applications.
Whether you're a seasoned developer or just starting out, understanding how to access and utilize Chrome's Developer Tools can significantly improve your workflow and productivity. From inspecting and modifying the HTML and CSS of a webpage to analyzing network activity and performance metrics, the Dev Tools offer a wealth of capabilities that can help you build and maintain high-quality web experiences.
In this article, we'll delve into the various panels and functionalities of Chrome's Developer Tools, providing a detailed overview of how to access and leverage these features effectively. By the end of this guide, you'll have a solid understanding of how to harness the power of Chrome's Dev Tools to troubleshoot issues, optimize performance, and gain valuable insights into the inner workings of web development. So, let's embark on this journey to uncover the hidden gems of Chrome's Developer Tools and unlock their full potential.
Opening Dev Tools
To access Chrome's Developer Tools, you can use several methods. The most common approach is by right-clicking on any element within a webpage and selecting "Inspect" from the context menu. Alternatively, you can use the keyboard shortcut by pressing Ctrl + Shift + I (Windows/Linux) or Cmd + Option + I (Mac). Another quick way to open the Dev Tools is by right-clicking anywhere on a webpage, selecting "Inspect" from the context menu, and then clicking on the "Console" tab within the Dev Tools panel.
Upon opening the Developer Tools, you'll be presented with a panel that typically docks to the bottom or right side of the browser window, depending on your preference. This panel is divided into several tabs, each offering distinct functionalities for inspecting and analyzing different aspects of web development.
The Dev Tools interface is designed to be intuitive and user-friendly, allowing you to seamlessly navigate between panels and access a wide range of tools and resources. Whether you're a front-end developer fine-tuning the layout and styling of a webpage or a back-end developer optimizing network performance and debugging JavaScript code, the Developer Tools provide a unified platform to cater to your specific needs.
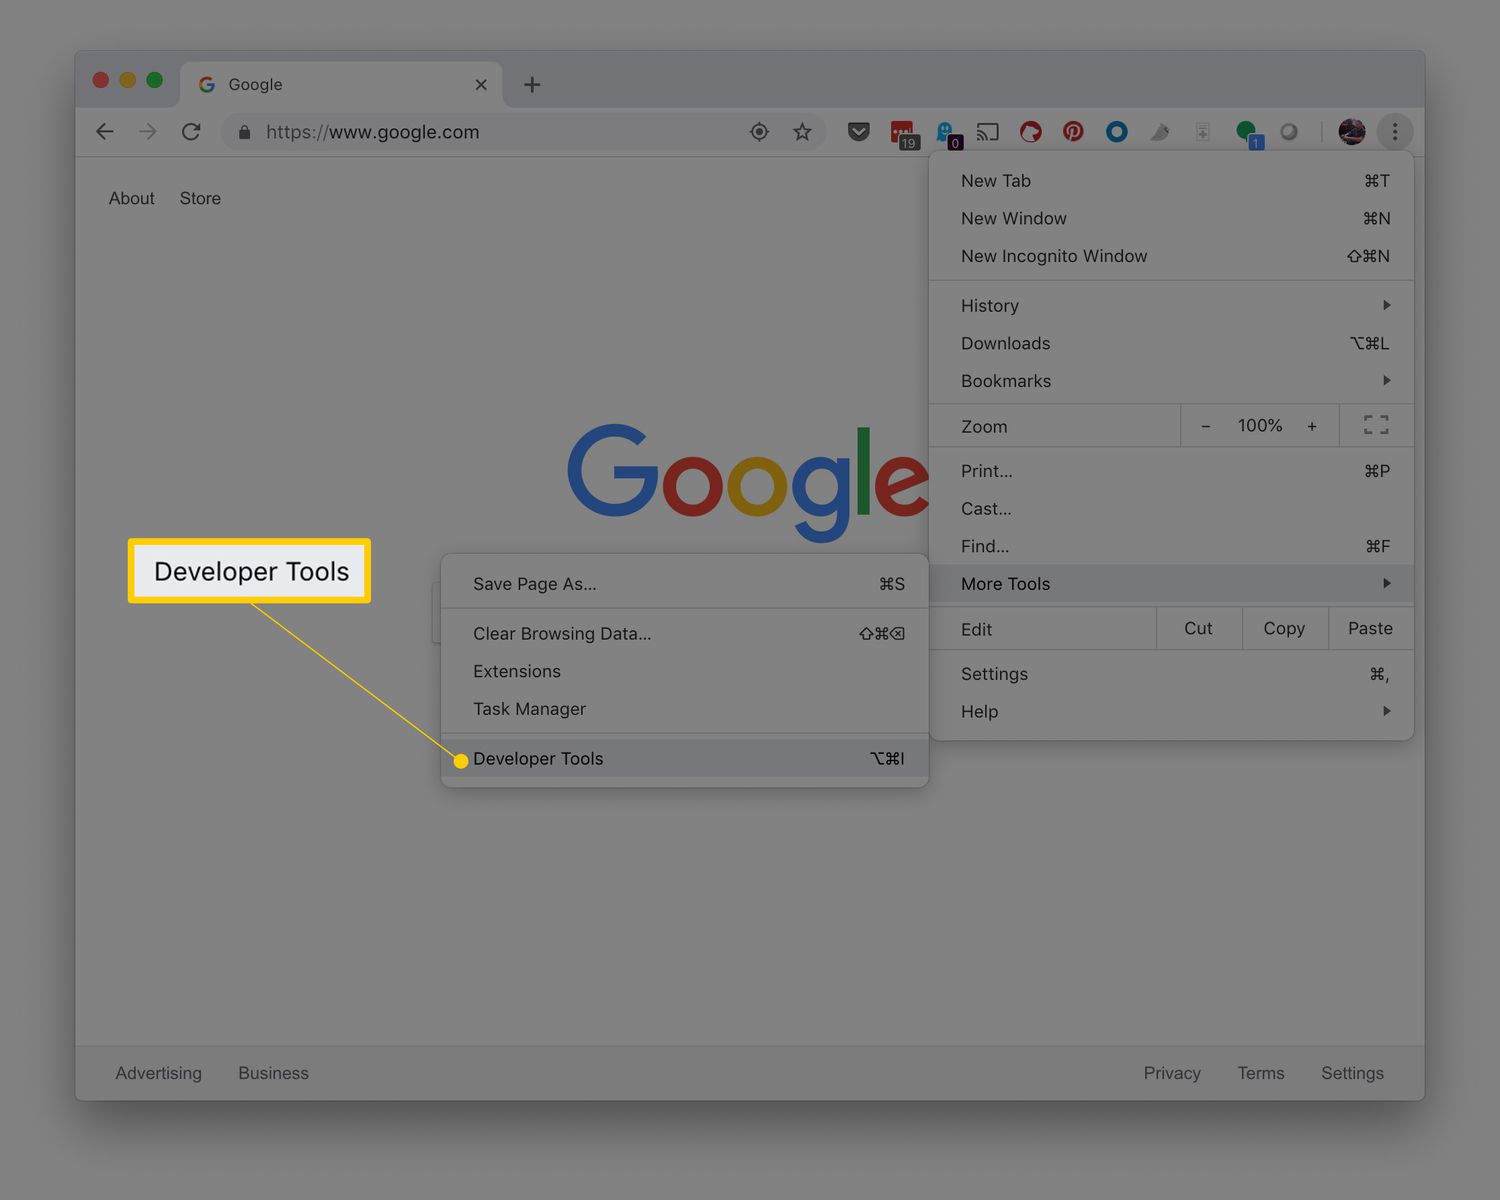
In addition to the traditional methods of opening the Dev Tools, Chrome also offers a dedicated menu option for accessing Developer Tools. You can find this option by clicking on the three-dot menu icon in the top-right corner of the browser window, navigating to "More Tools," and then selecting "Developer Tools." This method provides a convenient way to access the Dev Tools without relying on keyboard shortcuts or context menus.
Furthermore, Chrome's Developer Tools are highly customizable, allowing you to adjust the panel layout, toggle specific features, and even create custom shortcuts to streamline your development workflow. By right-clicking on any tab within the Dev Tools panel, you can access a contextual menu that offers options for docking the panel, undocking it into a separate window, or even closing specific tabs to declutter the interface.
In essence, opening Chrome's Developer Tools is the gateway to a wealth of powerful features and functionalities that can significantly enhance your web development endeavors. Whether you're a novice developer eager to explore the inner workings of web technologies or a seasoned professional seeking to optimize performance and troubleshoot complex issues, the Dev Tools serve as an indispensable companion in your journey towards building exceptional web experiences.
Elements Panel
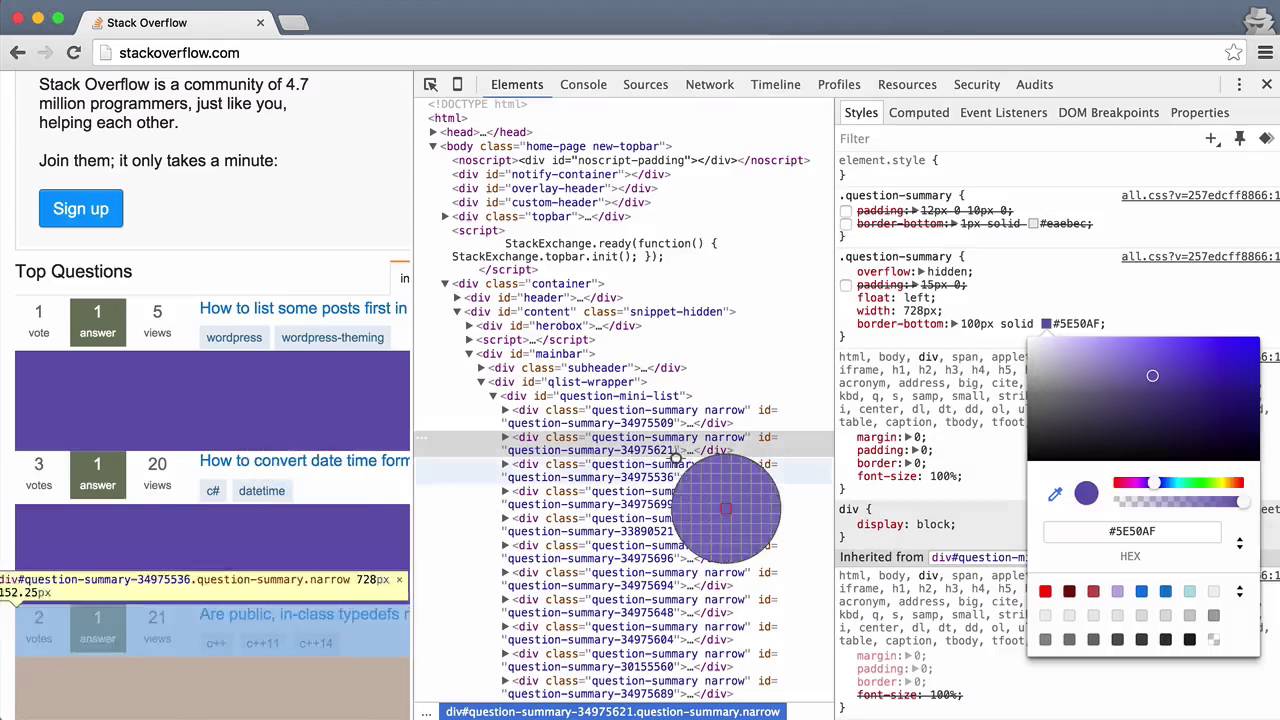
The Elements panel within Chrome's Developer Tools is a fundamental component that empowers developers to inspect and manipulate the HTML and CSS of a webpage in real-time. Upon accessing the Elements panel, you'll be greeted with a visual representation of the Document Object Model (DOM) of the currently loaded webpage. This hierarchical view allows you to explore the structure of the webpage, including its elements, attributes, and styling properties.
One of the key functionalities of the Elements panel is the ability to inspect and modify the HTML and CSS of individual elements within the webpage. By hovering over different elements in the DOM tree, you can visualize their corresponding layout on the page, making it easier to identify specific components and their associated styles. Furthermore, clicking on any element within the DOM tree highlights it on the webpage, providing a seamless way to pinpoint and analyze specific elements.
The Styles pane, located within the Elements panel, offers a comprehensive overview of the CSS rules applied to selected elements. This includes details such as the element's dimensions, margins, padding, fonts, colors, and more. By leveraging the Styles pane, developers can experiment with live edits to the CSS properties of elements, instantly observing the visual impact of their changes on the webpage's layout and design.
In addition to inspecting and modifying individual elements, the Elements panel provides a range of powerful features for debugging and troubleshooting web layouts. For instance, the Box Model tool visually represents the dimensions and spacing of an element, aiding in the precise adjustment of margins, borders, and padding. Similarly, the Computed pane displays the computed styles of an element, offering insights into how CSS rules are applied and computed by the browser.
Moreover, the Elements panel integrates with the Console, allowing developers to execute JavaScript commands directly within the context of the webpage. This seamless integration enables dynamic interactions with the DOM, facilitating the testing and manipulation of elements through JavaScript code.
Overall, the Elements panel serves as a versatile hub for inspecting, editing, and debugging the structure and styling of webpages. Its intuitive interface, coupled with powerful visualization and editing capabilities, makes it an indispensable tool for front-end developers striving to craft visually appealing and responsive web experiences. Whether you're fine-tuning the layout of a complex web layout or diagnosing styling issues, the Elements panel equips you with the necessary resources to elevate your web development workflow.
Console Panel
The Console panel in Chrome's Developer Tools is a versatile and powerful feature that provides developers with a command-line interface for executing JavaScript code, logging diagnostic information, and debugging web applications. Upon accessing the Console panel, you're greeted with a familiar environment that allows you to interact with the webpage's JavaScript context, enabling real-time evaluation of expressions, functions, and variables.
One of the primary functions of the Console panel is to serve as a platform for logging messages, errors, and warnings generated by JavaScript code running on the webpage. This includes output from console.log(), console.error(), console.warn(), and other console methods, providing developers with a centralized location to monitor and analyze runtime information. By leveraging these logging capabilities, developers can gain valuable insights into the behavior of their JavaScript code, facilitating the identification of bugs, unexpected behaviors, and performance bottlenecks.
Furthermore, the Console panel offers a robust set of features for interactive JavaScript development. Developers can directly input and execute JavaScript expressions and statements within the console, allowing for rapid prototyping, testing, and experimentation. This interactive environment enables developers to inspect and manipulate the webpage's DOM, access global variables, and even interact with the browser's APIs, all within the context of the live webpage.
In addition to serving as a command-line interface for JavaScript, the Console panel integrates with the Network panel, enabling developers to monitor network requests, examine response data, and diagnose potential issues related to network activity. This seamless integration empowers developers to correlate JavaScript execution with network interactions, facilitating comprehensive debugging and optimization of web applications.
Moreover, the Console panel provides advanced features such as the ability to set breakpoints, step through code execution, and analyze stack traces, making it an invaluable tool for debugging complex JavaScript logic and identifying the root causes of errors. By leveraging these debugging capabilities, developers can streamline the process of diagnosing and resolving issues within their web applications, ultimately enhancing the reliability and performance of their code.
In essence, the Console panel within Chrome's Developer Tools serves as a multifaceted resource for JavaScript development, offering a seamless blend of logging, interactive execution, and debugging functionalities. Whether you're troubleshooting JavaScript errors, experimenting with dynamic code, or analyzing network interactions, the Console panel equips you with the necessary tools to elevate your web development workflow and build robust, high-quality web applications.
Sources Panel
The Sources panel in Chrome's Developer Tools is a pivotal component that provides developers with a comprehensive set of tools for debugging and analyzing JavaScript code within web applications. Upon accessing the Sources panel, developers are presented with a multifaceted interface that facilitates seamless navigation through the source code of the webpage, enabling in-depth inspection, debugging, and optimization of JavaScript logic.
One of the primary functionalities of the Sources panel is its ability to display the source files associated with the loaded webpage, including JavaScript, CSS, and other external resources. This visual representation of the source code allows developers to explore the structure of the application, navigate through different files, and gain a holistic understanding of the codebase. By leveraging the intuitive interface of the Sources panel, developers can effortlessly inspect and analyze the JavaScript files that power the functionality of the webpage, facilitating efficient debugging and troubleshooting.
Furthermore, the Sources panel offers robust debugging capabilities, including features such as breakpoints, watch expressions, call stacks, and variable inspection. By setting breakpoints within the source code, developers can pause the execution of JavaScript at specific points, allowing for detailed examination of variables, function calls, and program state. This granular level of control empowers developers to identify and resolve issues within their JavaScript code, ultimately enhancing the reliability and performance of their web applications.
In addition to traditional debugging features, the Sources panel integrates seamlessly with the Console, enabling developers to interactively execute JavaScript code within the context of the webpage. This integration facilitates rapid prototyping, testing, and experimentation, empowering developers to dynamically interact with the application's JavaScript logic and the DOM, all within the live environment of the webpage.
Moreover, the Sources panel provides a comprehensive set of tools for managing and analyzing network requests, including the ability to inspect XHR (XMLHttpRequest) and fetch requests, examine response data, and monitor network activity. This holistic view of network interactions allows developers to correlate JavaScript execution with network requests, facilitating the identification of potential performance bottlenecks, latency issues, and data processing inefficiencies.
In essence, the Sources panel within Chrome's Developer Tools serves as a central hub for JavaScript debugging and analysis, offering a seamless blend of source code exploration, interactive debugging, and network request monitoring. Whether you're diagnosing JavaScript errors, optimizing code performance, or analyzing network interactions, the Sources panel equips you with the necessary resources to elevate your web development workflow and build robust, high-quality web applications.
Network Panel
The Network panel in Chrome's Developer Tools is an indispensable resource that provides developers with deep insights into the network activity of web applications. Upon accessing the Network panel, developers are presented with a comprehensive overview of network requests initiated by the webpage, including details such as request and response headers, timing metrics, and resource loading behaviors. This holistic view of network activity enables developers to diagnose performance issues, optimize resource loading, and gain a thorough understanding of the application's network interactions.
One of the primary functionalities of the Network panel is its ability to capture and display network requests in real-time, allowing developers to monitor the loading of resources such as HTML, CSS, JavaScript, images, and AJAX requests. Each network request is accompanied by detailed information, including the request method, status code, initiator, and timing metrics, providing developers with a granular view of the application's network performance. By leveraging this real-time monitoring capability, developers can identify potential bottlenecks, latency issues, and resource loading inefficiencies, ultimately optimizing the application's responsiveness and user experience.
Furthermore, the Network panel offers robust filtering and sorting options, enabling developers to streamline the analysis of network requests based on various criteria such as request type, domain, status code, and content type. This flexible filtering mechanism empowers developers to focus on specific aspects of network activity, facilitating targeted optimization and troubleshooting efforts. Additionally, the Network panel provides visualization tools for waterfall analysis, allowing developers to visualize the timing and dependencies of network requests, aiding in the identification of performance bottlenecks and resource loading optimizations.
In addition to monitoring network requests, the Network panel integrates seamlessly with other Developer Tools components, such as the Console and the Sources panel. This integration enables developers to correlate network activity with JavaScript execution, facilitating comprehensive debugging and optimization of web applications. By analyzing the timing and impact of network requests in conjunction with JavaScript logic, developers can gain a holistic understanding of the application's performance characteristics, leading to informed optimization decisions and enhanced user experiences.
Overall, the Network panel within Chrome's Developer Tools serves as a vital resource for analyzing and optimizing the network activity of web applications. Whether you're diagnosing performance issues, optimizing resource loading, or correlating network interactions with JavaScript execution, the Network panel equips you with the necessary tools to elevate your web development workflow and build high-performing, responsive web applications.
Performance Panel
The Performance panel in Chrome's Developer Tools is a powerful tool that provides developers with deep insights into the runtime performance of web applications. Upon accessing the Performance panel, developers are presented with a comprehensive suite of features and visualizations that enable the analysis and optimization of various performance metrics, including loading times, scripting execution, rendering, and overall responsiveness of web applications.
One of the primary functionalities of the Performance panel is its ability to record and analyze the runtime performance of web applications through the utilization of performance profiles. By initiating a performance profile, developers can capture a detailed timeline of events, encompassing activities such as loading, scripting, rendering, and user interactions. This timeline provides a holistic view of the application's performance characteristics, allowing developers to identify potential bottlenecks, inefficiencies, and opportunities for optimization.
Furthermore, the Performance panel offers a range of performance analysis tools, including the ability to visualize and inspect the loading and execution times of various resources and scripts. By leveraging these tools, developers can pinpoint performance bottlenecks, latency issues, and resource loading inefficiencies, ultimately optimizing the application's responsiveness and user experience. Additionally, the Performance panel integrates with other Developer Tools components, such as the Network panel and the Console, enabling developers to correlate performance metrics with network activity and JavaScript execution, facilitating comprehensive debugging and optimization of web applications.
In addition to performance profiling and analysis, the Performance panel provides advanced capabilities for simulating and analyzing user interactions, enabling developers to evaluate the responsiveness and smoothness of web applications under various usage scenarios. This includes features such as the ability to record and replay user interactions, visualize frame rates, and identify potential rendering and animation issues. By simulating user interactions and analyzing performance metrics, developers can ensure that web applications deliver a seamless and responsive user experience across different devices and usage conditions.
Overall, the Performance panel within Chrome's Developer Tools serves as an invaluable resource for analyzing and optimizing the runtime performance of web applications. Whether you're diagnosing performance issues, optimizing resource loading, or evaluating user interactions, the Performance panel equips you with the necessary tools to elevate your web development workflow and build high-performing, responsive web applications.
Memory Panel
The Memory panel in Chrome's Developer Tools is a critical component that provides developers with insights into the memory usage and allocation patterns of web applications. Upon accessing the Memory panel, developers are presented with a comprehensive suite of features and visualizations that enable the analysis and optimization of memory-related metrics, including heap snapshots, memory allocation timelines, and memory profiling.
One of the primary functionalities of the Memory panel is its ability to capture and analyze memory snapshots, allowing developers to gain a detailed understanding of the memory usage and allocation patterns within the application. By initiating a memory snapshot, developers can capture a comprehensive snapshot of the application's memory heap, including information about memory allocations, object references, and memory retention. This detailed snapshot provides developers with a holistic view of the application's memory consumption, enabling them to identify potential memory leaks, inefficient memory usage, and opportunities for memory optimization.
Furthermore, the Memory panel offers a range of memory analysis tools, including the ability to visualize memory allocation timelines and track memory usage over time. By leveraging these tools, developers can pinpoint memory allocation patterns, identify memory-intensive operations, and optimize memory usage within the application. Additionally, the Memory panel integrates with other Developer Tools components, such as the Performance panel and the Console, enabling developers to correlate memory metrics with runtime performance and JavaScript execution, facilitating comprehensive memory profiling and optimization of web applications.
In addition to memory profiling and analysis, the Memory panel provides advanced capabilities for inspecting and comparing memory snapshots, enabling developers to identify memory growth, object retention, and potential memory leaks. This includes features such as the ability to compare memory snapshots, visualize memory distribution, and analyze memory allocation trends. By inspecting memory snapshots and analyzing memory metrics, developers can ensure efficient memory management, mitigate memory-related issues, and optimize the overall memory footprint of the web application.
Overall, the Memory panel within Chrome's Developer Tools serves as an invaluable resource for analyzing and optimizing the memory usage of web applications. Whether you're diagnosing memory leaks, optimizing memory allocation, or evaluating memory retention, the Memory panel equips you with the necessary tools to elevate your web development workflow and build high-performing, memory-efficient web applications.
Application Panel
The Application panel in Chrome's Developer Tools is a comprehensive resource that empowers developers to manage and analyze various aspects of web application functionality, including storage, caching, service workers, and application manifests. Upon accessing the Application panel, developers are presented with a rich set of features and tools that facilitate seamless navigation and manipulation of application-related resources, enabling efficient management and optimization of web applications.
One of the primary functionalities of the Application panel is its ability to manage and inspect the storage mechanisms utilized by web applications, including local and session storage, IndexedDB, cookies, and cache storage. By navigating through the Storage section of the Application panel, developers can visualize and manipulate the data stored by the application, facilitating efficient debugging, testing, and management of client-side data storage. This includes the ability to inspect individual storage entries, clear storage data, and simulate storage events, providing developers with a comprehensive toolkit for managing application data.
Furthermore, the Application panel offers robust capabilities for managing and analyzing service workers, which are essential components for enabling offline functionality, background synchronization, and push notifications within web applications. By navigating the Service Workers section of the Application panel, developers can register, update, and unregister service workers, inspect their lifecycle and state, and simulate service worker events, facilitating comprehensive testing and debugging of service worker functionality.
In addition to storage and service worker management, the Application panel provides features for analyzing and managing application manifests, which define the metadata and configuration of progressive web applications. By inspecting the Manifest section of the Application panel, developers can visualize the contents of the application manifest, validate its structure and properties, and simulate installation and launch events, enabling thorough testing and optimization of progressive web application functionality.
Moreover, the Application panel integrates seamlessly with other Developer Tools components, such as the Network panel and the Console, enabling developers to correlate application functionality with network activity and JavaScript execution, facilitating comprehensive debugging and optimization of web applications. By analyzing the behavior of storage, service workers, and application manifests in conjunction with network interactions and JavaScript logic, developers can gain a holistic understanding of the application's functionality and performance characteristics, leading to informed optimization decisions and enhanced user experiences.
In essence, the Application panel within Chrome's Developer Tools serves as a pivotal resource for managing and analyzing various aspects of web application functionality, including storage, service workers, and application manifests. Whether you're debugging client-side data storage, optimizing service worker behavior, or validating progressive web application functionality, the Application panel equips you with the necessary tools to elevate your web development workflow and build high-quality, feature-rich web applications.
Security Panel
The Security panel in Chrome's Developer Tools is a crucial component that provides developers with comprehensive insights into the security aspects of web applications. Upon accessing the Security panel, developers are presented with a wealth of information and tools to assess and enhance the security posture of their web applications.
One of the primary functionalities of the Security panel is its ability to analyze the security of the current webpage, including the presence of secure connections, valid SSL certificates, and potential security vulnerabilities. By examining the Security panel, developers can verify whether the webpage is served over a secure HTTPS connection, ensuring the confidentiality and integrity of data transmitted between the client and the server. Additionally, the Security panel provides detailed information about the SSL certificate used by the webpage, including its validity, issuer, and encryption algorithms, enabling developers to validate the authenticity and robustness of the cryptographic protections in place.
Furthermore, the Security panel offers insights into potential security issues such as mixed content, insecure origins, and outdated security protocols. By highlighting these security concerns, developers can proactively address vulnerabilities that may compromise the security and privacy of their web applications. Additionally, the Security panel integrates with other Developer Tools components, such as the Network panel and the Console, enabling developers to correlate security assessments with network activity and JavaScript execution, facilitating comprehensive debugging and optimization of web application security.
In addition to analyzing the security of the current webpage, the Security panel provides features for simulating various security scenarios, enabling developers to evaluate the behavior of web applications under different security configurations. This includes the ability to simulate secure and insecure origins, test the behavior of mixed content, and assess the impact of security policies on the functionality of the web application. By simulating security scenarios and analyzing security metrics, developers can ensure that their web applications adhere to best practices and security standards, ultimately enhancing the resilience and trustworthiness of their applications.
Overall, the Security panel within Chrome's Developer Tools serves as an invaluable resource for assessing and enhancing the security of web applications. Whether you're validating secure connections, addressing security vulnerabilities, or simulating security scenarios, the Security panel equips you with the necessary tools to elevate the security posture of your web applications and build trust with your users.
Audits Panel
The Audits panel in Chrome's Developer Tools is a comprehensive tool that empowers developers to assess and optimize the performance, accessibility, best practices, SEO, and progressive web app (PWA) aspects of web applications. Upon accessing the Audits panel, developers are presented with a powerful suite of features and capabilities that enable the evaluation and enhancement of various critical aspects of web application development.
One of the primary functionalities of the Audits panel is its ability to perform comprehensive audits of web applications, providing developers with actionable insights and recommendations to improve the overall quality and user experience of their applications. By initiating an audit, developers can assess critical performance metrics, accessibility standards, adherence to best practices, search engine optimization (SEO) factors, and progressive web app (PWA) requirements. This holistic evaluation allows developers to identify potential issues, inefficiencies, and opportunities for optimization across multiple dimensions of web application development.
Furthermore, the Audits panel offers a range of audit categories, each focusing on specific aspects of web application quality and user experience. These categories include Performance, Accessibility, Best Practices, SEO, and PWA, enabling developers to tailor their audits to address specific concerns and requirements. By leveraging these audit categories, developers can gain a comprehensive understanding of the strengths and weaknesses of their web applications, facilitating targeted optimization efforts and informed decision-making.
In addition to performing audits, the Audits panel provides detailed reports that highlight audit results, including actionable recommendations, performance metrics, and visualizations. These reports offer developers a clear and structured overview of the audit findings, enabling them to prioritize optimization efforts, track improvements, and ensure that their web applications adhere to industry standards and best practices.
Moreover, the Audits panel integrates seamlessly with other Developer Tools components, such as the Performance panel, the Lighthouse tool, and the Console, enabling developers to correlate audit results with performance metrics, JavaScript execution, and network activity. This integration facilitates comprehensive debugging and optimization of web applications, empowering developers to address identified issues and enhance the overall quality and user experience of their applications.
In essence, the Audits panel within Chrome's Developer Tools serves as a pivotal resource for evaluating and optimizing critical aspects of web applications, including performance, accessibility, best practices, SEO, and progressive web app (PWA) requirements. Whether you're assessing performance bottlenecks, addressing accessibility concerns, optimizing for search engines, or enhancing the PWA capabilities of your web applications, the Audits panel equips you with the necessary tools to elevate the quality and user experience of your web applications.
Conclusion
In conclusion, Chrome's Developer Tools stand as a cornerstone for web developers, offering a rich set of features and functionalities that empower them to inspect, debug, and optimize web applications with unparalleled precision and efficiency. From the foundational Elements panel, which allows for real-time manipulation of HTML and CSS, to the multifaceted Audits panel, which provides comprehensive insights into performance, accessibility, best practices, SEO, and progressive web app (PWA) aspects, the Dev Tools offer a holistic toolkit for enhancing the quality and user experience of web applications.
The seamless integration of the various panels within the Developer Tools, including the Console, Sources, Network, Performance, Memory, Application, Security, and Audits panels, creates a unified environment that enables developers to correlate different aspects of web development, facilitating comprehensive debugging, optimization, and validation of web applications.
By leveraging the Developer Tools, developers can gain valuable insights into the inner workings of web applications, diagnose performance bottlenecks, optimize resource loading, ensure security best practices, and enhance the overall quality and user experience of their applications. The interactive and visual nature of the Dev Tools empowers developers to experiment, analyze, and iterate on their code and designs, ultimately leading to the creation of high-performing, accessible, and secure web experiences.
Furthermore, the Developer Tools serve as a platform for continuous improvement, allowing developers to track and monitor the impact of optimizations, validate adherence to industry standards, and ensure that their web applications deliver exceptional performance, accessibility, and user experience across various devices and usage scenarios.
In essence, Chrome's Developer Tools are not just a set of utilities; they are a catalyst for innovation and excellence in web development. Whether you're a front-end developer fine-tuning the layout and styling of a webpage, a back-end developer optimizing network performance and debugging JavaScript code, or a digital marketer striving to enhance the visibility and accessibility of web content, the Developer Tools provide a unified platform to cater to your specific needs, ultimately elevating the quality and impact of web applications in the digital landscape.