Introduction
Debugging is an essential aspect of web development, allowing developers to identify and fix issues within their code. In the realm of web development, Google Chrome stands out as a popular and powerful browser, offering a suite of built-in tools that streamline the debugging process. By leveraging these tools effectively, developers can efficiently diagnose and resolve a wide range of issues, ensuring the smooth functionality of their web applications.
In this article, we will explore the various methods and tools available within the Google Chrome browser for debugging. From the versatile console to the comprehensive performance and memory panels, we will delve into each tool's functionalities and how they can be utilized to pinpoint and rectify coding errors. By understanding the capabilities of these debugging tools, developers can enhance their efficiency and proficiency in troubleshooting web applications.
Whether you are a seasoned developer or just embarking on your coding journey, mastering the art of debugging in Chrome can significantly elevate your web development skills. With a keen understanding of the browser's debugging tools, you can streamline your workflow, identify and resolve issues swiftly, and ultimately deliver seamless and optimized web experiences to your users.
Join us as we embark on a journey through the intricacies of Chrome's debugging capabilities, empowering you to harness the full potential of these tools and elevate your web development prowess. Let's dive into the world of Chrome debugging and unlock the secrets to efficient and effective issue resolution.
Using Console for Debugging
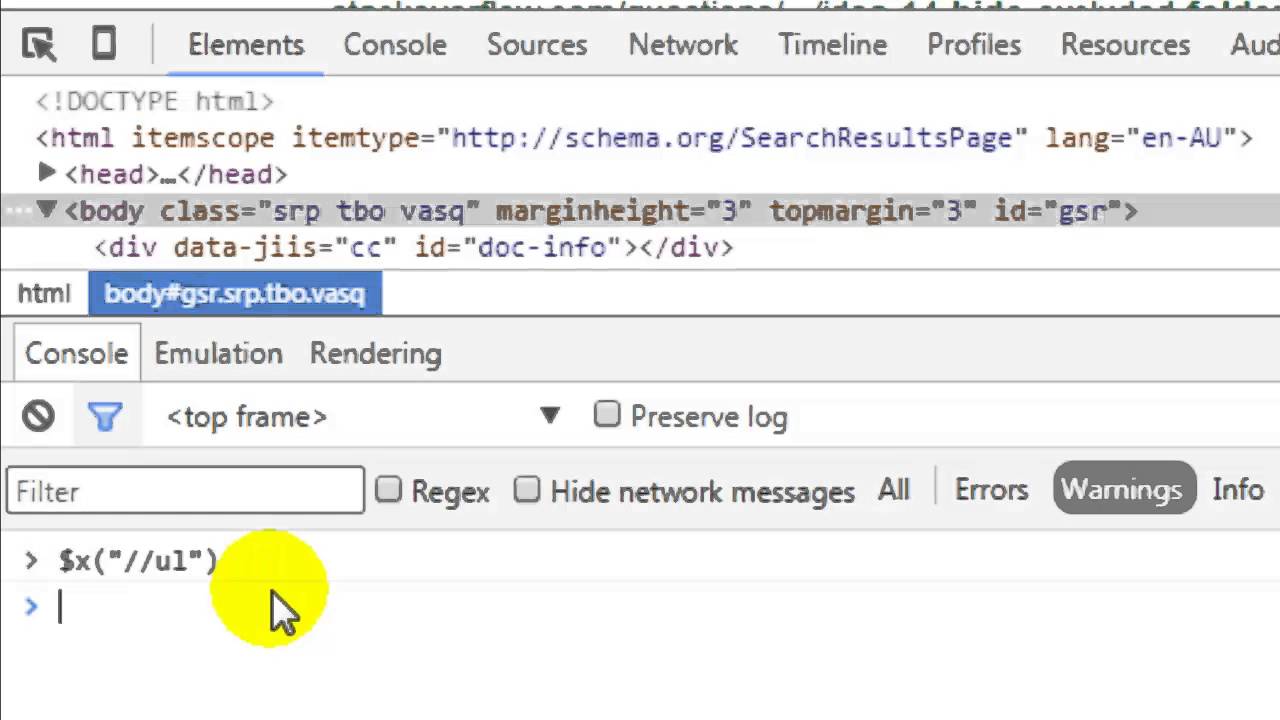
The console is a fundamental tool for debugging in Google Chrome, offering a versatile and powerful interface for identifying and resolving coding issues. By leveraging the console, developers can execute JavaScript code, log messages, inspect variables, and diagnose errors within their web applications. Let's delve into the various functionalities of the console and explore how it can be utilized for effective debugging.
Executing JavaScript Code
One of the primary uses of the console is to execute JavaScript code directly within the browser. This feature enables developers to test and validate snippets of code, making it an invaluable tool for experimenting with new functionalities or troubleshooting specific code segments. By entering JavaScript commands into the console, developers can swiftly evaluate their behavior and identify any potential errors or unexpected outcomes.
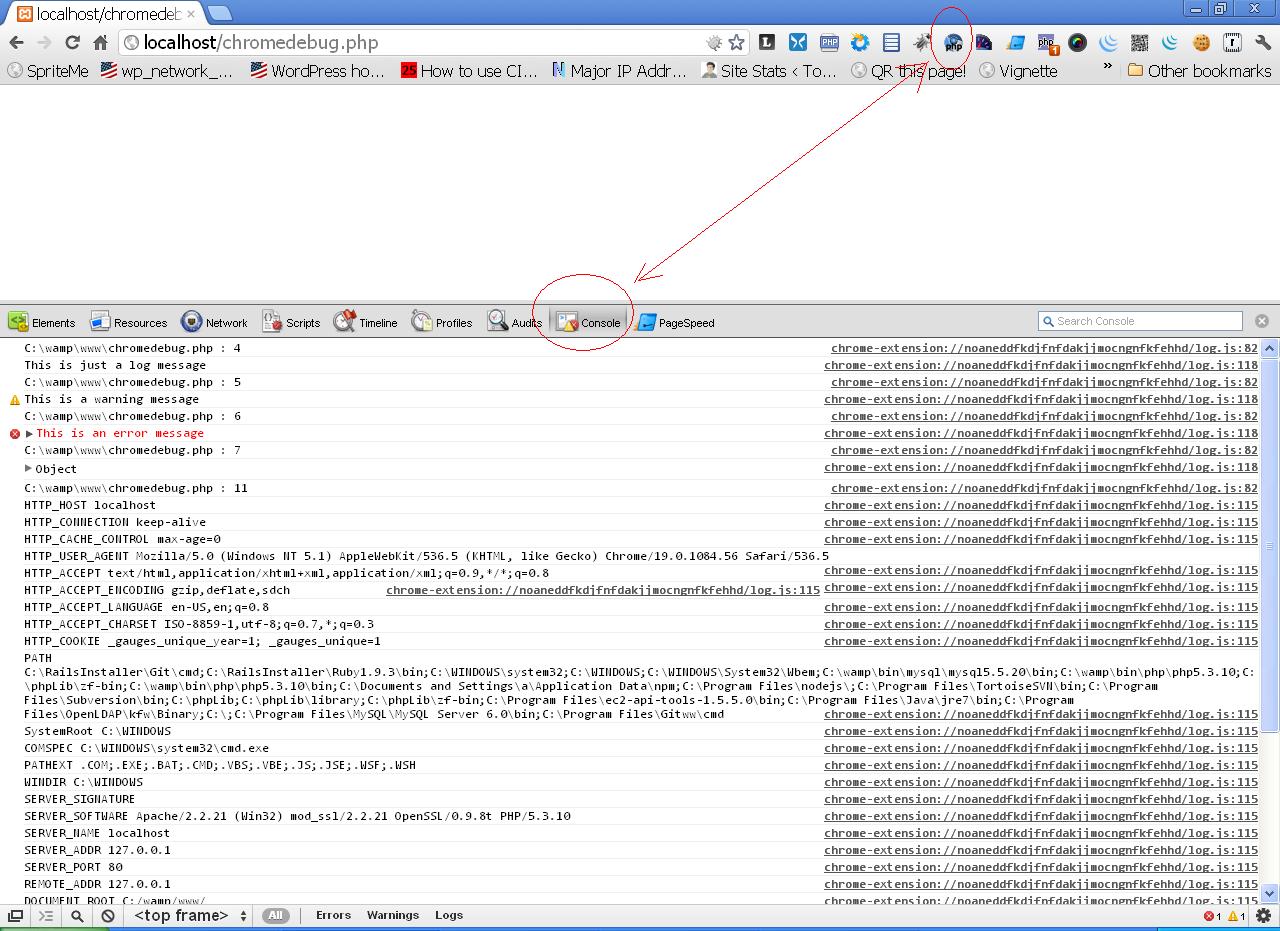
Logging Messages and Variables
The console allows developers to log messages and variables, providing crucial insights into the behavior of their code. By strategically placing log statements within their scripts, developers can track the flow of execution, monitor variable values, and pinpoint potential issues. This approach facilitates a granular understanding of how the code operates, enabling developers to isolate and address errors effectively.
Debugging JavaScript Errors
When errors occur within JavaScript code, the console serves as a central hub for identifying and addressing these issues. By logging error messages and utilizing the console's error-handling capabilities, developers can gain visibility into the root causes of errors, facilitating targeted debugging efforts. Additionally, the console provides detailed stack traces, aiding in the identification of the precise location and sequence of errors within the codebase.
Interactive Debugging with Breakpoints
In addition to logging and executing code, the console supports interactive debugging through the use of breakpoints. By setting breakpoints within the code, developers can pause execution at specific points and inspect variable values, call stacks, and other relevant information. This interactive debugging approach empowers developers to analyze the state of the application at critical junctures, facilitating the identification and resolution of complex issues.
In summary, the console in Google Chrome is a multifaceted tool that plays a pivotal role in the debugging process. From executing JavaScript code to logging messages, tracking variables, and facilitating interactive debugging, the console offers a comprehensive suite of features for diagnosing and resolving coding issues. By mastering the intricacies of the console, developers can elevate their debugging proficiency and streamline the process of identifying and rectifying errors within their web applications.
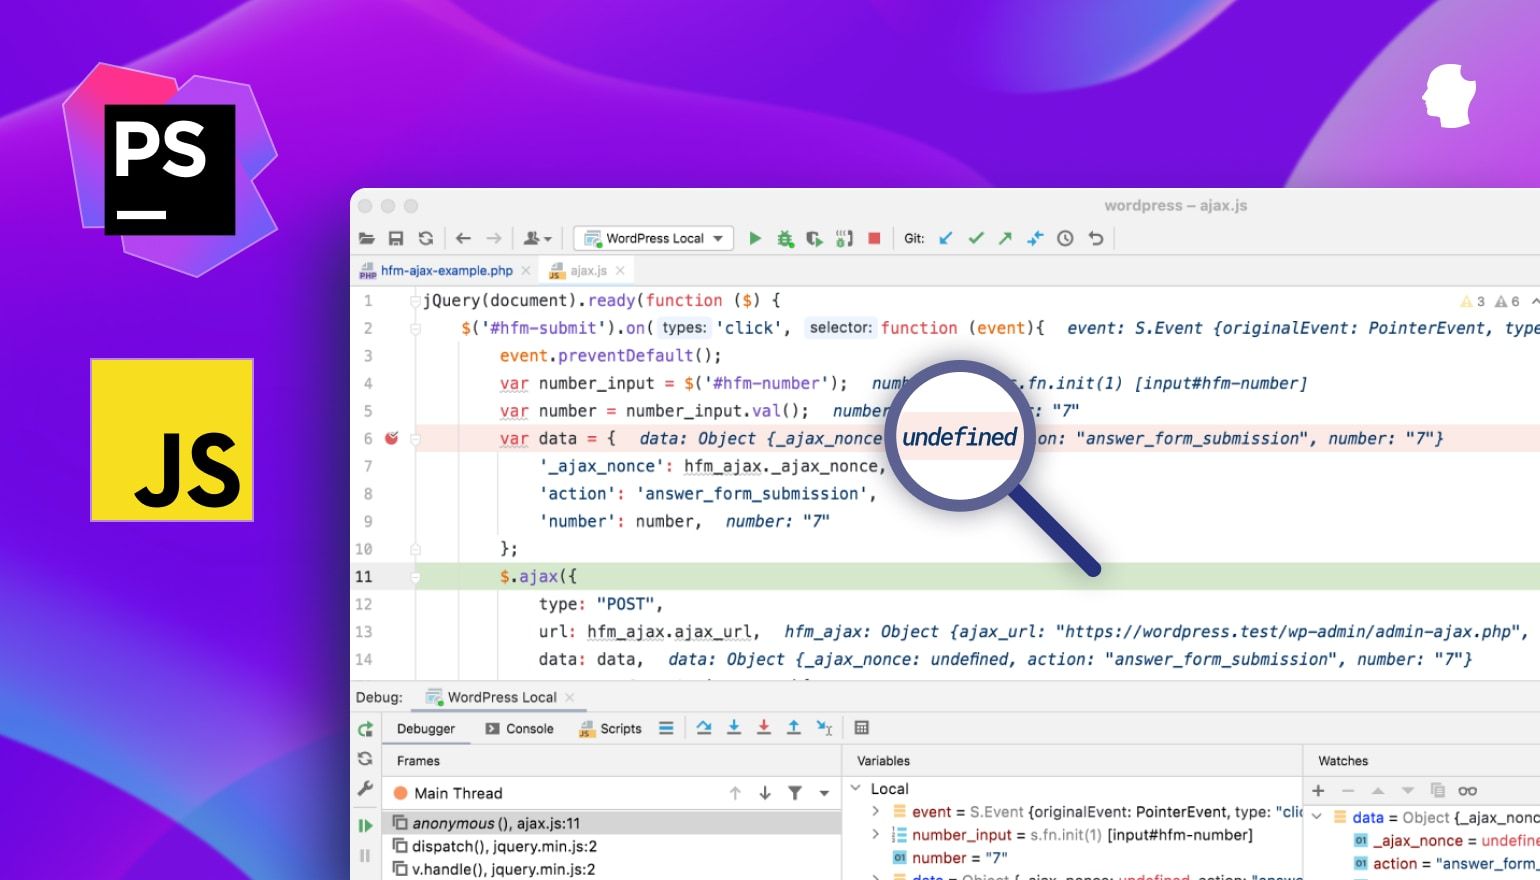
Using Breakpoints for Debugging
Breakpoints are a fundamental feature of the debugging arsenal within Google Chrome, offering developers a powerful mechanism for pausing the execution of their code at specific points and inspecting the application's state. By strategically placing breakpoints within their scripts, developers can gain invaluable insights into the behavior of their code, identify potential issues, and facilitate targeted debugging efforts.
Setting Breakpoints
To leverage breakpoints effectively, developers can simply navigate to the Sources panel within the Chrome DevTools and locate the desired JavaScript file. Once the file is open, they can identify the precise line of code where they intend to pause execution and set a breakpoint by clicking on the line number. This straightforward process enables developers to establish breakpoints at critical junctures within their codebase, allowing for detailed inspection and analysis.
Pausing Execution
Upon setting breakpoints, developers can initiate the execution of their web application. When the code reaches a breakpoint, the execution halts, providing developers with an opportunity to examine the application's state at that specific moment. This pause in execution empowers developers to inspect variable values, assess the call stack, and gain a comprehensive understanding of the code's behavior, thereby facilitating the identification of potential errors or unexpected outcomes.
Interactive Debugging
Breakpoints facilitate interactive debugging, enabling developers to delve into the inner workings of their code and diagnose complex issues. By pausing execution at strategic points, developers can step through the code, observe the sequence of operations, and pinpoint the root causes of errors. This interactive debugging approach empowers developers to gain granular insights into the behavior of their applications, fostering a systematic and targeted approach to issue resolution.
Conditional Breakpoints
In addition to standard breakpoints, Chrome's DevTools offer the functionality of conditional breakpoints, allowing developers to specify conditions under which the execution should pause. This advanced feature enables developers to set breakpoints that activate only when specific conditions are met, providing a nuanced approach to debugging complex and dynamic codebases.
In summary, breakpoints serve as a cornerstone of the debugging process within Google Chrome, offering developers a robust mechanism for pausing execution, inspecting code behavior, and diagnosing issues. By mastering the art of setting and utilizing breakpoints effectively, developers can elevate their debugging proficiency, streamline issue resolution, and ultimately deliver optimized and seamless web applications to their users.
Using Sources Panel for Debugging
The Sources panel in Google Chrome's DevTools is a versatile and powerful tool that empowers developers to delve deep into the intricacies of their codebase, facilitating comprehensive debugging and issue resolution. By leveraging the functionalities offered within the Sources panel, developers can gain valuable insights into the behavior of their JavaScript, CSS, and other web assets, enabling them to identify and rectify coding issues effectively.
Navigating the Codebase
One of the primary capabilities of the Sources panel is its ability to provide a structured view of the application's source code. Developers can navigate through the various files comprising their web application, gaining a holistic understanding of the codebase's organization and structure. This feature facilitates swift access to specific code segments, enabling developers to pinpoint and address issues with precision.
Setting and Managing Breakpoints
The Sources panel offers seamless integration with breakpoints, allowing developers to set, manage, and navigate breakpoints within their code. By simply clicking on the line numbers, developers can establish breakpoints at critical junctures, pausing the execution of their code and gaining insights into its behavior. Additionally, the panel provides intuitive controls for managing breakpoints, empowering developers to fine-tune their debugging efforts with ease.
Live Editing and Persisting Changes
Developers can leverage the live editing capabilities of the Sources panel to make real-time modifications to their code, observing the immediate impact on the application's behavior. This feature streamlines the process of experimenting with code adjustments and validating their effects, fostering an iterative approach to issue resolution. Furthermore, the panel facilitates the persistence of code changes, allowing developers to save modified files directly within the DevTools interface.
Call Stack and Scope Inspection
Within the Sources panel, developers can explore the call stack and inspect variable scopes, gaining a comprehensive understanding of the code's execution flow and the state of variables at different points in time. This functionality enables developers to trace the sequence of operations within their code and analyze the values of variables, empowering them to identify and address issues related to variable manipulation and function execution.
In essence, the Sources panel in Google Chrome's DevTools serves as a comprehensive hub for code navigation, breakpoint management, live editing, and in-depth code analysis. By harnessing the capabilities of the Sources panel, developers can elevate their debugging prowess, streamline issue resolution, and ultimately deliver robust and optimized web applications to their users.
Using Network Panel for Debugging
The Network panel within Google Chrome's DevTools is a vital resource for developers seeking to optimize the performance and functionality of their web applications. While its primary function is to provide insights into network activity, it also serves as a powerful tool for debugging, enabling developers to diagnose and address a wide array of issues related to network requests, responses, and overall application performance.
Monitoring Network Activity
The Network panel offers real-time visibility into the network activity of a web application, allowing developers to monitor the initiation and completion of network requests. By inspecting the timeline of requests, developers can identify potential bottlenecks, latency issues, or failed requests that may impact the application's functionality. This comprehensive view of network activity serves as a valuable starting point for diagnosing performance-related issues and optimizing the application's network interactions.
Request and Response Inspection
Developers can delve into the details of individual network requests and responses, gaining insights into headers, payloads, and status codes. This level of granularity enables developers to identify anomalies, such as unexpected response formats, missing headers, or excessive response times. By scrutinizing the specifics of network interactions, developers can pinpoint potential issues and take targeted measures to rectify them, ultimately enhancing the reliability and efficiency of their web applications.
Throttling and Performance Analysis
The Network panel facilitates the emulation of various network conditions, allowing developers to simulate scenarios such as low bandwidth or high latency. By throttling the network, developers can assess the application's behavior under adverse conditions, uncovering potential performance bottlenecks and ensuring that the application remains responsive and functional across diverse network environments. This proactive approach to performance analysis empowers developers to preemptively address network-related issues and deliver a seamless user experience.
Resource Loading and Caching Insights
In addition to network requests, the Network panel provides visibility into resource loading and caching behavior. Developers can analyze the loading times of individual resources, assess caching directives, and optimize resource delivery to minimize load times and enhance the application's responsiveness. By scrutinizing resource loading patterns, developers can identify opportunities for optimization, ensuring that the application leverages caching mechanisms effectively and delivers content expediently to users.
In summary, the Network panel in Google Chrome's DevTools serves as a multifaceted tool for debugging network-related issues and optimizing the performance of web applications. By monitoring network activity, inspecting requests and responses, analyzing performance under varied conditions, and optimizing resource loading, developers can elevate the reliability, efficiency, and responsiveness of their web applications, ultimately delivering a superior user experience.
Using Performance Panel for Debugging
The Performance panel in Google Chrome's DevTools is a comprehensive tool that empowers developers to analyze and optimize the performance of their web applications. By leveraging the functionalities offered within the Performance panel, developers can gain valuable insights into various aspects of application performance, identify bottlenecks, and streamline the execution of their code.
Recording and Analyzing Performance
One of the primary capabilities of the Performance panel is its ability to record and analyze the runtime performance of web applications. Developers can initiate performance recordings, capturing a detailed timeline of events such as JavaScript execution, rendering, and network activity. This comprehensive view of application performance enables developers to identify potential inefficiencies, excessive resource utilization, and performance bottlenecks that may impact the user experience.
Timeline Analysis and Visualization
The Performance panel provides a visual timeline of events, allowing developers to analyze the sequence and duration of various operations within their web applications. By scrutinizing the timeline, developers can pinpoint areas of concern, such as prolonged script execution, rendering bottlenecks, or excessive network activity. This visual representation of performance data facilitates a nuanced understanding of the application's behavior, empowering developers to make informed decisions regarding performance optimization.
CPU and Memory Profiling
Developers can delve into CPU and memory profiling within the Performance panel, gaining insights into resource utilization and potential inefficiencies within their code. By analyzing CPU profiles, developers can identify functions or operations that consume excessive processing power, optimizing critical code segments to enhance overall performance. Similarly, memory profiling enables developers to pinpoint memory leaks, inefficient memory allocation, and excessive memory usage, fostering a proactive approach to memory management and application stability.
User Interaction Analysis
The Performance panel offers the capability to analyze user interactions and their impact on application performance. By correlating user input with performance metrics, developers can gain insights into the responsiveness of their applications, identifying areas where user interactions may lead to performance degradation. This analysis empowers developers to optimize event handling, rendering, and other critical aspects of user interaction, ensuring a seamless and responsive user experience.
In essence, the Performance panel within Google Chrome's DevTools serves as a powerful resource for diagnosing and optimizing the performance of web applications. By recording and analyzing performance, visualizing performance data, profiling CPU and memory usage, and scrutinizing user interactions, developers can elevate the efficiency, responsiveness, and overall user experience of their web applications, ultimately delivering superior performance to their users.
Using Memory Panel for Debugging
The Memory panel in Google Chrome's DevTools serves as a crucial tool for diagnosing and optimizing memory-related issues within web applications. By leveraging the functionalities offered within the Memory panel, developers can gain valuable insights into memory allocation, usage patterns, and potential memory leaks, enabling them to streamline memory management and enhance the stability of their applications.
Memory Snapshot and Analysis
One of the primary capabilities of the Memory panel is its ability to capture memory snapshots, providing developers with a detailed view of memory allocation and usage at specific points in time. By initiating memory snapshots during critical application states, developers can analyze memory consumption, identify potential inefficiencies, and gain insights into memory allocation patterns. This comprehensive analysis empowers developers to pinpoint areas of excessive memory usage and optimize memory allocation strategies to enhance application performance.
Heap Profiling and Allocation Tracking
The Memory panel offers heap profiling and allocation tracking functionalities, enabling developers to delve into the memory allocation behavior of their applications. By scrutinizing heap profiles, developers can identify memory-intensive operations, inefficient memory allocation patterns, and potential sources of memory bloat. Additionally, allocation tracking provides visibility into the dynamic allocation and deallocation of memory, facilitating a granular understanding of memory usage and empowering developers to optimize memory management strategies.
Memory Leak Detection and Analysis
Memory leaks can significantly impact the stability and performance of web applications. The Memory panel equips developers with the tools to detect and analyze memory leaks, enabling them to identify areas where memory is not properly released, leading to gradual memory consumption. By scrutinizing memory allocation and deallocation patterns, developers can pinpoint potential memory leaks, optimize memory release mechanisms, and ensure efficient memory utilization, ultimately enhancing the stability and reliability of their applications.
Garbage Collection Insights
The Memory panel provides insights into garbage collection events, allowing developers to analyze the impact of garbage collection on memory usage and application performance. By monitoring garbage collection cycles, developers can optimize memory management strategies, minimize the frequency of garbage collection events, and ensure efficient memory cleanup. This proactive approach to garbage collection analysis empowers developers to streamline memory utilization, mitigate performance bottlenecks, and deliver optimized memory management within their applications.
In essence, the Memory panel within Google Chrome's DevTools serves as a comprehensive resource for diagnosing and optimizing memory-related issues within web applications. By capturing memory snapshots, profiling memory allocation, detecting memory leaks, and analyzing garbage collection events, developers can elevate the stability, efficiency, and overall user experience of their web applications, ultimately delivering superior memory management and application performance to their users.
Conclusion
In conclusion, mastering the art of debugging in Google Chrome is a pivotal skill for web developers seeking to deliver robust, efficient, and seamless web applications. The suite of built-in tools within Chrome's DevTools, including the console, breakpoints, sources panel, network panel, performance panel, and memory panel, provides developers with a comprehensive arsenal for diagnosing and resolving coding issues.
By harnessing the capabilities of the console, developers can execute JavaScript code, log messages, and interactively debug their applications, gaining valuable insights into the behavior of their code. The strategic use of breakpoints empowers developers to pause execution at critical junctures, inspect variables, and analyze the application's state, facilitating targeted debugging efforts.
The sources panel offers a structured view of the codebase, seamless breakpoint management, live editing capabilities, and in-depth code analysis, enabling developers to navigate and scrutinize their code with precision. The network panel provides real-time visibility into network activity, request and response inspection, performance analysis, and resource loading insights, empowering developers to optimize network interactions and enhance application responsiveness.
Furthermore, the performance panel facilitates performance recording and analysis, timeline visualization, CPU and memory profiling, and user interaction analysis, enabling developers to identify and address performance bottlenecks, ensuring optimal application responsiveness. The memory panel equips developers with tools for memory snapshot and analysis, heap profiling, memory leak detection, and garbage collection insights, enabling them to optimize memory management and enhance application stability.
By leveraging these powerful debugging tools, developers can streamline their workflow, identify and rectify coding issues swiftly, and ultimately deliver optimized and seamless web experiences to their users. The mastery of Chrome's debugging capabilities empowers developers to elevate their proficiency, efficiency, and the overall quality of their web applications, setting the stage for enhanced user satisfaction and success in the dynamic landscape of web development.