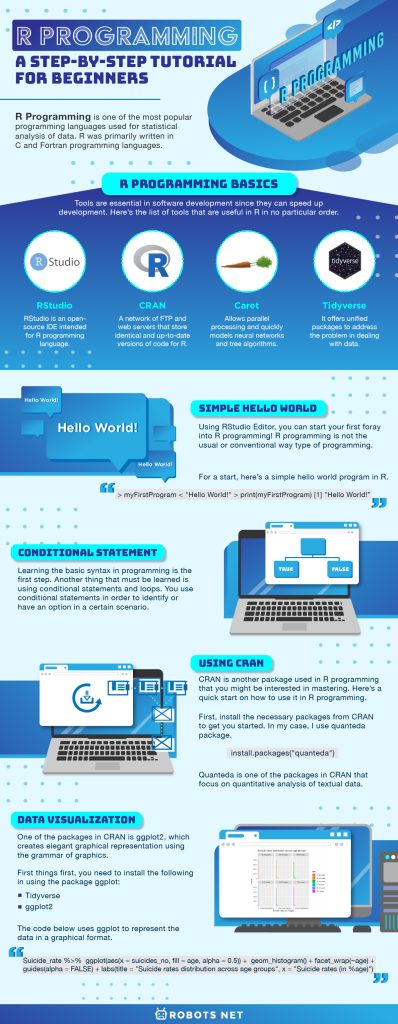
In this article, we will explore another type of programming language used in the data science field. Apart from the Python programming language, R programming is one of the most popular programming languages used for statistical analysis of data. R programming is not only limited to statistical analysis but also expand its functionalities to a graphical representation of data. R was primarily written in C and Fortran programming languages.
A group of statisticians, also known as R Development Core Team, developed R programming and under GNU General Public License 4 distribution. R’s reputation in the field of data science is quite impressive. R programming is quite unique in implementation compared to C, Pascal, Python, Java, and other programming languages.
Unlike other programming languages, R’s implementation works in a manner that user commands are directly executed without the necessity to build a complete program to execute it. Compared to Python, R’s syntax is very simple and spontaneous. There are also noticeable differences between the C and R programming languages. In order to execute by the compiler, C needs to have a semi-colon(;). Meanwhile, R programming needs parentheses() in order to execute the script.
R Programming Basics
Tools are essential in software development since they can speed up development. Before we dig into the basic syntax, let me discuss the different tools used in R programming. These tools help improve your experience with the programming language in different ways. Here’s the list of tools that are useful in R in no particular order.
RStudio
RStudio is one of the most popular tools in R programming. RStudio is an open-source IDE intended for R programming language. It has an impressive UI that allows you to see every detail of the project you’re working on.
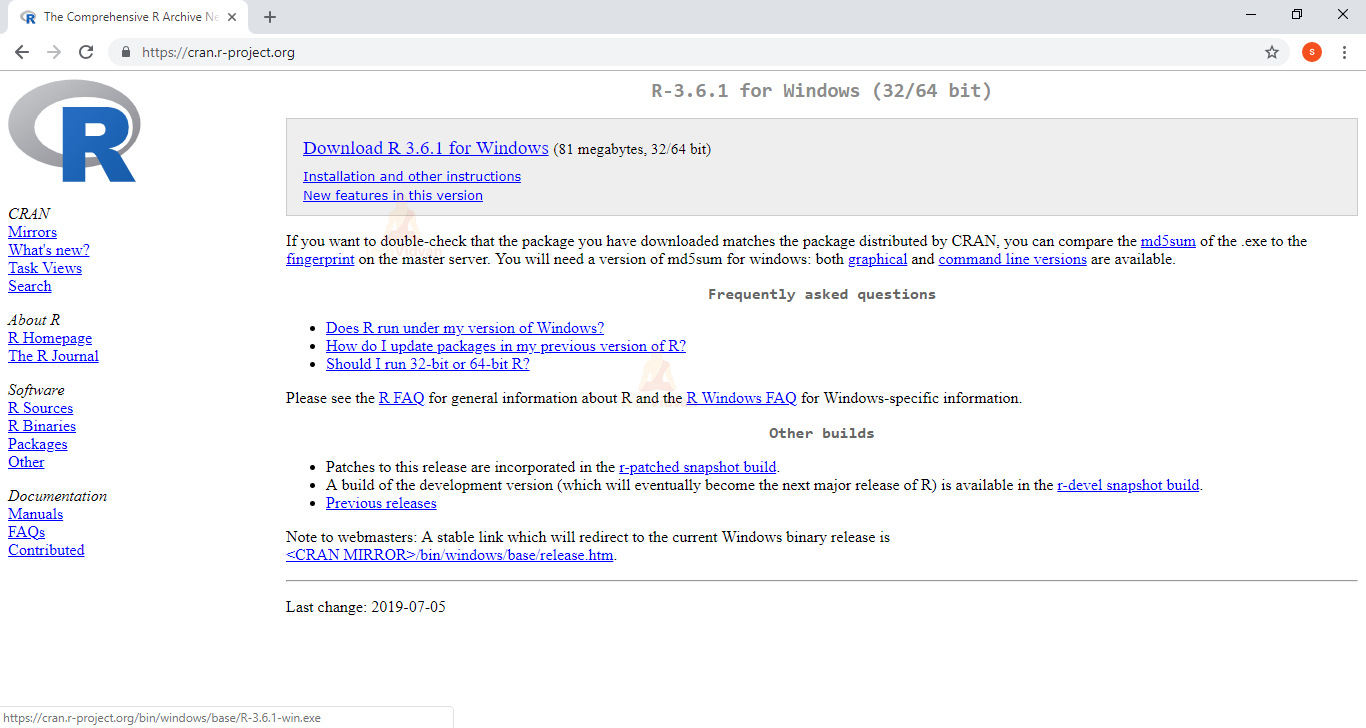
CRAN
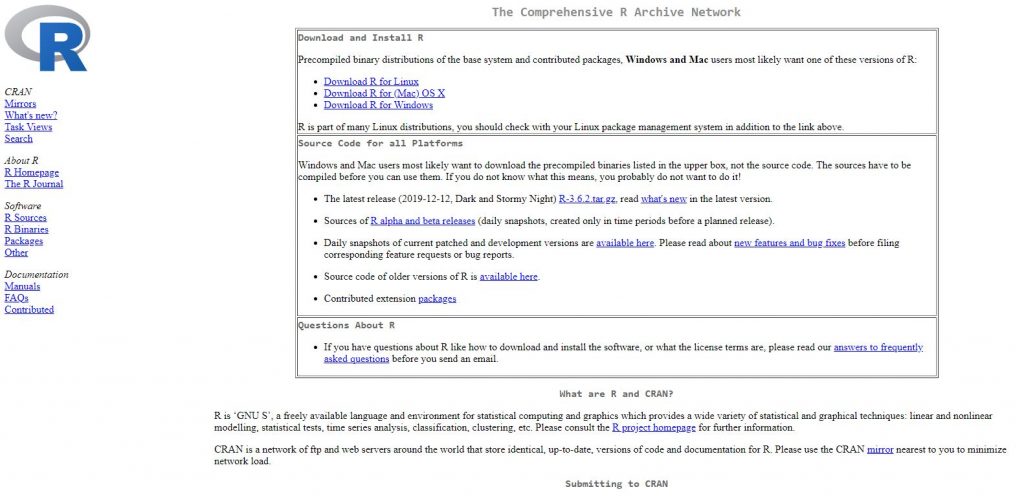
CRAN is a network of FTP and web servers that store identical and up-to-date versions of code and documentation for R.
Caret
Caret is one of the fundamental toolbox in R. Caret allows parallel processing and quickly models neural networks and tree algorithms. Caret’s package includes the following algorithms: Neural networks, Decision trees, Random Forest, AdaBoost, Stochastic gradient, SVM, and other machine learning algorithms.
Tidyverse
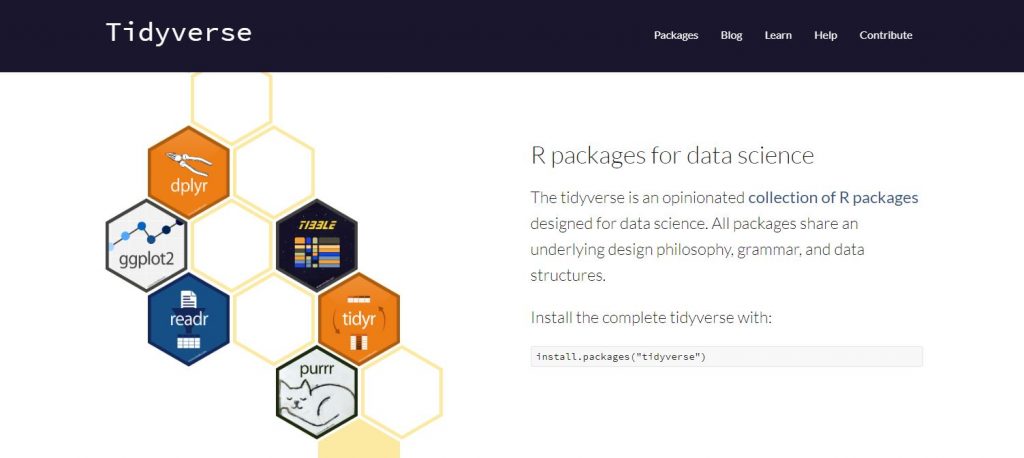
Tidyverse offers another tool needed for data science. It offers unified packages to address the problems in dealing with data. The following are some of the packages that come with Tidyverse to make the process easier:
- ggplot2
- tidyr
- purrr
- tibble
- dplyr
- readr
Simple Hello World
Using RStudio Editor, you can start your first foray into R programming! R programming is not the usual or conventional way type of programming. So, let’s learn the basics!
For a start, here’s a simple hello world program in R.
> myFirstProgram < "Hello World!"> print(myFirstProgram)[1] "Hello World!”
In the line above, the first line, you can assign “Hello World” to variable myFristProgram. In the second line, the “Hello World” word prints. The third line is output. In this example, R programming executes in a scripted manner.
Conditional Statement
Learning the basic syntax in programming is the first step. Another thing that must be learned is using conditional statements and loops. You use conditional statements in order to identify or have an option in a certain scenario. Like any other programming language, R also uses the IF Statement for conditional situations. Here’s the basic or general format of conditional statements using the R programming language:
If(condition to check){Statement to execute} else{Statement to execute }
In the above set of syntax, the IF statement tells R that there are conditions that must be checked and returned TRUE in order to execute the statement underneath, ELSE it will execute once the condition does not satisfy the condition to check.
glass_A <- 10glass_B <- 20If(glass_A > glass_B){print(“Glass A contains water that belongs to Lorly”)} else {print(“Glass B contains apple juice that belongs to Princess”)}
Output:
“Glass B contains apple juice that belongs to Princess”
In the example above, the first two lines assign values to the variable namely: glass_A and glass_B. The If-statement in the above code identifies which one is greater than the other, the condition glass_A> glass_B, and the machine will evaluate if the values assigned in glass_A is greater than the value of glass_B. Since it is obvious that the value of glass_A is equal to 10 and glass_B is equal to 20, 10 is not greater than 20 which makes the statement false, else then is being executed.
Using CRAN
CRAN is another package used in R programming that you might be interested in mastering. Here’s a quick start on how to use it in R programming.
First, install the necessary packages from CRAN to get you started. In my case, I use quanteda package.
install.packages("quanteda")
Quanteda is one of the packages in CRAN that focus on quantitative analysis of textual data. Other additional recommended packages to install are readtext, spacy, quanteda.corpora, and quanteda.dictionaries.
Use getwd() script in order to know the current working directory in your R studio. Since you use quanteda for textual analysis, you need to know how to import data to your R. So here’s how to import data in quanteda:
data_path <- system.file("additional_data/", package = "readtext")
In the example, data_path is the location of files in my computer that has a package named readtext package.
In the character vector, data_char_ukimmig2010 is a data that consists of sections of British election manifestos on immigration and asylum. This example is from quanteda documentation.
corp_immig <- corpus(data_char_ukimmig2010,docvars = data.frame(party = names(data_char_ukimmig2010)))summary(corp_immig)
When I try to execute the code above, here’s the output I gathered:
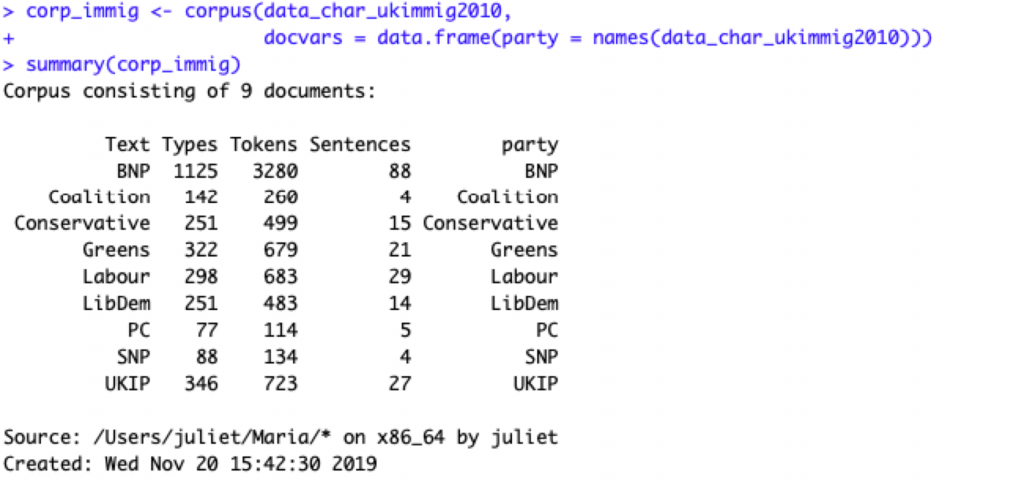
The data shows a corpus-based text ready for analysis. Aside from corpus-based, quanteda is also capable of Token analysis.
corp_immig <- corpus(data_char_ukimmig2010)toks_immig <- tokens(corp_immig)toks <- tokens(data_char_ukimmig2010) head(toks[[1]], 50)
In the code, the first line assigns a corpus in a variable. The variable which contains the corpus is being passed to a token.
Data Visualization
In visualizing your data, it would be best to represent it in a graphical way. One of the packages in CRAN is ggplot2, which creates elegant graphical representation using the grammar of graphics. In the previous article entitled, Machine Learning with Python: A Step-by-Step Tutorial for Beginners, you can implement data visualization using the ggplot package in Python. Let’s try to explore ggplot using R programming language!
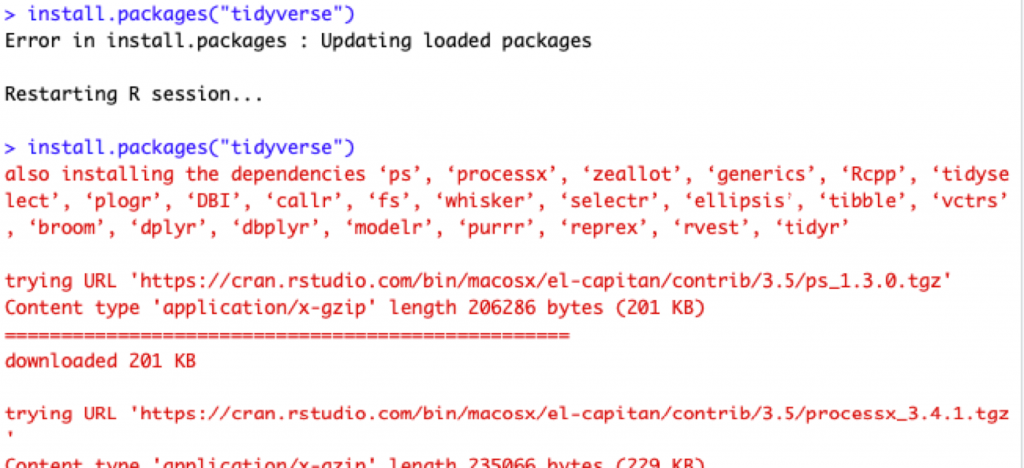
First things first, you need to install the following in using the package ggplot:
- Tidyverse
- ggplot2
Here’s a screenshot of what to expect during installation for both Tidyverse and ggplot2:
After installing the packages and necessary libraries, here’s a simple way of importing CSV file to R programming.
Suicide_rate <- read.csv("/Users/juliet/Desktop/Technical Writing/master.csv",header=TRUE)head(Suicide_rate)str(Suicide_rate)
The code below uses ggplot to represent the data in a graphical format.
Suicide_rate %>%ggplot(aes(x = suicides_no, fill = age, alpha = 0.5)) +geom_histogram() + facet_wrap(~age) + guides(alpha = FALSE) +labs(title = "Suicide rates distribution across age groups", x = "Suicide rates (in %age)")
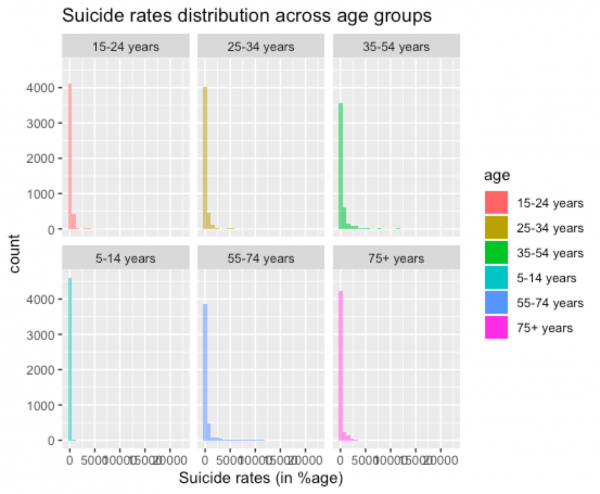
In this example, different age groups plots in a graphical way. This might not be a good representation, but what I want to emphasize in this article is the usage of ggplot or R programming in general. Using the ggplot package, you can incorporate beautification in your graphs, too.
Anyways, there are a lot of packages available that you can explore in CRAN or in R depending on your needs. Furthermore, most of these packages are open source and free. Don’t be afraid to use this resource out; you’ll be amazed at how it improves your programming process!