



The Sensors panel can be accessed through the Console drawer or via the Command Menu. Open the Command Menu with Control+Shift+P (or Command+Shift+P on Mac), type 'sensors', select 'Show Sensors', and press Enter. Alternatively, press Escape to open the drawer, click the three-dot menu next to Console, and select Sensors.
Where the chrome sensors override panel went
Chrome’s latest update shifted the Sensors panel from its former position as a top-level tab in the developer tools bottom pane to a hidden option inside the Console section. Previously, you could find it alongside other panels like “Network” or “Application” in the main toolbar. Now, it lives inside the Console area, which is the bottom section of the browser’s debugging interface that typically shows JavaScript output and errors. To access it, you can open the Command Menu with Control+Shift+P (or Command+Shift+P on Mac), type 'sensors', and select 'Show Sensors', or navigate to 'More tools' > 'Sensors' from the Customize menu. This change also affects related overrides: if you want to change browser timezone for testing, you now need to navigate through this lower section to find the Sensors panel, where timezone overrides are also located. Similarly, if you need to change time zone on Chrome for a specific test scenario, the Sensors panel remains the correct place to do it, just not in its old spot.
How to bring it back
Book the Sensors panel again by pressing the Escape key while the developer toolkit is open. This opens the Console pane at the bottom of the window. Inside that lower section, locate the Console tab and the three-dot menu icon (⋮) to its right. Click that three-dot menu, then select “Sensors” from the dropdown list. The Sensors pane will appear, allowing you to override geolocation, device orientation, and other settings. Use it now to override geolocation, device orientation, and even adjust time settings. For example, if you need to change the time on a Chromebook for testing purposes, use the Sensors panel to simulate a different timezone or date without altering the system clock. This same panel also lets you change browser timezone for cross-timezone testing, making it a versatile tool for web developers.
When the bottom pane is empty or sensors is missing from the list
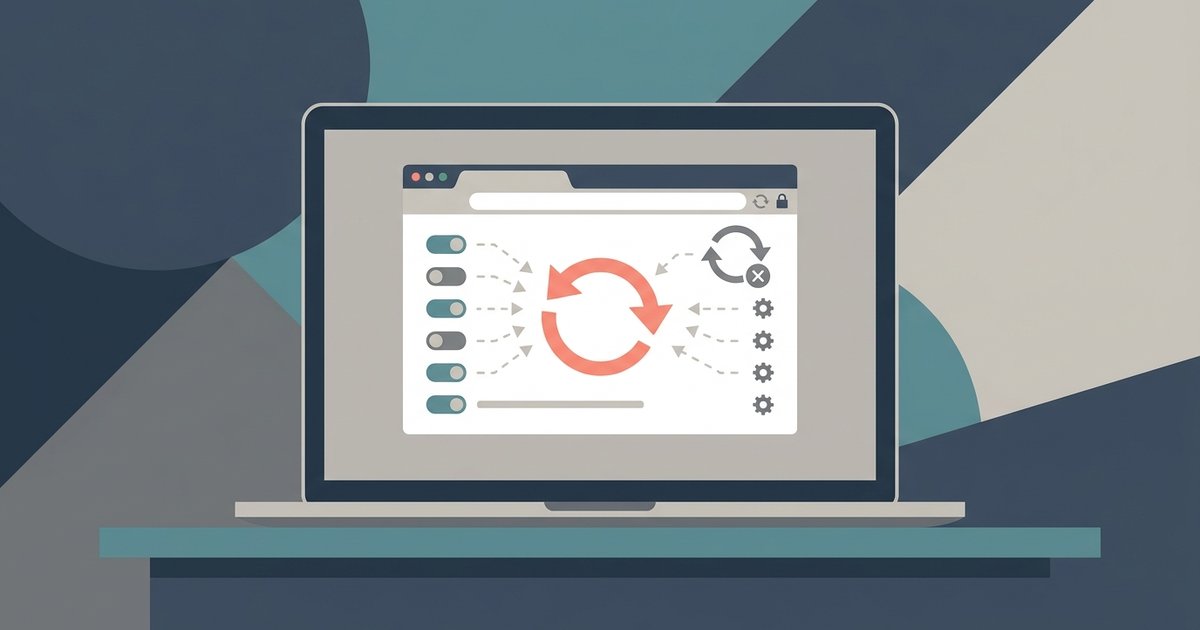
Arrive at the toolkit before you start troubleshooting: open it with F12 or Ctrl+Shift+I before pressing Escape. If you see an empty lower section, or if the three-dot menu does not include “Sensors” at all, skip the manual panel hunt and go straight to a full settings reset. Open the debugging tools, click the gear icon (Settings) in the top-right corner, then scroll to the bottom of the Preferences pane. Click the “Restore defaults and reload” button. This resets all panel visibility settings, including which panes appear in the bottom section. After the reload, press Escape again, click the three-dot menu, and “Sensors” should now appear in the list. If it still does not, close the toolkit completely, restart Chrome, and repeat the reset process. Note that the Sensors panel does not support overriding time on a Chromebook’s actual system clock; it only simulates timezone changes within the browser. Once the Sensors panel is restored, use it to change time zone on Chrome for any web app testing, but if you need to adjust the device’s real clock, try changing the time and time zone at the operating system level instead, giving you full control over location and time overrides again.
The Sensors panel was not removed, it was tucked behind the Console pane’s overflow menu, a relocation that breaks every existing workflow relying on the old top-level tab position.