Introduction
When it comes to managing and optimizing the performance of your Linux system, having a comprehensive understanding of your CPU (Central Processing Unit) is crucial. The CPU, often referred to as the “brain” of the computer, plays a critical role in executing instructions and processing data.
Being able to access detailed CPU information allows you to make informed decisions about system upgrades, troubleshoot performance issues, and ensure that your software is compatible with your hardware. Fortunately, there are several tools and commands available in Linux that provide valuable insights into your CPU’s specifications and performance metrics.
In this article, we will explore various methods to find CPU information in Linux. We will delve into commands such as lscpu, /proc/cpuinfo, dmidecode, top, hwinfo, and sensors, each offering unique advantages and different levels of detail.
Whether you are a system administrator, a software developer, or simply an enthusiast looking to gain a deeper understanding of your system, this guide will equip you with the knowledge needed to gather accurate and in-depth CPU information.
So, let’s embark on this informative journey and explore the different ways to discover CPU information in the Linux environment.
Checking CPU Info with the lscpu Command
One of the simplest yet powerful ways to obtain CPU information in Linux is by using the lscpu command. This command provides a concise summary of the CPU architecture, cores, threads, clock speed, cache size, and more.
To use the lscpu command, open a terminal and type “lscpu” followed by pressing the Enter key. The output will display various details about your CPU.
The information provided by the lscpu command includes:
- Architecture: The CPU architecture, such as x86, x86_64, or ARM.
- CPU(s): The total number of CPU sockets in the system.
- Thread(s) per core: The number of threads that can be executed simultaneously on each CPU core.
- Core(s) per socket: The number of cores per CPU socket.
- Socket(s): The number of physical CPU sockets in the system.
- Vendor ID: The CPU manufacturer’s ID.
- Model name: The model name of the CPU.
- CPU MHz: The current speed of the CPU in megahertz.
- Cache size: The size of the CPU cache.
- Virtualization: Indicates whether virtualization is supported.
By analyzing the output of the lscpu command, you can determine the capabilities and specifications of your CPU. This information can be useful when optimizing software for maximum performance, selecting compatible hardware components, or troubleshooting system issues related to CPU performance.
Furthermore, you can combine the lscpu command with various options to extract specific details. For example, using the “-p” option will display the CPU topology information, including the processor number, core number, and socket number.
The lscpu command provides an easy and straightforward way to gather essential CPU information in Linux. It is a valuable tool for both beginners and experienced users who want to gain insights into the capabilities and configuration of their system’s CPU.
Viewing CPU Information in the /proc/cpuinfo File
In Linux, the /proc/cpuinfo file provides a wealth of detailed information about each CPU core in your system. This file is a virtual file created by the kernel and is constantly updated with the latest CPU information.
To view the contents of the /proc/cpuinfo file, open a terminal and type cat /proc/cpuinfo. The output will display a plethora of information about the CPU(s) in your system, including:
- Processor model and family
- CPU speed and architecture
- CPU vendor and identifier
- Caching information
- Flags indicating various CPU features and capabilities
This information can be valuable for tasks such as determining the number of CPU cores, identifying the CPU model and architecture, or checking if specific CPU features, like virtualization or SSE instructions, are supported.
Additionally, you can extract specific details from the /proc/cpuinfo file by using commands such as grep and awk. For example, to display only the model name and number of CPU cores, you can use the command:
cat /proc/cpuinfo | grep -E "model name|cpu cores"This will filter the output and display only the lines containing “model name” and “cpu cores.”
Keep in mind that the information in the /proc/cpuinfo file may be overwhelming due to the extensive details it provides. If you need to extract specific information, using additional commands and filters can help you retrieve the relevant data more easily.
By examining the /proc/cpuinfo file, you can gain deep insights into the properties and capabilities of your CPU(s). Whether you need this information for troubleshooting purposes, software optimization, or hardware compatibility checks, the /proc/cpuinfo file provides a comprehensive overview of your system’s CPU configuration.
Analyzing CPU Details with the dmidecode Command
The dmidecode command is a powerful tool that allows you to extract detailed hardware information from the DMI (Desktop Management Interface) table in your system’s BIOS. With dmidecode, you can obtain specific CPU details that may not be available through other commands or files.
To use dmidecode, open a terminal and type sudo dmidecode -t processor. You may need to enter your password to execute this command as it requires superuser privileges. The output will provide comprehensive information about your CPU(s).
The information displayed by dmidecode includes:
- CPU Socket Information: The physical socket type of the CPU.
- Vendor and Version: The CPU manufacturer and version.
- Max Speed and Current Speed: The maximum and current clock speed of the CPU.
- Core Count: The number of cores in the CPU.
- Thread Count: The number of threads per core.
- Socket Designation: The designated socket location of the CPU.
By analyzing the output of dmidecode, you can get a comprehensive understanding of your CPU’s specifications and capabilities. This information is particularly helpful when you need to verify specific CPU features, check for compatibility with certain software requirements, or identify potential performance bottlenecks.
Furthermore, dmidecode provides additional options to extract more precise information. For example, using the -s option along with the processor type allows you to display only the specified CPU details. For example, sudo dmidecode -s processor-version will show the version of your CPU.
It’s worth noting that some systems may not have complete or accurate DMI table information due to various reasons, including firmware limitations or incomplete BIOS settings. In such cases, the information returned by dmidecode may be limited or not available at all.
Overall, dmidecode is a valuable command to retrieve detailed CPU information directly from the DMI table. It can complement other methods and provide a comprehensive view of your system’s CPU configuration, allowing you to make informed decisions regarding system optimization, software compatibility, and troubleshooting.
Monitoring CPU Usage with the top Command
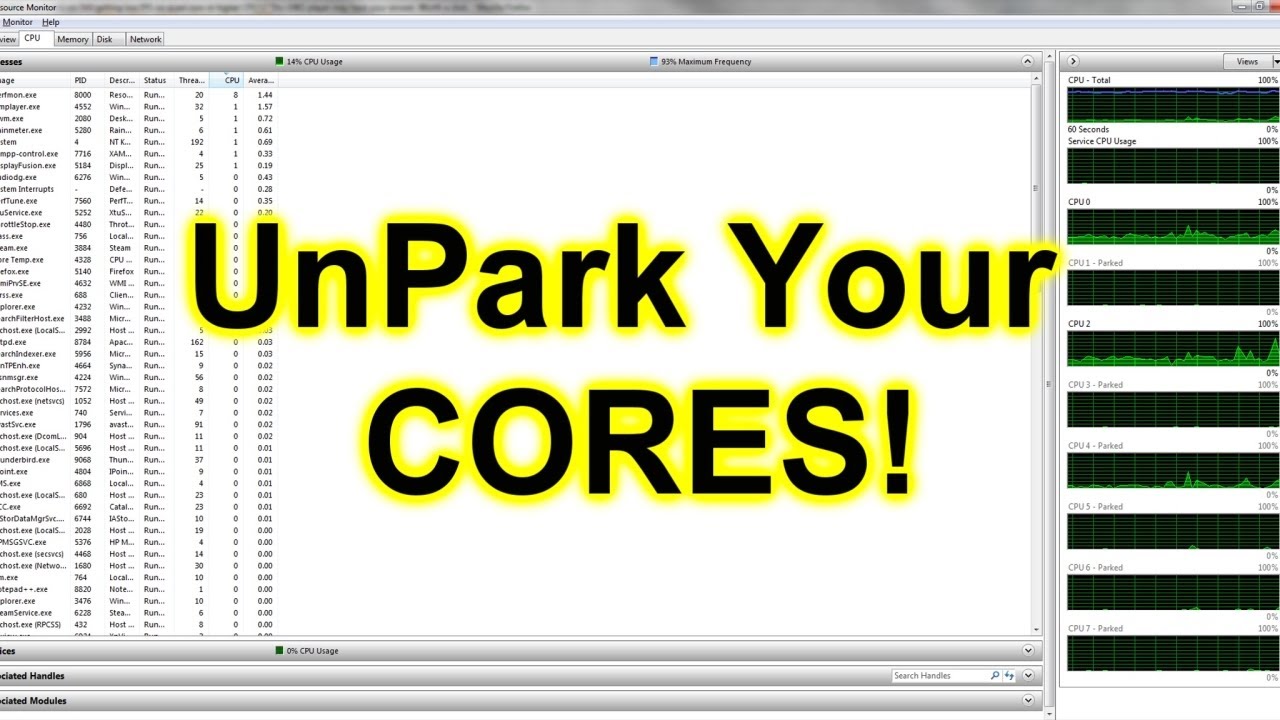
The top command is a powerful utility that provides real-time monitoring of various system resources, including CPU usage. With top, you can obtain valuable insights into how your CPU is being utilized by different processes and monitor its overall performance.
To use the top command, open a terminal and simply type “top” followed by pressing the Enter key. The output will display a dynamic view of the CPU usage, sorted by the percentage of CPU utilization for each process.
The top command provides several key information related to CPU usage, including:
- System Summary: Displays the CPU utilization summary, load average, and the number of running, sleeping, and zombie processes.
- Individual Process Information: Lists all running processes and their respective CPU usage, memory usage, run time, and other details.
- CPU Utilization Overview: Shows the overall CPU usage percentage, broken down by system usage, user processes, and other categories.
- Dynamic Updates: The top command refreshes its output at regular intervals, allowing you to monitor changes in CPU usage in real-time.
Additionally, the top command provides interactive features and options that allow you to customize the displayed information and sort processes based on various criteria. For example, pressing the “1” key will display individual CPU utilization for each CPU core if your system has multiple cores.
With top, you can easily identify processes that are consuming excessive CPU resources, diagnose performance issues, and optimize system performance. Moreover, it provides a snapshot of your CPU usage at a given time, allowing you to monitor trends and detect any unusual spikes or patterns.
While the top command is incredibly useful for real-time CPU monitoring, it is important to note that it does not provide historical data or detailed historical analysis. For more in-depth analysis and long-term monitoring, specialized tools like sar, atop, or graphical monitoring tools like Grafana can be used.
Overall, the top command is a fantastic tool for monitoring CPU usage and gaining insights into the performance of your system in real-time. With its interactive interface and detailed information, it empowers you to manage processes, optimize resource allocation, and ensure efficient CPU utilization.
Gathering CPU Information with the hwinfo Command
The hwinfo command is a versatile tool that provides detailed hardware information in Linux, including comprehensive CPU information. With hwinfo, you can gather a wide range of details about your CPU, such as its manufacturer, model, clock speed, cache size, supported hardware features, and more.
To use the hwinfo command, open a terminal and type “hwinfo –cpu”. The output will display an extensive list of CPU-related information, organized into different sections for easy readability.
The CPU information provided by hwinfo includes:
- Manufacturer: The CPU manufacturer.
- Model: The model name or number of the CPU.
- Architecture: The CPU architecture (e.g., x86, x86_64, ARM).
- Clock Speed: The frequency at which the CPU operates.
- Core Count: The number of physical CPU cores.
- Thread Count: The number of threads per CPU core.
- Cache Size: The size of the CPU cache.
- Supported Features: Information about supported hardware features and instruction sets, such as SSE, AVX, virtualization, etc.
hwinfo provides an extensive amount of information, so it’s highly recommended to redirect its output to a text file for easier analysis and reference. For example, you can use the following command to save the output to a file:
hwinfo --cpu > cpu_info.txtBy analyzing the output, you can gain valuable insights into your CPU’s capabilities and specifications. This information is particularly useful for software development, system administration, and hardware compatibility checks.
hwinfo is a powerful and feature-rich command that not only provides CPU information but also covers a wide range of other hardware components and system details. It is an excellent tool for comprehensive hardware analysis, making it an essential utility for any Linux user.
Checking CPU Temperature with the sensors Command
Monitoring CPU temperature is vital for maintaining optimal system performance and preventing overheating. The sensors command in Linux allows you to check the temperature of your CPU, providing you with valuable information to ensure that your system stays within safe operating temperatures.
To use the sensors command, you need to have the “lm-sensors” package installed on your system. If it is not already installed, you can install it using your package manager. Once “lm-sensors” is installed, open a terminal and type “sensors” to display the current temperature readings.
The sensors command provides temperature readings for various hardware components, including the CPU. The output may differ depending on your system configuration, but it typically includes the temperature readings of the CPU cores and other thermal sensors.
By monitoring CPU temperature, you can identify any instances of overheating, which can lead to system instability and performance issues. High CPU temperatures can also indicate insufficient cooling or issues with the cooling system, such as a malfunctioning fan or improper thermal paste application.
Additionally, you can use the sensors command in conjunction with monitoring tools like “lm-sensors” or graphical system monitors to track CPU temperature trends, set up alerts, and log temperature data over time.
It’s important to note that the reported CPU temperature may not be 100% accurate due to variations in sensor accuracy and placement. However, it provides a good estimate and is still useful for monitoring temperature changes and identifying potential issues.
Regularly checking the CPU temperature using the sensors command can help you take proactive steps to ensure the stability and longevity of your system. By monitoring temperature levels and addressing any overheating issues promptly, you can optimize the performance and reliability of your CPU and overall system.
Conclusion
Obtaining accurate and detailed information about your CPU is essential for managing and optimizing the performance of your Linux system. Fortunately, there are several powerful commands and tools available that allow you to gather CPU information, monitor CPU usage, and track CPU temperature.
The lscpu command provides a quick overview of CPU architecture and specifications, while the /proc/cpuinfo file offers a wealth of information about each CPU core. The dmidecode command extracts CPU details from the system’s BIOS, and the top command allows real-time monitoring of CPU usage. The hwinfo command provides comprehensive hardware information, including CPU specifications. Lastly, the sensors command enables you to check the CPU temperature, ensuring that it stays within safe limits.
By utilizing these commands, you can gain valuable insights into your CPU’s capabilities, troubleshoot issues, optimize software performance, and ensure proper cooling of your system.
Remember, CPU information is key to making informed decisions about system upgrades, software compatibility, and performance optimization. Regularly monitoring CPU usage and temperature can help you identify potential problems and take appropriate measures to ensure the stability and longevity of your system.
So, leverage these powerful commands, explore your CPU’s capabilities, and fine-tune your Linux system for an optimized and efficient computing experience.


