Introduction
When it comes to web browsing, Safari stands out as a popular choice for Mac and iOS users. Whether you're a web developer, a tech enthusiast, or simply someone curious about the inner workings of the websites you visit, Safari's Developer Tools can provide valuable insights and functionalities. These tools empower users to inspect, debug, and optimize web content, making them indispensable for anyone involved in web development or simply interested in understanding the technical aspects of the internet.
In this article, we'll delve into the process of opening Developer Tools in Safari on both Mac and iOS devices. By the end, you'll have a comprehensive understanding of how to access these powerful tools, enabling you to explore the underlying structure of web pages, analyze network activity, and experiment with various web development features.
Let's embark on this journey to uncover the hidden capabilities of Safari's Developer Tools, empowering you to gain a deeper understanding of the web and its intricate design. Whether you're a seasoned developer or a curious individual eager to peek behind the digital curtain, the following sections will equip you with the knowledge to harness the full potential of Safari's Developer Tools.
Opening Developer Tools in Safari on Mac
Opening Developer Tools in Safari on a Mac is a straightforward process that provides access to a wealth of powerful features for web development and debugging. Whether you're a seasoned developer or a curious individual eager to explore the inner workings of websites, Safari's Developer Tools offer a comprehensive suite of functionalities to aid in understanding and optimizing web content.
To initiate the process of opening Developer Tools in Safari on a Mac, you can follow these simple steps:
-
Using the Menu Bar:
- Launch Safari on your Mac and navigate to the menu bar located at the top of the screen.
- Click on "Safari" in the menu bar to reveal a dropdown menu.
- From the dropdown menu, select "Preferences" to access Safari's settings.
-
Accessing the Advanced Settings:
- Within the Preferences window, click on the "Advanced" tab located at the far right.
- Check the box next to "Show Develop menu in menu bar" to enable the Develop menu within Safari.
-
Opening Developer Tools:
- Once the Develop menu is enabled, navigate back to the menu bar at the top of the screen.
- Click on "Develop" to reveal a dropdown menu containing various web development tools and options.
- From the dropdown menu, select "Show Web Inspector" to open the Developer Tools panel.
Upon completing these steps, the Developer Tools panel will appear, providing access to a wide array of functionalities such as inspecting elements, analyzing network activity, debugging JavaScript, and much more. This powerful suite of tools empowers users to delve into the underlying structure of web pages, identify and rectify issues, and optimize the performance of web content.
By familiarizing yourself with the process of opening Developer Tools in Safari on a Mac, you gain the ability to harness the full potential of these tools, enabling you to explore, analyze, and enhance the web browsing experience. Whether you're a web developer seeking to fine-tune a website's performance or simply intrigued by the technical aspects of the internet, Safari's Developer Tools on Mac provide a gateway to a deeper understanding of web development and design.
Opening Developer Tools in Safari on iPhone or iPad
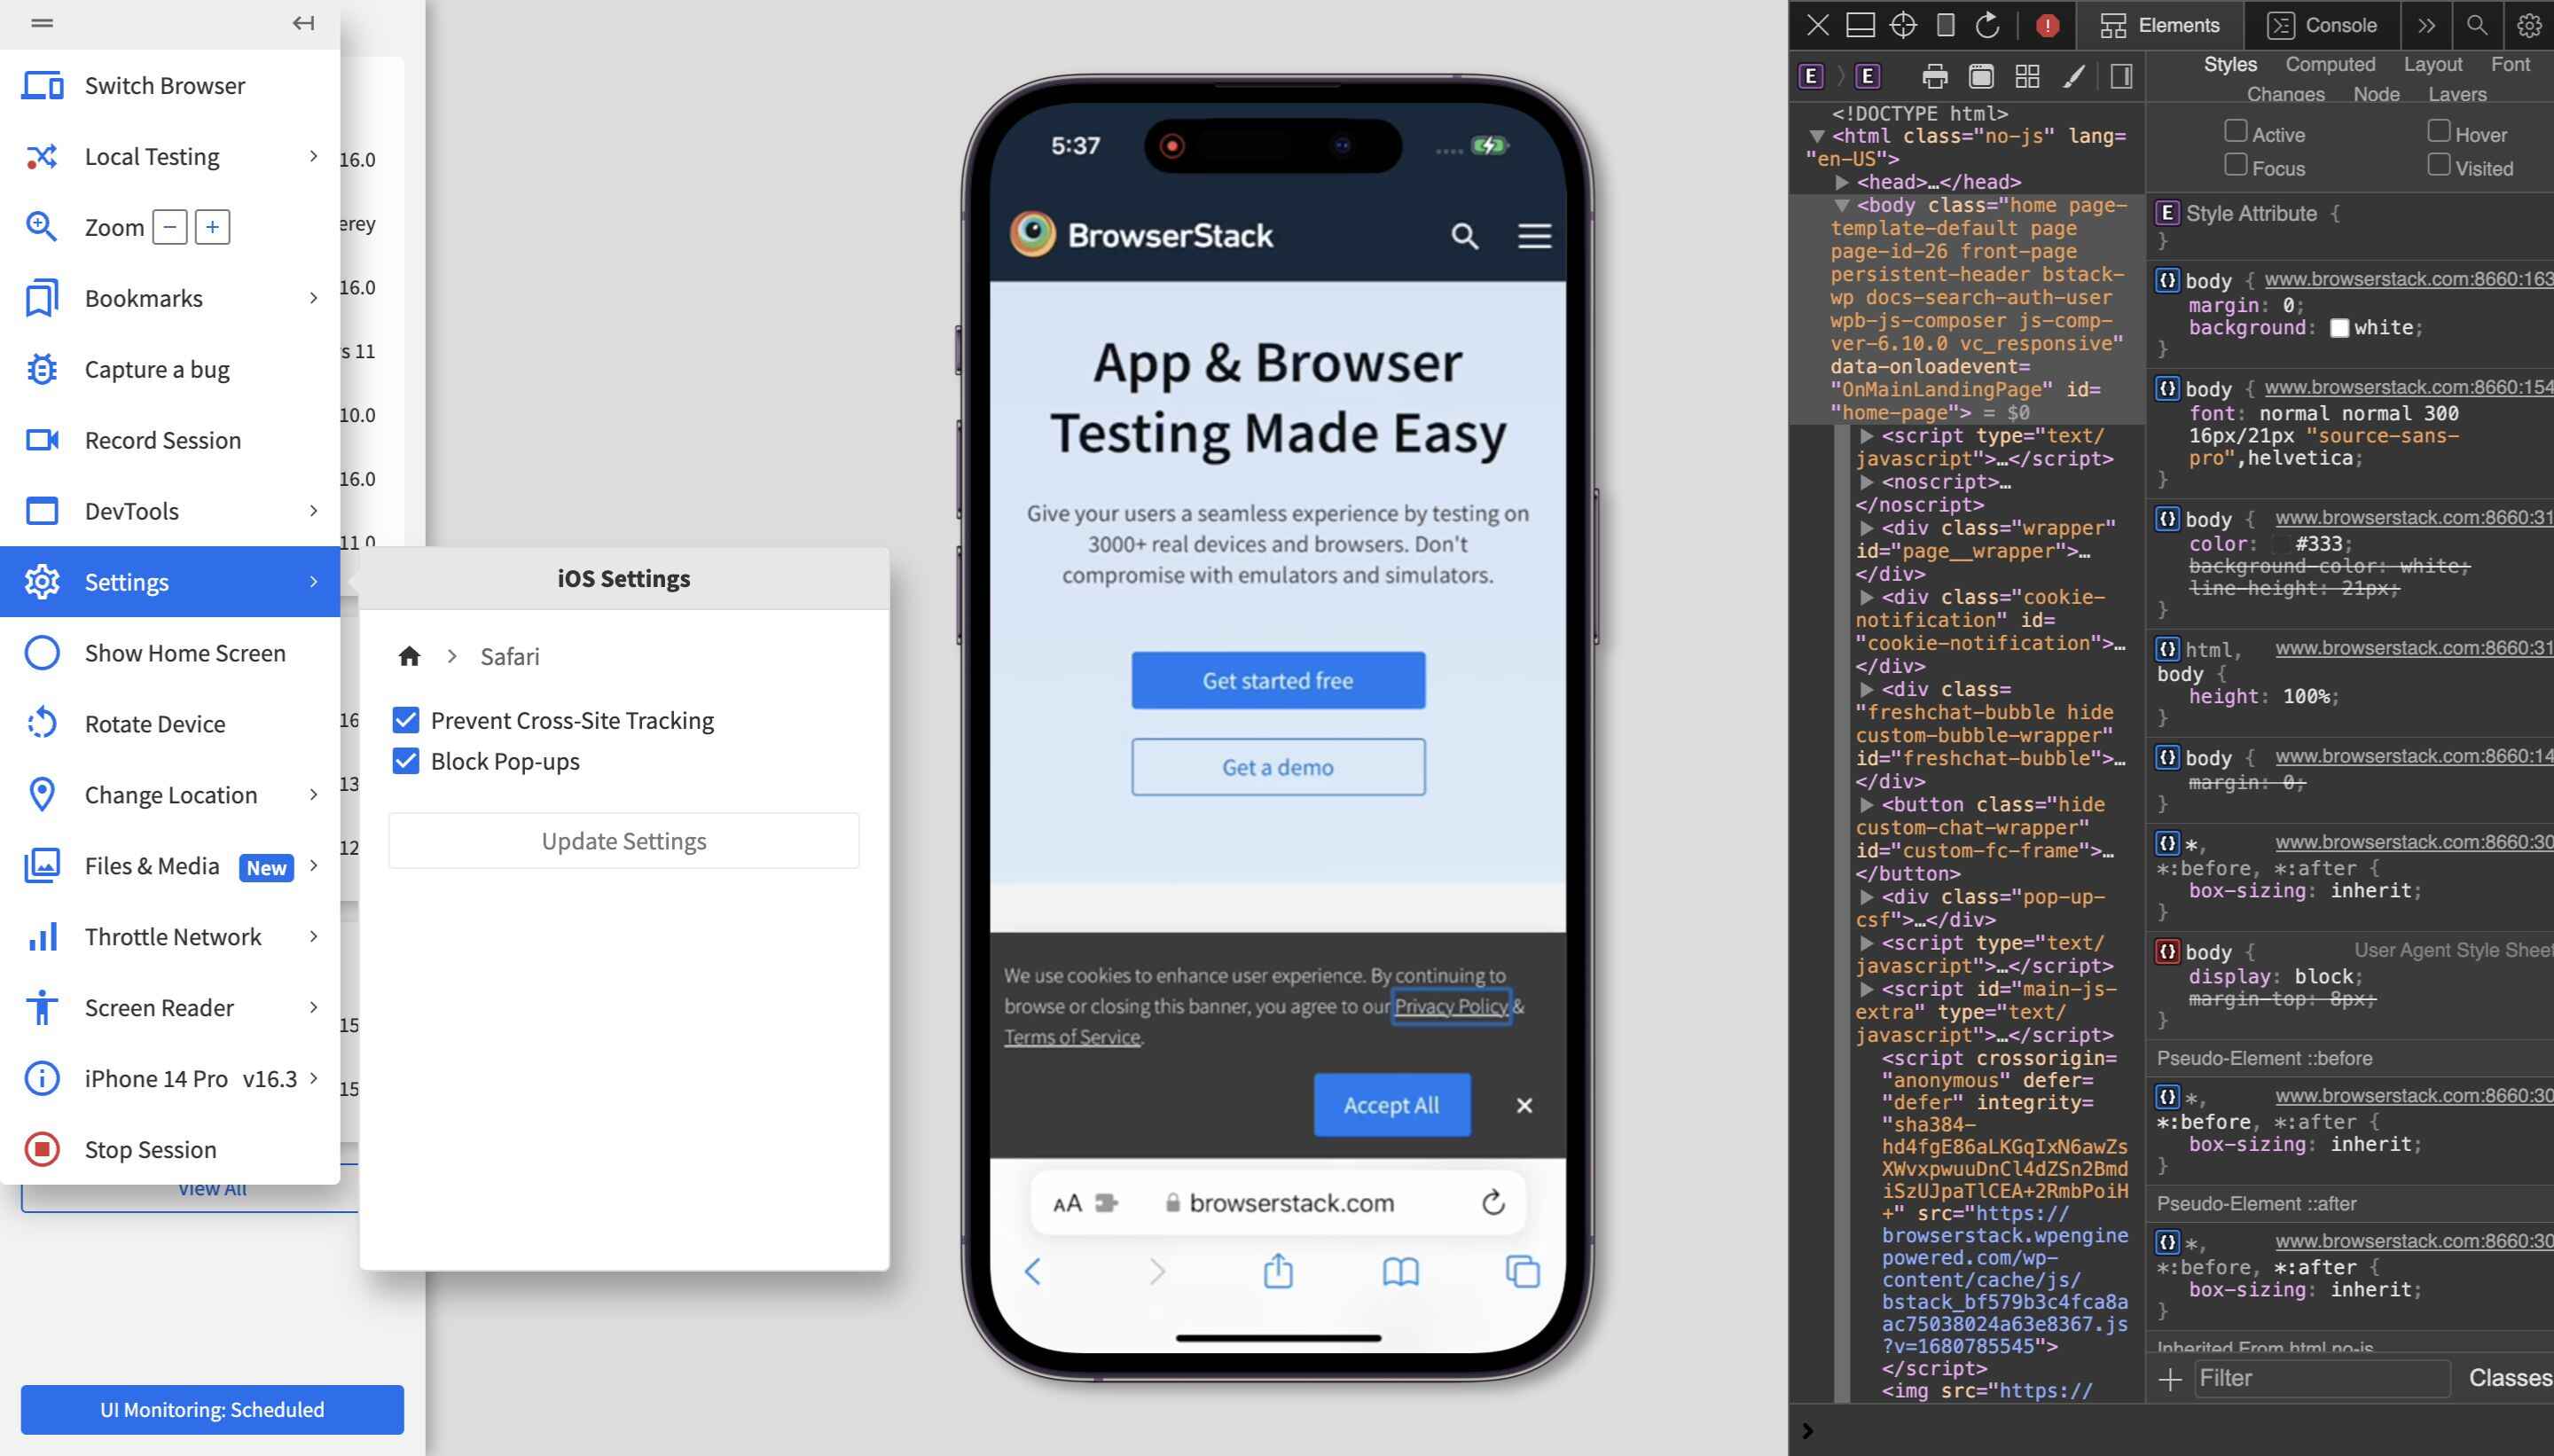
Accessing Developer Tools in Safari on an iPhone or iPad allows users to gain valuable insights into the technical aspects of web content and perform various web development tasks directly from their mobile devices. Whether you're a web developer on the go or simply curious about the inner workings of websites, Safari's Developer Tools provide a convenient way to inspect, debug, and optimize web content on iOS devices.
To initiate the process of opening Developer Tools in Safari on an iPhone or iPad, follow these simple steps:
-
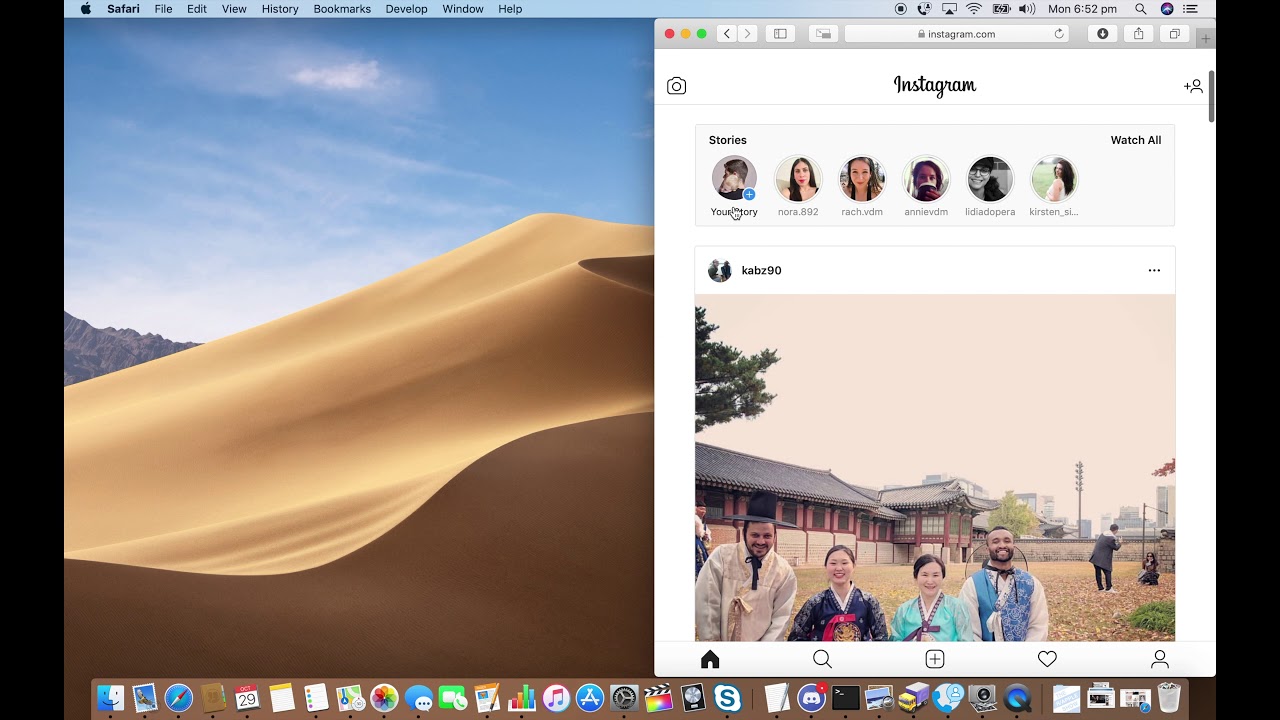
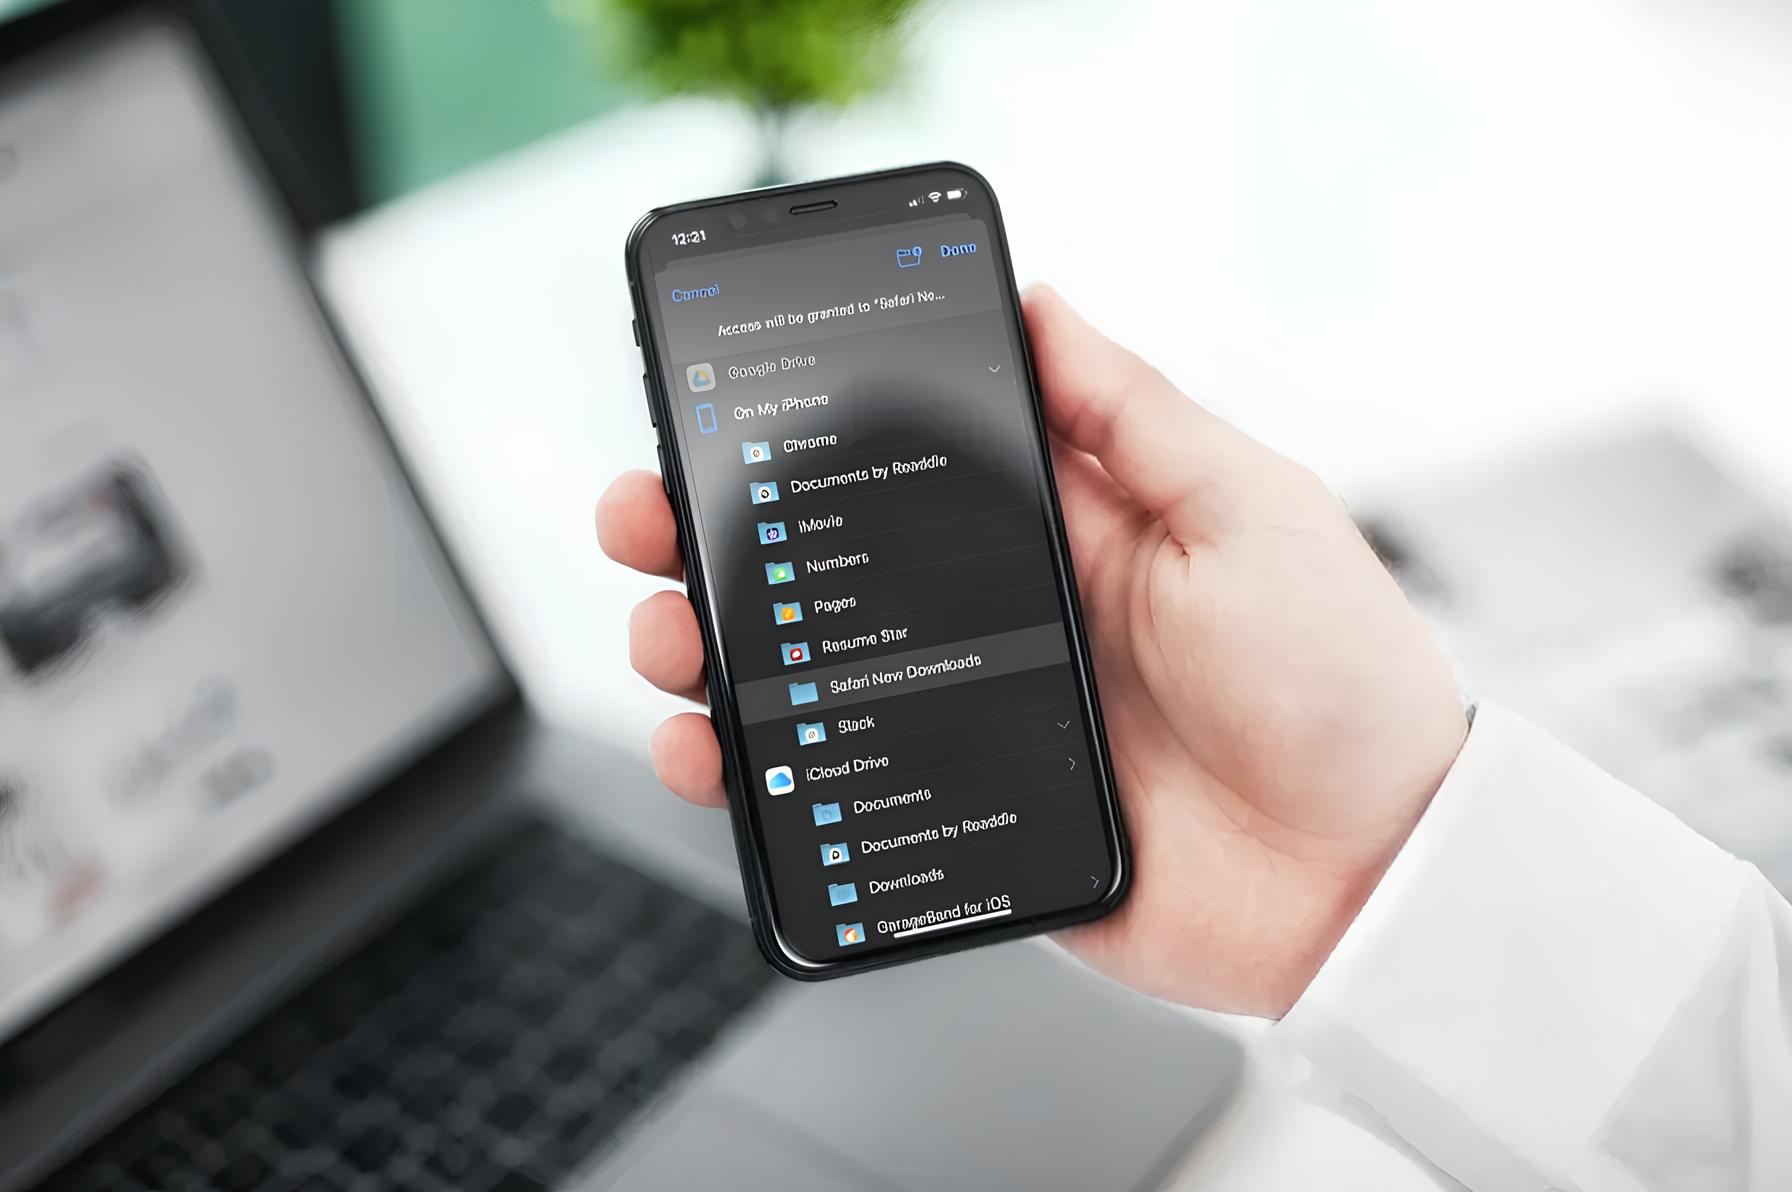
Launching Safari: Begin by unlocking your iPhone or iPad and locating the Safari icon on the home screen. Tap the Safari icon to open the Safari browser.
-
Enabling Developer Tools: With Safari open, navigate to the website or web page you wish to inspect and debug. Once on the desired web page, tap the address bar at the top of the screen to reveal the URL and other options.
-
Accessing Developer Tools: In the address bar, enter "inspect://" followed by the URL of the web page you are currently viewing. For example, if you are on the website "example.com," you would enter "inspect://example.com" in the address bar and tap "Go" or the "Enter" key on the on-screen keyboard.
Upon completing these steps, Safari's Developer Tools will be activated, providing access to a range of functionalities such as inspecting elements, analyzing network activity, debugging JavaScript, and more. This powerful suite of tools empowers users to delve into the underlying structure of web pages, identify and rectify issues, and optimize the performance of web content directly from their iPhone or iPad.
By familiarizing yourself with the process of opening Developer Tools in Safari on an iPhone or iPad, you gain the ability to harness the full potential of these tools, enabling you to explore, analyze, and enhance the web browsing experience while on the go. Whether you're a web developer seeking to troubleshoot a website's functionality or simply intrigued by the technical aspects of the internet, Safari's Developer Tools on iOS devices provide a convenient gateway to a deeper understanding of web development and design.