Introduction
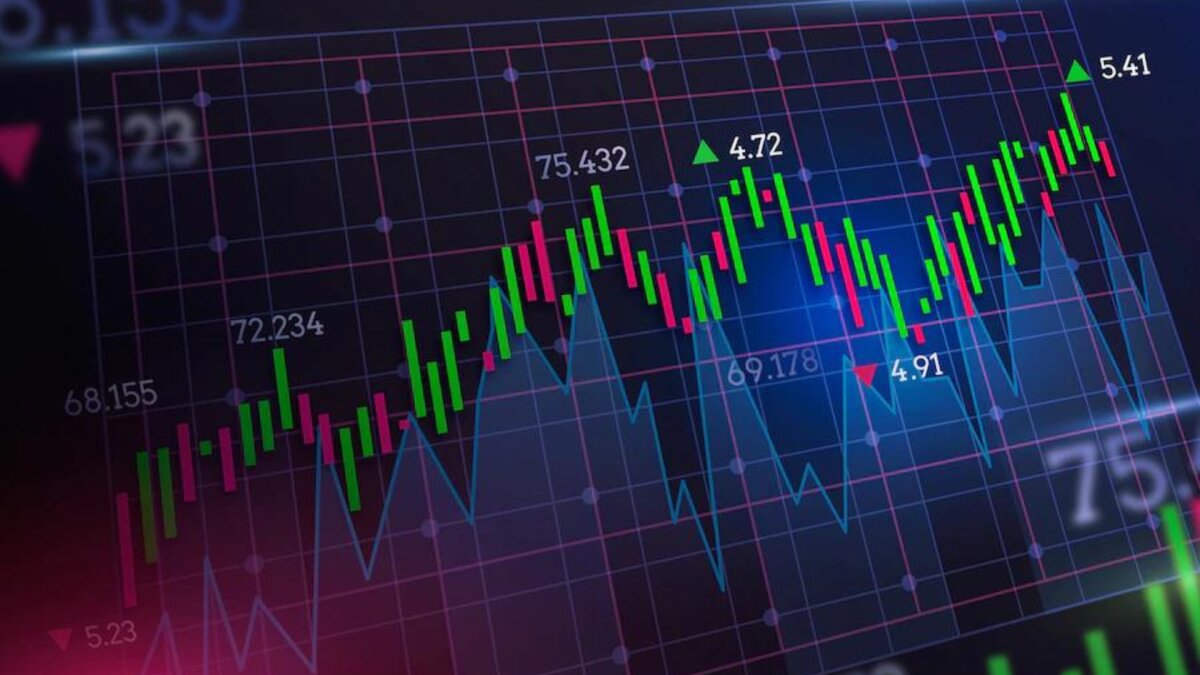
Candlestick charts are a popular tool used in technical analysis to monitor and analyze various types of investments. They are widely used in the financial markets to track the price movements of stocks, commodities, forex, and cryptocurrencies. These charts provide valuable insights into the psychology of buyers and sellers, allowing traders and investors to make informed decisions.
The candlestick charting technique originated in Japan in the 18th century and was used by rice traders to analyze price patterns. Today, it has become a staple in the world of finance and is a fundamental tool for traders of all levels.
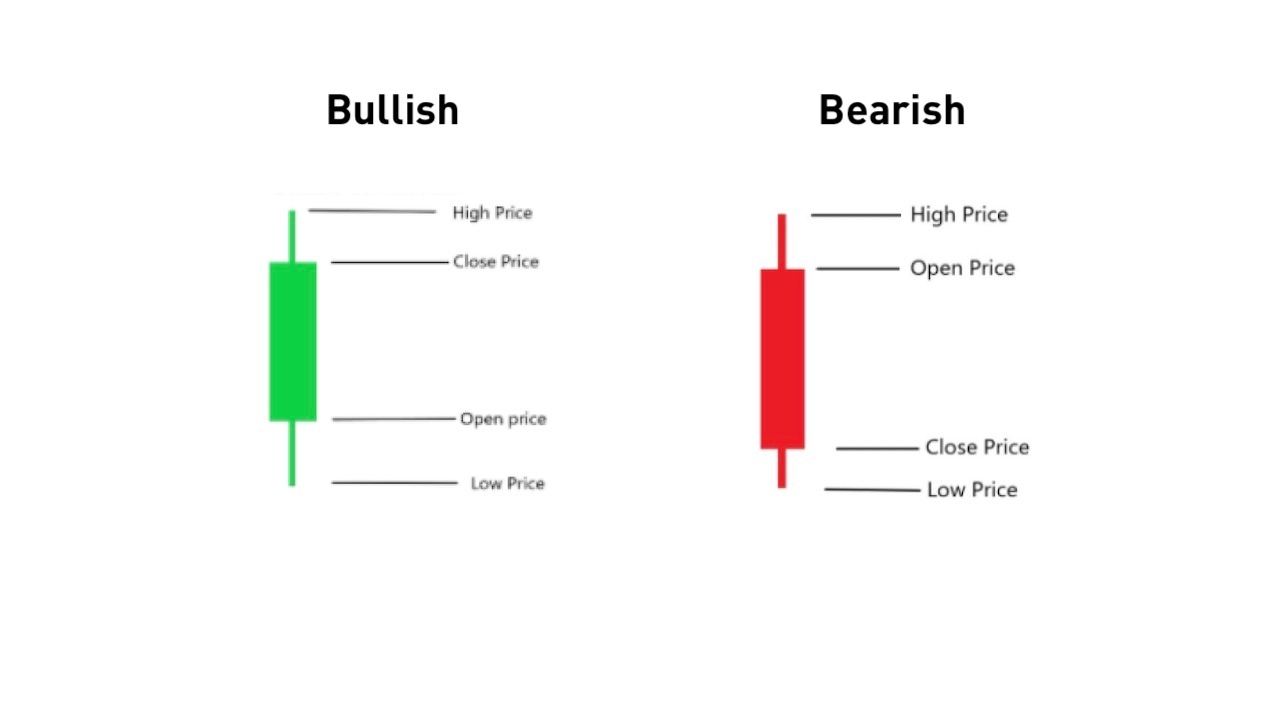
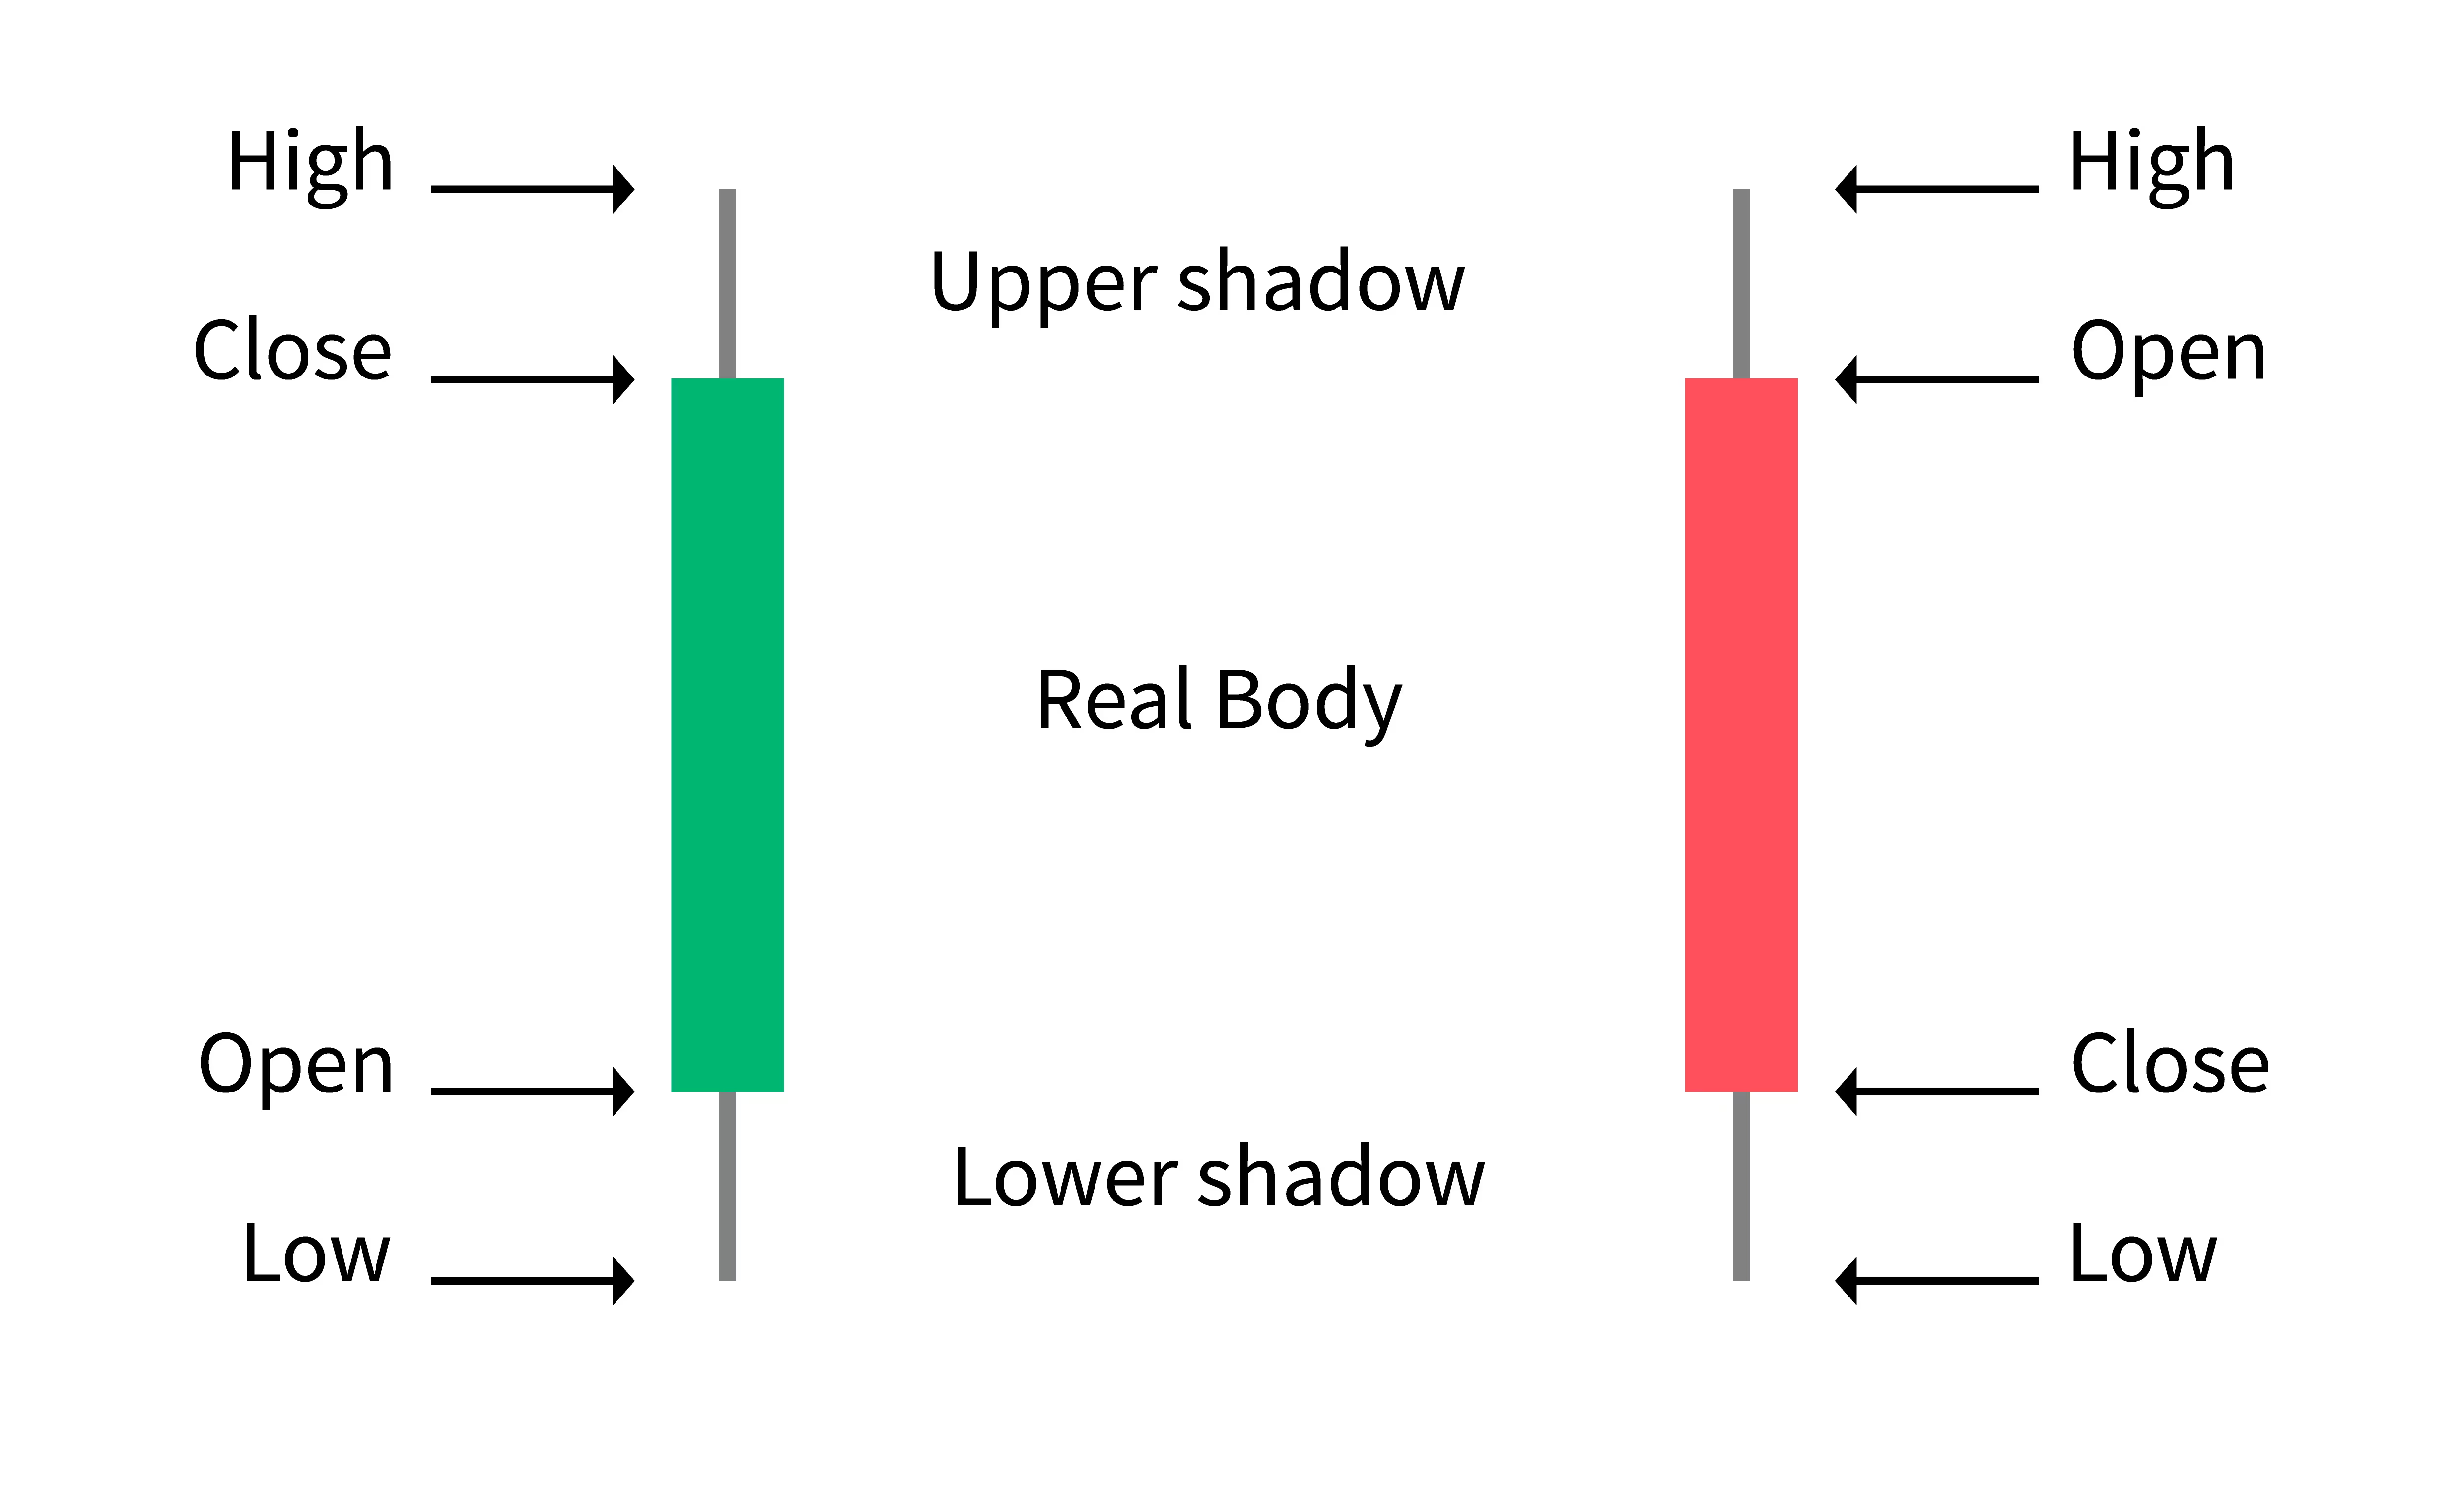
The main advantage of using candlestick charts is their ability to visually represent price movements over a specific time period. Each candlestick on the chart represents the opening, closing, high, and low prices for that particular period (such as a day, week, or month). The body of the candlestick is typically filled or hollow, depending on whether the close was higher or lower than the open. The upper and lower parts of the candlestick, known as the wicks or shadows, indicate the highest and lowest prices reached during the period.
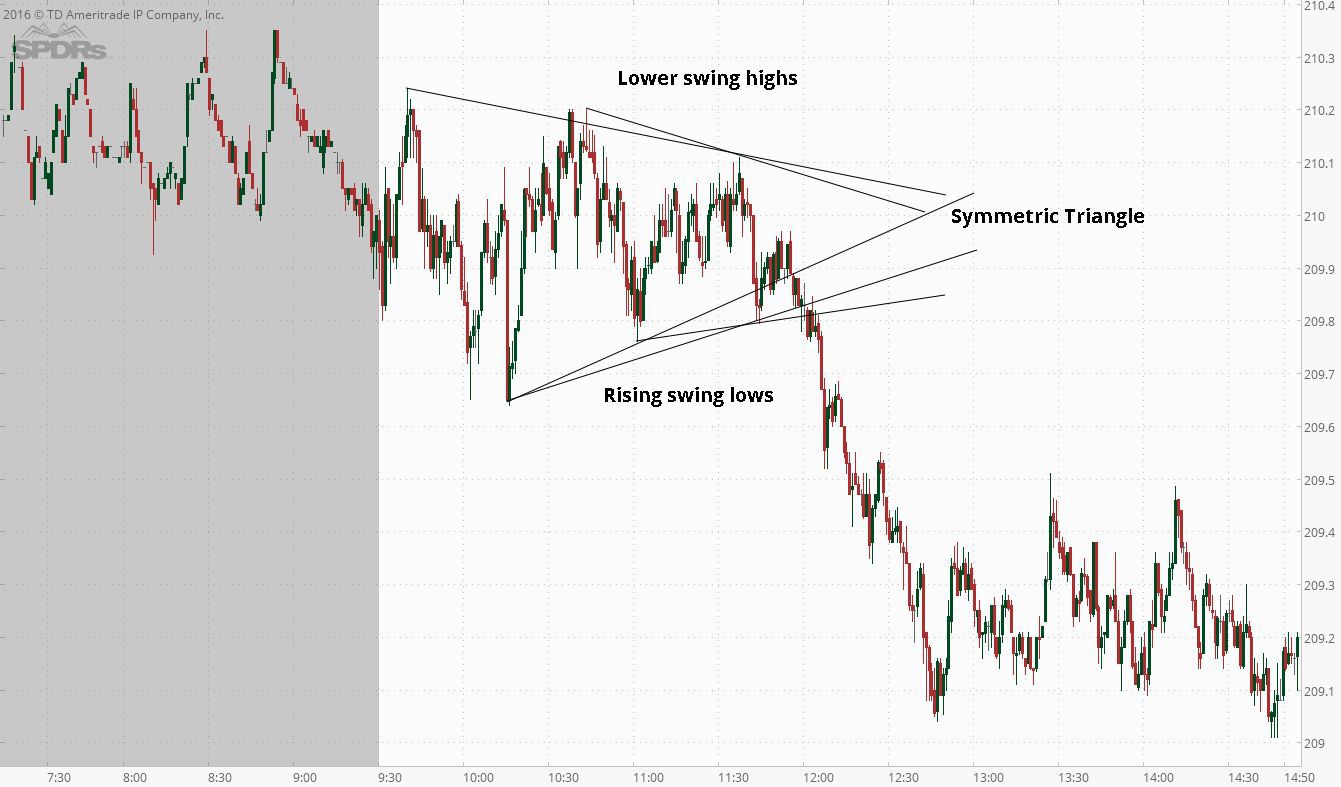
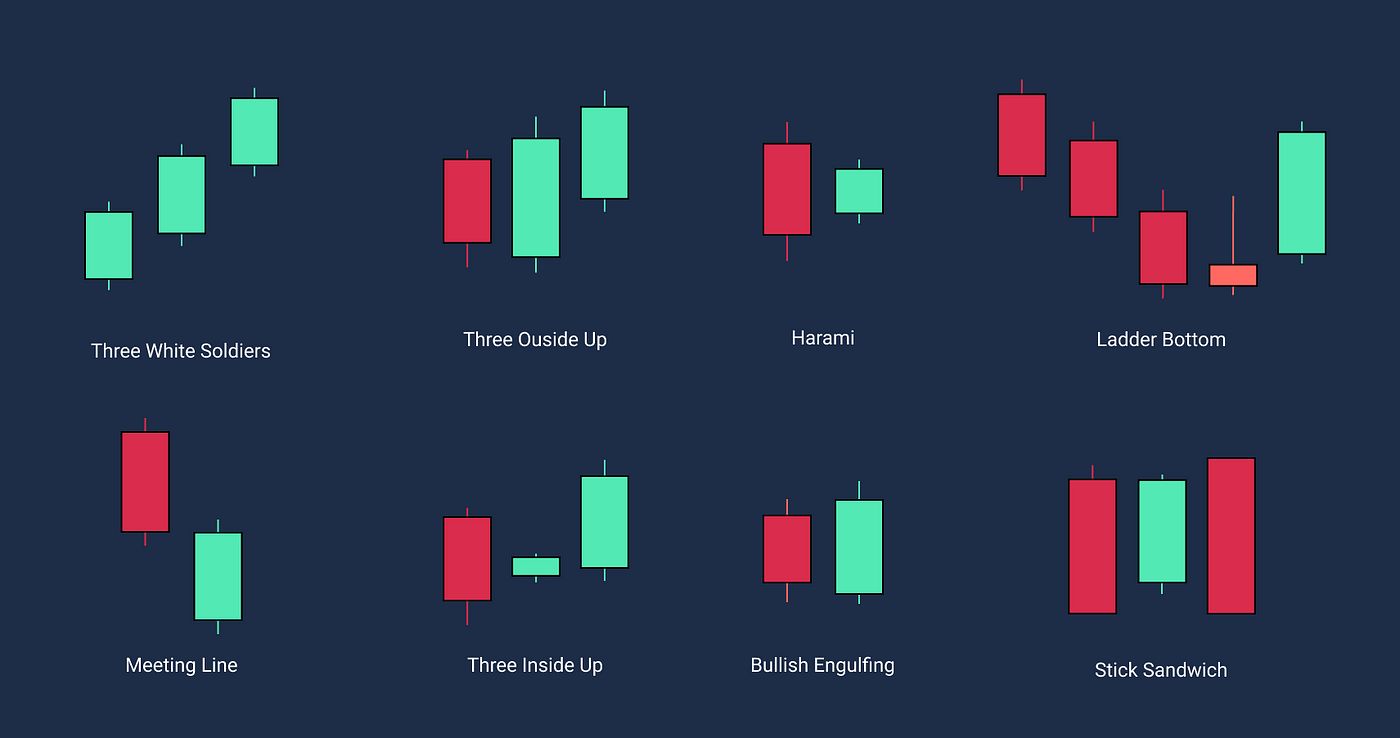
By studying candlestick patterns, traders can identify potential trend reversals, continuations, and market sentiment. Different patterns, such as doji, hammer, engulfing, and shooting star, provide insights into the balance between buying and selling pressure, allowing traders to anticipate future price movements.
The use of candlestick charts is not limited to a particular type of investment. They can be applied to various asset classes, including stocks, commodities, forex, and cryptocurrencies. Each market may have its own unique characteristics and patterns, but the principles of candlestick analysis remain the same.
In the following sections, we will explore how candlestick charts are used in monitoring different types of investments, providing a comprehensive understanding of their applications in the financial markets.
Stocks
When it comes to monitoring stocks, candlestick charts are an invaluable tool for traders and investors. These charts provide a visual representation of the price movements and patterns of individual stocks over a specific period of time.
By analyzing candlestick patterns, traders can gauge the sentiment of market participants and make more informed decisions. For example, a long green candlestick with a small upper shadow indicates strong buying pressure and suggests that the stock may continue to rise. On the other hand, a long red candlestick with a small lower shadow indicates strong selling pressure and signals a potential downturn in the stock price.
Candlestick patterns such as the doji, engulfing pattern, and hammer can also provide insights into possible trend reversals or continuations in stock prices. These patterns help traders identify key support and resistance levels, allowing them to set appropriate entry and exit points.
Additionally, candlestick charting techniques can be combined with other technical indicators, such as moving averages and volume indicators, to further enhance the analysis of stock price movements. This integration of multiple tools helps traders confirm potential buy or sell signals and improve the accuracy of their trading strategies.
It’s important to note that stock markets are influenced by various factors, including company earnings, economic news, and market sentiment. Candlestick charts alone cannot predict future stock prices with certainty, but they provide valuable insights into market psychology and can aid in making more informed trading decisions.
Whether you’re a day trader looking to capitalize on short-term price movements or a long-term investor interested in identifying favorable entry points, monitoring stocks with candlestick charts can greatly improve your chances of success in the stock market.
Commodities
Candlestick charts are widely used to monitor and analyze price movements in the commodities market. Commodities, such as gold, oil, and agricultural products, can be highly volatile, making it crucial for traders and investors to understand and anticipate price fluctuations.
By studying candlestick patterns in commodity trading, traders can gain insights into market sentiment and potential price reversals. For example, a bullish engulfing pattern, where a small bearish candle is followed by a larger bullish candle, indicates a potential trend reversal from bearish to bullish. This pattern suggests that buying pressure may be increasing, potentially leading to an uptrend in the commodity price.
Candlestick charts also help traders identify key support and resistance levels in the commodities market. These levels represent areas where the price has historically had difficulty breaking through, and can act as indicators of potential price reversals. By combining candlestick analysis with other technical indicators, such as trendlines and moving averages, traders can further strengthen their trading strategies in the commodities market.
Moreover, the use of candlestick charts in commodity trading can assist traders in setting entry and exit points for their trades. For instance, a doji candlestick, which signifies indecision in the market, may indicate that the commodity price is likely to consolidate before making a significant move. Traders can use this information to wait for confirmation before entering into a trade or exiting an existing position.
Candlestick patterns are not infallible, and it’s important to consider other factors, such as supply and demand fundamentals, geopolitical events, and macroeconomic trends, when analyzing commodities. However, candlestick analysis provides traders with valuable insights into market psychology and can be a useful tool for decision-making in the volatile world of commodity trading.
Whether you’re interested in trading gold, oil, or agricultural commodities, monitoring price movements with candlestick charts can help you navigate the complexities of the commodities market and make more informed trading decisions.
Forex
Candlestick charts are extensively utilized in the foreign exchange (forex) market to monitor and analyze currency price movements. As the largest and most liquid financial market in the world, forex trading requires a deep understanding of market dynamics, and candlestick charts provide valuable insights for traders.
One of the key benefits of using candlestick charts in forex trading is their ability to visually depict the market sentiment. Candlestick patterns, such as engulfing patterns, hammers, and shooting stars, can indicate potential trend reversals or continuations in currency pairs. Traders can use this information to identify entry and exit points for their trades, aligning their strategies with the market trends.
Candlestick charts also help forex traders identify support and resistance levels, which are crucial in determining potential price targets and areas where the market may reverse. By combining candlestick analysis with other technical indicators like moving averages and trendlines, traders can make more informed decisions about when to enter or exit their positions in the forex market.
Moreover, candlestick patterns can provide traders with insights into market volatility. For instance, patterns like the doji can indicate indecision and a potential market consolidation, while long candlesticks with small wicks can signal strong market momentum. By understanding these patterns, forex traders can adjust their strategies accordingly and potentially profit from market movements.
It’s important to consider other factors when trading forex, including economic indicators, central bank decisions, and geopolitical events, as they can significantly impact currency prices. However, candlestick analysis remains an integral tool for understanding market psychology and trends in the forex market.
Whether you’re a beginner or an experienced trader, utilizing candlestick charts in forex trading can enhance your ability to identify trading opportunities and manage your risk effectively. By learning to interpret and analyze candlestick patterns, you can gain a competitive edge in the dynamic and ever-changing world of forex trading.
Cryptocurrencies
Candlestick charts have become an essential tool for monitoring and analyzing price movements in the world of cryptocurrencies. With their high volatility and rapid price fluctuations, cryptocurrencies present unique opportunities and challenges for traders and investors. Candlestick charts provide valuable insights into market sentiment and can help traders make informed decisions.
One of the primary advantages of using candlestick charts in cryptocurrency trading is their ability to capture the psychology of market participants. Different candlestick patterns, such as doji, hammers, and engulfing patterns, can indicate potential trend reversals or continuations in the price of cryptocurrencies. Traders can use these patterns to identify potential entry and exit points, aligning their strategies with the prevailing market trends.
Candlestick charts also assist in identifying key support and resistance levels in cryptocurrency trading. These levels represent areas where the price has historically shown resistance or support, suggesting potential price reversals. By combining candlestick analysis with other technical indicators like trendlines and moving averages, traders can strengthen their trading strategies and make more informed decisions.
Additinally, candlestick charts can provide insights into market volatility and momentum in cryptocurrencies. For example, long candlesticks with small wicks indicate strong price momentum and can signal potential breakout opportunities. Conversely, indecisive patterns like doji can suggest an impending consolidation or market uncertainty.
It is important to note that cryptocurrencies are highly influenced by factors like regulatory news, adoption rates, and technological developments. Therefore, it is crucial to consider these factors alongside candlestick analysis to make well-rounded trading decisions.
Whether you’re trading Bitcoin, Ethereum, or other cryptocurrencies, monitoring price movements with candlestick charts can help you better understand market dynamics and improve your trading outcomes. By learning to interpret and analyze candlestick patterns, you can gain a competitive edge in the fast-paced and ever-evolving world of cryptocurrency trading.
Conclusion
Candlestick charts are a powerful tool for monitoring and analyzing various types of investments, including stocks, commodities, forex, and cryptocurrencies. These charts provide valuable insights into market psychology and price patterns, helping traders and investors make more informed decisions.
In the world of stocks, candlestick charts enable traders to gauge market sentiment and identify potential trend reversals or continuations. By understanding different candlestick patterns, traders can set appropriate entry and exit points and optimize their trading strategies.
Similarly, in the commodities market, candlestick charts help traders analyze price movements and anticipate potential reversals. Patterns such as engulfing patterns and hammers provide insights into market sentiment and assist in identifying entry and exit points for trades.
Forex traders benefit from candlestick analysis by understanding market psychology and trends. Candlestick patterns help identify possible trend reversals or continuations, and support and resistance levels can aid in setting price targets and managing risk.
When it comes to cryptocurrencies, candlestick charts are crucial for capturing market sentiment and predicting price movements. Traders can use these charts to recognize potential trend changes, identify support and resistance levels, and capitalize on market volatility.
While candlestick charts are an essential tool, it’s important to remember that other factors, such as economic data, news events, and market fundamentals, also influence the price movements of these investments. It’s crucial to combine candlestick analysis with a comprehensive understanding of the specific market and a well-rounded trading strategy.
In conclusion, candlestick charts are a valuable asset for traders and investors in various markets. By learning to interpret and analyze these charts effectively, market participants can gain a competitive edge, improve their decision-making process, and increase their chances of success in the dynamic world of investment.