Introduction
Welcome to the world of cryptocurrency trading! If you’re new to the game, you may have come across the term “crypto candles” and wondered what they are all about. Crypto candles, also known as candlestick charts, are powerful tools used in technical analysis to understand and predict price patterns in the cryptocurrency market.
Trading in the crypto market can be highly volatile and unpredictable, but with the help of candlestick charts, you can gain valuable insights into the market sentiment and make more informed trading decisions.
In this article, we will demystify crypto candles and guide you through the process of reading and interpreting them effectively. Whether you’re a beginner trader looking to understand the basics or a seasoned investor looking to refine your skills, this guide will provide you with the knowledge you need to navigate the intricate world of crypto candles.
Before we delve into the intricacies of reading and interpreting crypto candles, let’s first understand what they are and why they are an essential tool in the cryptocurrency trading arsenal.
What are crypto candles?
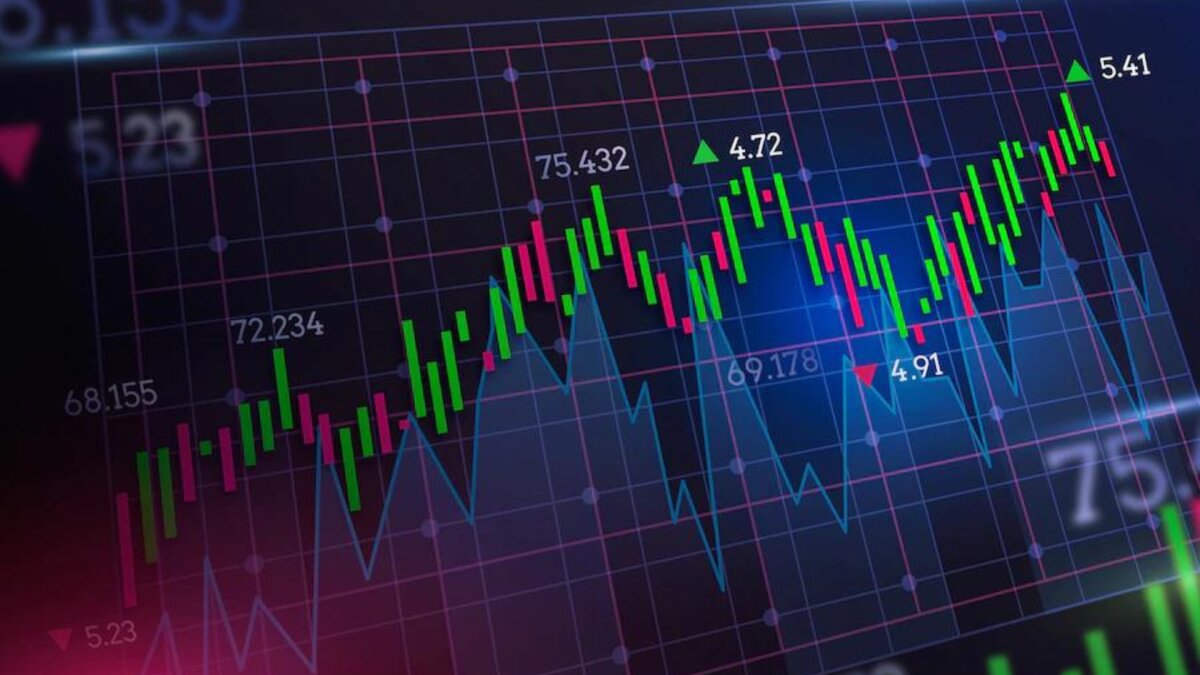
Crypto candles, also known as candlestick charts, are visual representations of price movements in the cryptocurrency market over a specific time period. These charts provide valuable information about the opening, closing, high, and low prices of a particular cryptocurrency during that time frame.
Each candlestick on the chart represents a specific time period, commonly ranging from 1 minute to 1 month, depending on the trader’s preference. The shape and color of the candlestick provide crucial insights into the price action and market sentiment.
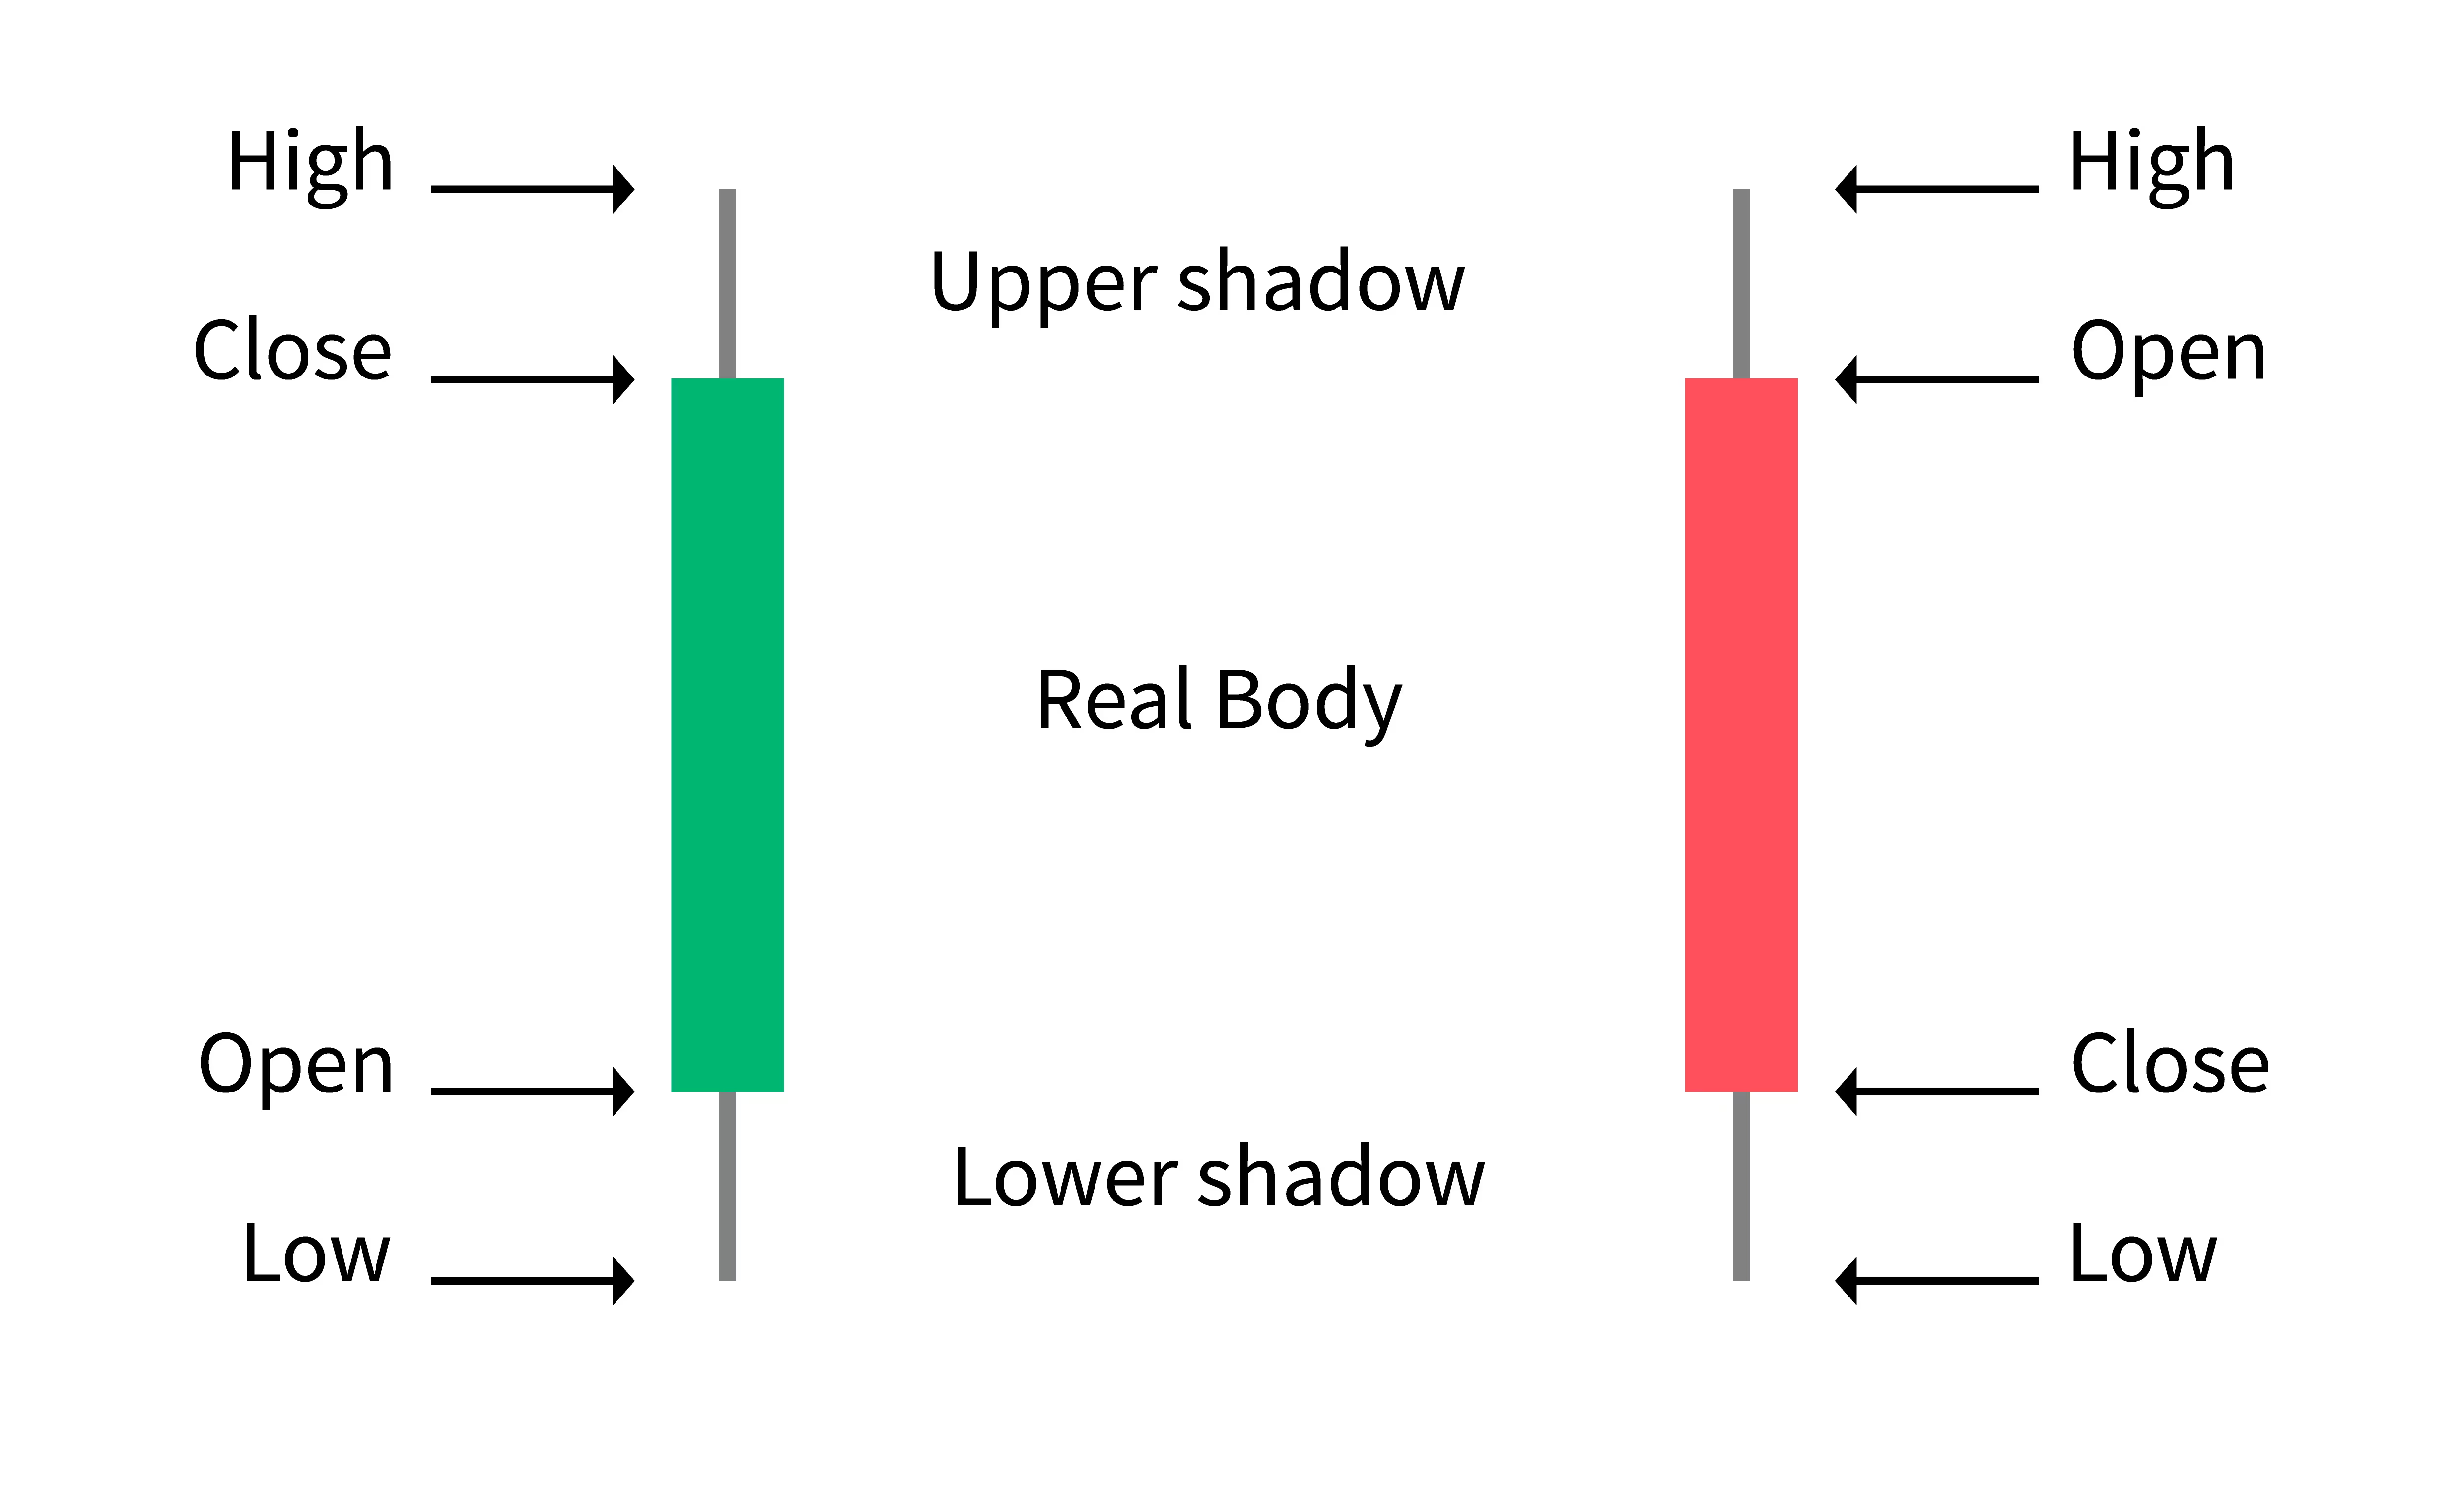
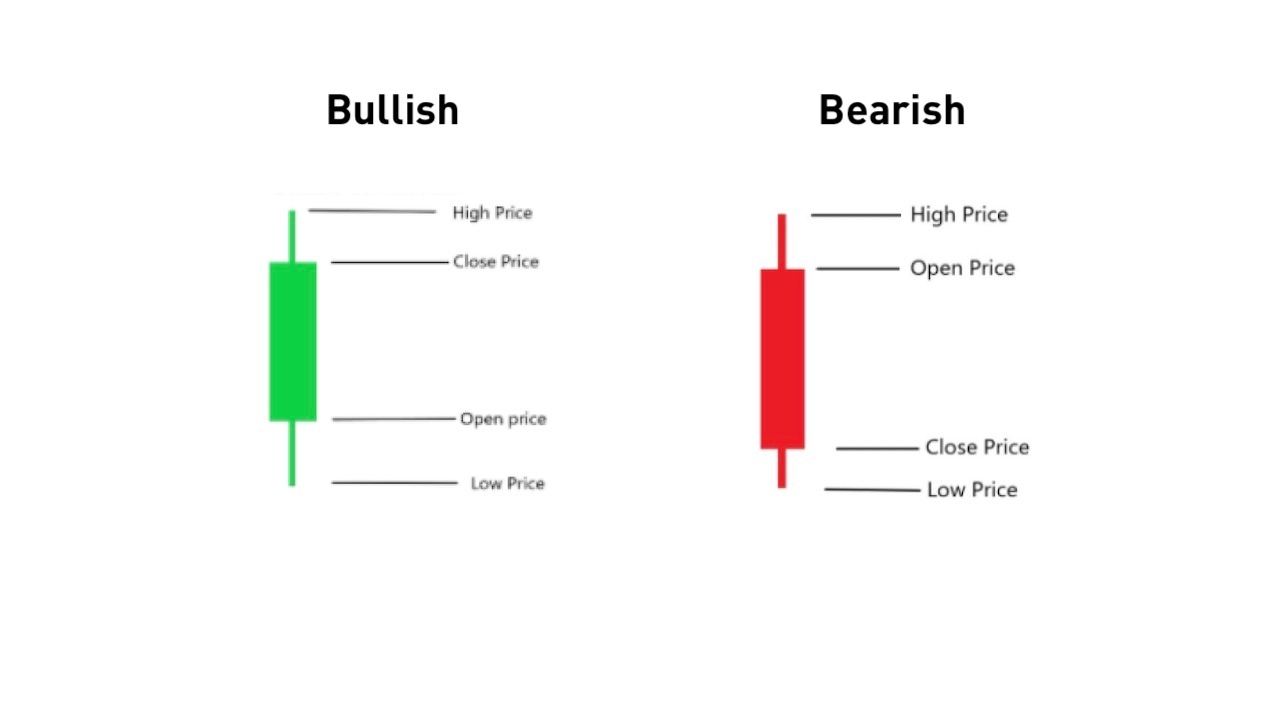
So why are candles shaped like sticks? Each candlestick is composed of a rectangular body and a thin vertical line, referred to as the wick or shadow. The body represents the price range between the opening and closing prices, while the wick reflects the highest and lowest prices reached during the specified time period.
The color of the candlestick can vary, typically green or blue for bullish or positive price movements, and red or orange for bearish or negative price movements. These visual cues help traders quickly identify whether the market is experiencing upward or downward pressure.
By observing and analyzing the patterns formed by the candlesticks, traders can identify trends, reversals, and potential entry or exit points. It’s important to note that the accuracy of candlestick patterns relies on historical data and market conditions, making it a valuable tool but not a guaranteed strategy for trading success.
Now that we have a basic understanding of what crypto candles are, let’s explore the different types of candlestick patterns and how they can be used to make better trading decisions.
Types of crypto candles
There are several types of crypto candles that traders commonly use to analyze price movements and market trends. Let’s explore some of the most important ones:
- Doji: A doji candlestick has a small body, indicating that the opening and closing prices are very close to each other. This often signifies indecision in the market and can be a precursor to a trend reversal.
- Hammer: A hammer candlestick has a small body with a long lower shadow, resembling a hammer. This pattern typically suggests a potential bullish reversal, as buyers stepped in during the session to push the price back up.
- Shooting Star: The shooting star candlestick has a small body with a long upper shadow. It is seen as a bearish reversal pattern, indicating that sellers have gained control, and the price may start to decline soon.
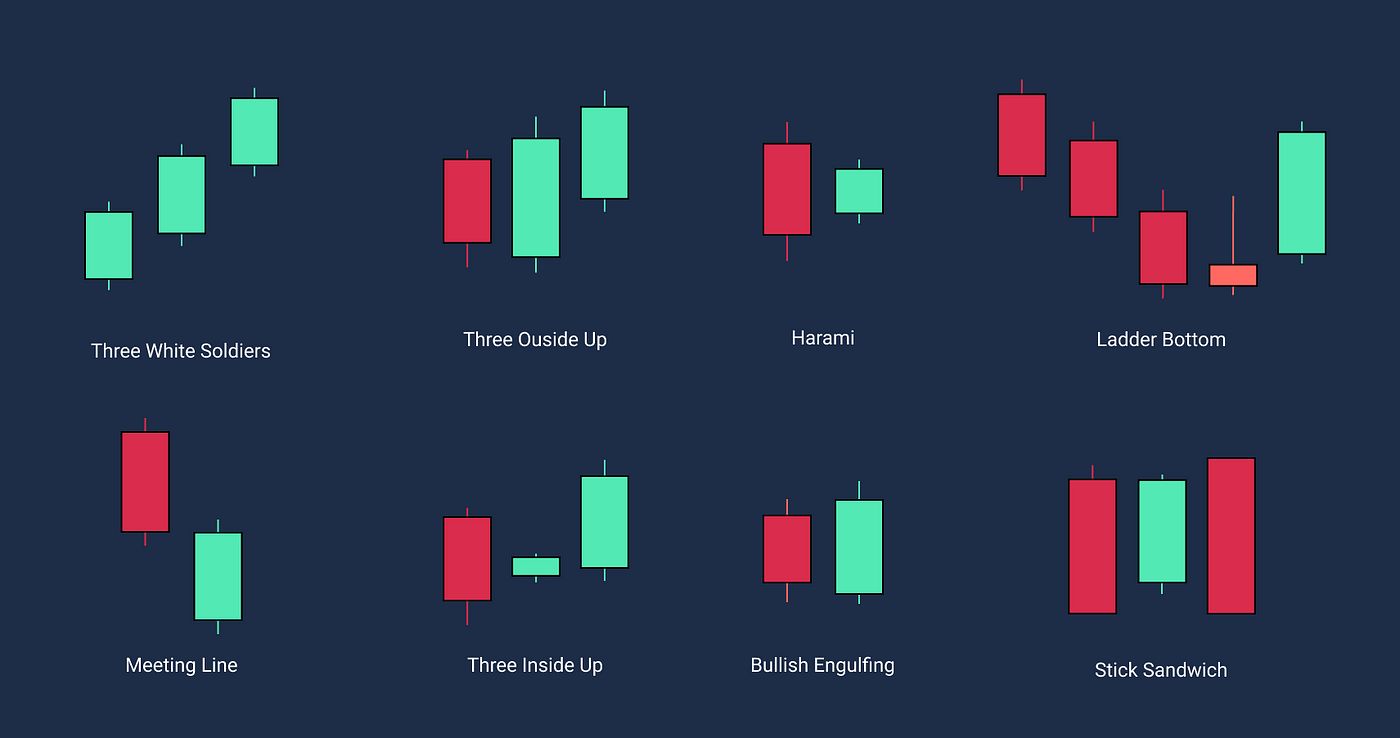
- Bullish Engulfing: The bullish engulfing pattern occurs when a small bearish candle is followed by a larger bullish candle that completely engulfs the previous one. This is seen as a strong bullish signal, suggesting that buyers have taken control of the market.
- Bearish Engulfing: The bearish engulfing pattern is the opposite of the bullish engulfing pattern. It occurs when a small bullish candle is followed by a larger bearish candle that engulfs the previous one. This signals a bearish sentiment, indicating that sellers have dominated the market.
These are just a few examples of the many candlestick patterns that traders use to interpret price movements. Each pattern has its own significance and can be a valuable tool in predicting market trends.
Now that we’ve covered the types of crypto candles, let’s dive into the anatomy of a candlestick to understand how to read them effectively.
Anatomy of a crypto candle
To effectively read and interpret crypto candles, it’s important to understand their anatomy and the information they convey. A typical candlestick consists of three main components: the body, the wick, and the color.
The body of the candle represents the price range between the opening and closing prices during the specified time period. If the closing price is higher than the opening price, the body is usually colored green or blue to indicate a bullish or positive movement. Conversely, if the closing price is lower than the opening price, the body is colored red or orange to signify a bearish or negative movement.
The length or size of the body reflects the magnitude of the price movement. A longer body suggests a significant price change, while a shorter body indicates a relatively small price movement.
The wick, also referred to as the shadow, represents the high and low prices reached during the specified time period. The upper wick extends from the top of the body and indicates the highest price reached, while the lower wick extends from the bottom of the body and represents the lowest price reached.
The length of the wicks provides valuable information about market sentiment. If the upper wick is longer, it suggests that prices reached higher levels but were ultimately rejected, indicating selling pressure. Conversely, if the lower wick is longer, it implies that prices dipped lower but were quickly pulled back up, indicating buying pressure.
Candlesticks come in various shapes and sizes, each with its own significance. Long-bodied candles signify strong buying or selling pressure, while short-bodied candles indicate indecision or a lack of strong market sentiment.
Understanding the anatomy of a candlestick is crucial for accurate analysis and prediction of price movements. By paying close attention to the body, wick, and color, traders can gain insights into market sentiment and make informed trading decisions.
Now that we have a clear understanding of the anatomy of a crypto candle, let’s explore some of the common candlestick patterns and their implications in the next section.
Understanding candlestick patterns
Candlestick patterns are formations created by one or more consecutive candlesticks on a chart. These patterns provide traders with valuable insights into market sentiment and can help predict future price movements.
There are two main types of candlestick patterns: reversal patterns and continuation patterns.
Reversal patterns: Reversal patterns suggest a change in the direction of the prevailing trend. They indicate that the market sentiment is shifting from bullish to bearish or vice versa.
Examples of reversal patterns include:
- Head and Shoulders: This pattern consists of three peaks, with the middle peak being the highest. It suggests a trend reversal from bullish to bearish.
- Double Top: A double top pattern occurs when the price forms two consecutive peaks of similar height, indicating a potential reversal from bullish to bearish.
- Double Bottom: The double bottom pattern is the opposite of the double top. It occurs when the price forms two consecutive bottoms of similar depth, indicating a potential reversal from bearish to bullish.
- Wedge: A wedge pattern forms when the price consolidates between two converging trend lines. It suggests a potential reversal in the prevailing trend.
Continuation patterns: Continuation patterns indicate a temporary pause in the prevailing trend before it continues in the same direction. These patterns suggest that the market sentiment remains unchanged.
Examples of continuation patterns include:
- Flags: Flags are small rectangular patterns that form after a sharp price movement. They suggest a short-term consolidation before the prevailing trend resumes.
- Triangles: Triangles are continuation patterns that form when the price consolidates between two converging trend lines. They indicate a temporary balance between buyers and sellers before the trend continues.
- Pennants: Pennants are small triangular patterns that resemble a flag. They indicate a short-term consolidation before the trend resumes.
It’s important to note that candlestick patterns should not be considered in isolation but rather in conjunction with other technical indicators and market factors. Combining candlestick patterns with other tools, such as trend lines, moving averages, and volume analysis, can provide a more comprehensive view of market conditions.
Now that we have explored the various candlestick patterns, let’s delve into how to read candlestick charts effectively in the next section.
Common candlestick patterns
Candlestick patterns are powerful tools used by traders to predict market trends and make informed trading decisions. In this section, we will explore some of the most commonly observed candlestick patterns and what they indicate:
- Hammer: A hammer candlestick has a small body with a long lower shadow. It is considered a bullish reversal pattern, suggesting that buyers have entered the market and the price may start to rise.
- Shooting Star: The shooting star candlestick has a small body with a long upper shadow. It is seen as a bearish reversal pattern, indicating that sellers have gained control and the price may start to decline soon.
- Doji: A doji candlestick has a small body, indicating that the opening and closing prices are very close to each other. This pattern suggests market indecision and can be a precursor to a trend reversal.
- Bullish Engulfing: The bullish engulfing pattern occurs when a small bearish candle is followed by a larger bullish candle that completely engulfs the previous one. This indicates a shift from bearish to bullish sentiment and can be a strong buying signal.
- Bearish Engulfing: The bearish engulfing pattern is the opposite of the bullish engulfing pattern. It occurs when a small bullish candle is followed by a larger bearish candle that engulfs the previous one. This signals a shift from bullish to bearish sentiment and can be a strong selling signal.
- Dark Cloud Cover: The dark cloud cover pattern occurs when a bullish candle is followed by a bearish candle that opens higher than the previous candle’s high and closes below the midpoint of the previous candle’s body. This suggests a potential trend reversal.
- Piercing Line: The piercing line pattern is the opposite of the dark cloud cover. It occurs when a bearish candle is followed by a bullish candle that opens lower than the previous candle’s low and closes above the midpoint of the previous candle’s body. This signals a potential bullish reversal.
These are just a few examples of the many candlestick patterns used by traders. Each pattern carries its own meaning and significance, and they can be combined with other technical analysis tools to improve the accuracy of trading decisions.
It’s important to note that candlestick patterns are not foolproof indicators and should not be relied upon in isolation. They are most effective when considered in the context of broader market trends, support and resistance levels, and other technical indicators.
Now that we have explored common candlestick patterns, let’s move on to the next section, where we will discuss how to read candlestick charts effectively.
Reading candlestick charts
Candlestick charts provide traders with a visual representation of price movements and are widely used in technical analysis. To effectively read a candlestick chart, it’s important to understand the information conveyed by each individual candlestick and how they form patterns over time.
The basic elements of a candlestick chart have been covered in the previous sections. Now, let’s explore how to interpret these elements and gain insights about market sentiment:
1. Analyzing the body: The body of a candlestick represents the price range between the opening and closing prices. A larger body suggests a significant price movement, while a smaller body indicates a more subdued price action. The color of the body (green/blue for bullish, red/orange for bearish) indicates the direction of the price movement.
2. Examining the wicks: The wicks, or shadows, of a candlestick represent the highest and lowest prices reached during the specified time period. The length of the upper and lower wicks helps determine market sentiment. Longer upper wicks suggest selling pressure, while longer lower wicks indicate buying pressure.
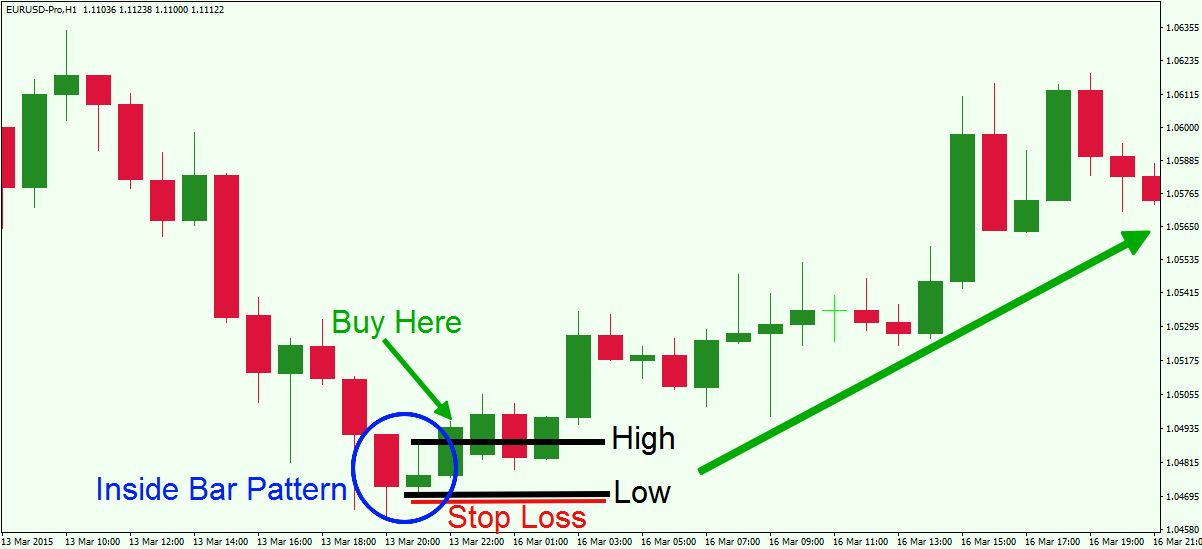
3. Identifying patterns: By closely observing the shapes and sequences of candlesticks, traders can identify various candlestick patterns. These patterns, as discussed previously, can provide valuable insights into market trends and potential price reversals.
4. Understanding candlestick patterns in context: It’s important to analyze candlestick patterns in the context of the overall market environment. This includes considering support and resistance levels, trend lines, volume, and other technical indicators. Combining multiple signals and confirming patterns can strengthen the reliability of predictions made from candlestick analysis.
5. Paying attention to timeframes: Candlestick charts can be viewed at various timeframes, such as minutes, hours, days, or weeks. It’s important to choose a timeframe that aligns with your trading strategy and goals. Shorter timeframes provide more granular details, while longer timeframes offer a broader perspective.
Reading candlestick charts is a skill that develops over time with practice and experience. It requires the ability to interpret price movements, understand market sentiment, and make informed trading decisions based on the patterns observed.
Now that we have covered how to read candlestick charts, let’s move on to the final section, where we’ll share some tips for effectively reading crypto candles.
Tips for reading crypto candles
Reading crypto candles can be a complex task that requires careful observation and analysis. To enhance your ability to interpret candlestick charts effectively, consider the following tips:
1. Familiarize yourself with candlestick patterns: Learn and understand the various candlestick patterns and their implications. This knowledge will allow you to identify potential trend reversals and make informed trading decisions.
2. Use multiple timeframes: Analyze candlestick charts across different timeframes to gain a comprehensive view of market trends. Shorter timeframes provide more detailed information, while longer timeframes offer a broader perspective.
3. Combine with other technical indicators: Use candlestick patterns in conjunction with other technical analysis tools such as trend lines, moving averages, and volume indicators. This will help confirm and strengthen your analysis.
4. Consider market context: Take into account the broader market environment, including support and resistance levels, market news, and overall market sentiment. This context will provide additional insights into the potential impact of candlestick patterns.
5. Practice risk management: Implement proper risk management strategies such as setting stop-loss orders and establishing realistic profit targets. This will help protect your capital and minimize potential losses.
6. Keep emotions in check: Avoid making impulsive decisions based solely on candlestick patterns. Emotions can cloud judgment and lead to poor trading choices. Stick to your trading plan and rely on data-driven analysis.
7. Continuously learn and adapt: The cryptocurrency market is ever-evolving. Stay updated with the latest trends, news, and trading strategies. Keep refining your skills and adapt your approach as needed.
8. Practice patience: Successful trading requires patience. Not every candlestick pattern will result in a profitable opportunity. Wait for confirmation and be selective in your trades.
9. Utilize demo accounts: Practice reading crypto candles on demo accounts before risking real money. This will help you gain experience and confidence in your analysis without incurring any financial losses.
By following these tips and continuously learning from your trading experiences, you can improve your ability to read crypto candles and make informed trading decisions in the dynamic cryptocurrency market.
With a solid understanding of candlestick patterns and chart analysis, you’ll be better equipped to navigate the complexities of the cryptocurrency market.
Now that we’ve covered these valuable tips, you are ready to apply them in your trading journey.
Conclusion
Crypto candles, or candlestick charts, are invaluable tools for traders in the cryptocurrency market. By understanding the anatomy of a candle, recognizing common candlestick patterns, and effectively reading candlestick charts, traders can gain valuable insights into market sentiment and make informed trading decisions.
Throughout this article, we have explored various aspects of crypto candles, including their definition, types, patterns, and the process of reading and interpreting them. We have also shared tips to enhance your skills in this area.
It’s important to remember that while candlestick patterns and chart analysis can provide valuable insights, they should not be the sole basis for trading decisions. It’s essential to consider other factors such as market trends, fundamental analysis, and risk management strategies.
To truly master the art of reading crypto candles, practice and experience are key. Continuously studying and refining your skills will help you become a more proficient trader in the cryptocurrency market.
Now armed with knowledge and the tips provided, it’s time to apply what you’ve learned and start analyzing crypto candles with confidence. Embrace the ever-changing nature of the market, stay disciplined, and always be open to learning from your experiences.
Happy trading!