Introduction
Welcome to the exciting world of price action trading! If you are interested in forex trading, stocks, or any other financial markets, understanding price action is crucial for your success. Price action refers to the analysis of historical price movement to make informed trading decisions, without relying on indicators or other technical tools.
Price action trading is a popular approach among experienced traders as it provides valuable insights into market sentiment and the behavior of buyers and sellers. By observing price patterns, identifying support and resistance levels, and analyzing trends, traders can develop effective strategies to capitalize on market opportunities.
In this article, we will delve into the concept of price action, explore the various aspects of analyzing price movements, and discuss the benefits of incorporating price action strategies into your trading approach.
But why is price action so important in trading? Let’s find out.
Price action allows traders to understand the underlying dynamics of the market. By analyzing the purest form of market data – the price – traders gain valuable insights into market psychology and can identify key turning points to enter or exit trades.
Unlike relying solely on technical indicators, price action analysis helps traders gain a deeper understanding of market movements by considering the historical context of price levels and patterns. This enables traders to make more informed decisions and adapt to changing market conditions.
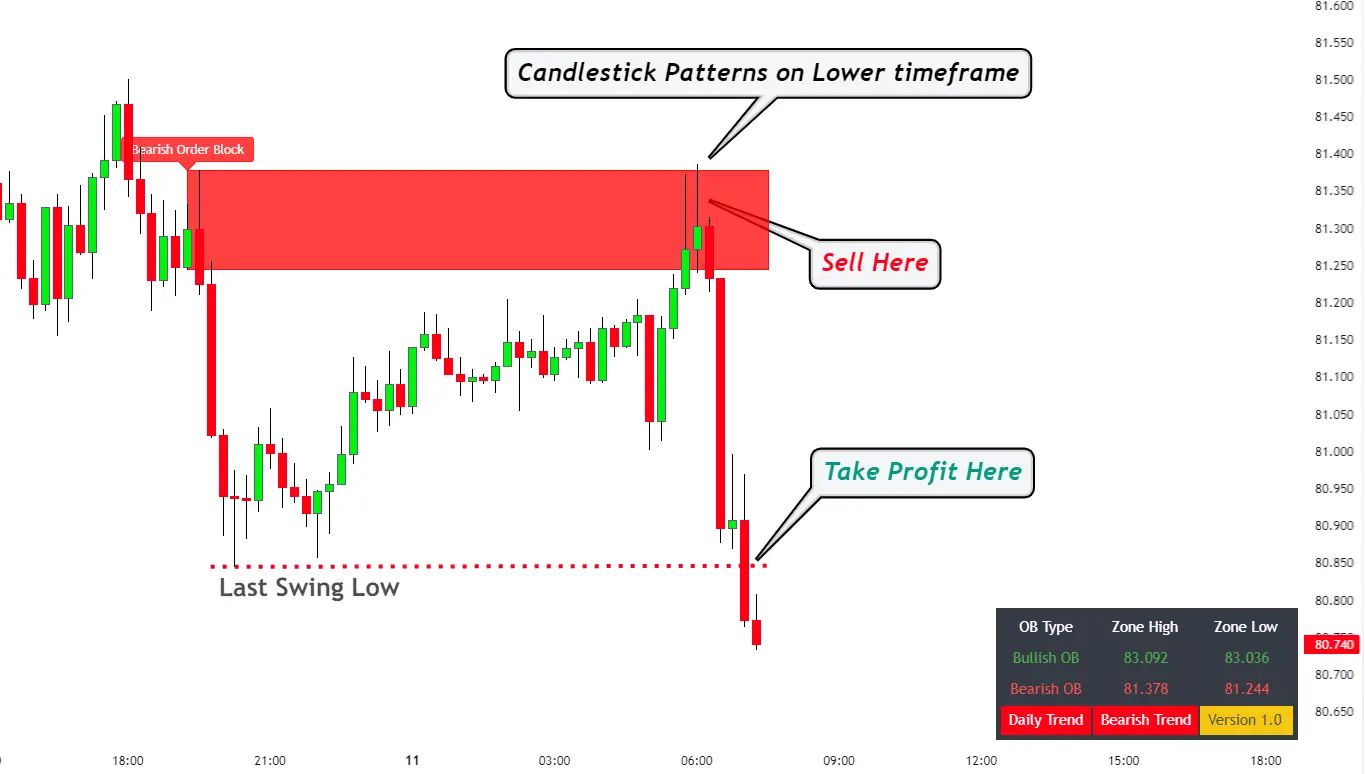
Another crucial aspect of price action analysis is the use of candlestick patterns. Candlesticks, with their various shapes and formations, represent the open, high, low, and closing prices for a specific period. Understanding candlestick patterns can provide valuable clues about the market sentiment and potential trend reversals, giving traders an edge in their trading decisions.
Definition of Price Action
Price action, in its simplest form, refers to the analysis of historical price movements in order to predict future price movements and make trading decisions. It is a method of trading that focuses on the actual price of a financial instrument, without relying heavily on indicators or other technical tools.
Price action traders believe that all relevant information about a market is reflected in its price, making it the most important factor to consider when making trading decisions. By studying patterns, trends, and key levels in price charts, traders attempt to identify high-probability trading opportunities.
Price action analysis involves observing and interpreting candlestick patterns, support and resistance levels, trend lines, and other visual cues provided by the price chart. Traders examine how price has reacted in the past at certain levels and use that information to anticipate future price movements.
One of the fundamental principles of price action trading is the concept of support and resistance. Support levels are price levels where buying pressure is strong enough to prevent further decline, causing prices to bounce back. Resistance levels, on the other hand, are price levels where selling pressure is strong enough to prevent further upward movement, causing prices to reverse.
Price action traders also pay close attention to trend analysis. By identifying trends – whether they are up, down, or sideways – traders can align their trades with the dominant market direction, increasing the probability of success. Trend lines, moving averages, and other trend indicators are commonly used tools in price action analysis.
It is important to note that price action trading is subjective and requires traders to develop their own interpretations and strategies. While there are common patterns and principles, each trader may have their own unique approach to analyzing price action and making trading decisions.
In the next sections, we will explore various price action strategies and their benefits, allowing you to further understand and apply this powerful trading approach.
Why Price Action?
Price action is a favored approach among many experienced traders for several compelling reasons. Let’s explore why price action analysis can be a valuable tool in your trading arsenal.
1. Simplicity: One of the primary advantages of price action trading is its simplicity. Instead of relying on complex indicators and algorithms, price action traders focus on analyzing the purest form of market data: price movement. By studying how prices behave at key levels and in specific patterns, traders can gain insights into market dynamics without overwhelming themselves with too many technical tools.
2. Real-Time Market Analysis: Price action analysis allows traders to observe and analyze the market in real-time. Rather than relying on lagging indicators or waiting for economic news releases, price action traders can identify trading opportunities as they happen. This real-time analysis enables quick decision-making and the ability to promptly react to changes in market conditions.
3. Adaptability: Price action analysis is highly adaptable to different market conditions. Whether the market is trending, ranging, or experiencing volatility, price action techniques can be applied effectively. Traders can adjust their strategies and trading plans based on the current market environment, allowing them to stay nimble and capitalize on opportunities across various market conditions.
4. Objective Analysis: Price action analysis allows for objective decision-making. Since it relies on observable patterns and levels on the charts, traders can avoid emotional biases and make rational trading decisions based on price data. This objectivity can help traders avoid impulsive trades and stick to their trading plans, leading to more consistent and disciplined trading.
5. Complement to Fundamental Analysis: Price action analysis is a powerful complement to fundamental analysis. While fundamental analysis focuses on economic data, news events, and company fundamentals, price action analysis provides insights into how market participants are reacting to that information. By combining both approaches, traders can have a more comprehensive understanding of the market and make informed trading decisions.
6. Flexibility in Timeframe: Price action analysis can be utilized across different timeframes, from short-term intraday trading to longer-term swing trading or position trading. Traders can apply price action techniques to their preferred timeframe and trading style, providing flexibility and adaptability to individual preferences.
Overall, price action trading offers simplicity, real-time analysis, adaptability, objectivity, and flexibility in timeframe. By focusing on price patterns, levels, and trends, traders can gain a deeper understanding of market dynamics and potentially increase their trading success.
Understanding Candlestick Patterns
Candlestick patterns are a fundamental component of price action analysis. They provide visual representations of price movement within a specific timeframe and offer valuable insights into market sentiment and potential trend reversals. Let’s explore some of the key candlestick patterns that traders commonly use to make informed trading decisions.
1. Bullish/Bearish Engulfing: These patterns consist of two candlesticks, where the second candle completely engulfs the previous candle. A bullish engulfing pattern occurs when a smaller bearish candle is followed by a larger bullish candle, indicating a potential trend reversal from bearish to bullish. Conversely, a bearish engulfing pattern occurs when a smaller bullish candle is followed by a larger bearish candle, signaling a potential trend reversal from bullish to bearish.
2. Hammer/Inverted Hammer: These patterns have long lower shadows and small bodies. A hammer occurs at the bottom of a downtrend and signals a potential bullish reversal, indicating that the buying pressure is starting to outweigh the selling pressure. An inverted hammer occurs at the top of an uptrend and suggests a potential bearish reversal, indicating that selling pressure may be increasing.
3. Doji: A doji is a candlestick pattern with a small body and nearly equal open and close prices. It represents indecision in the market, signaling that neither buyers nor sellers have taken control. A doji can indicate a potential trend reversal if it occurs after a strong move up or down, as it suggests a loss of momentum.
4. Morning Star/Evening Star: These patterns consist of three candlesticks and are often seen at the end of a trend. A morning star pattern occurs in a downtrend and consists of a large bearish candle, followed by a small bullish or bearish doji, and then a large bullish candle. This pattern indicates a potential bullish reversal. An evening star pattern occurs in an uptrend and consists of a large bullish candle, followed by a small bullish or bearish doji, and then a large bearish candle. This pattern suggests a potential bearish reversal.
5. Shooting Star/Inverted Hammer: These patterns have long upper shadows and small bodies. A shooting star occurs at the top of an uptrend and suggests a potential bearish reversal. It indicates that selling pressure is starting to outweigh buying pressure. An inverted hammer occurs at the bottom of a downtrend and signals a potential bullish reversal, indicating that buying pressure may be increasing.
These are just a few examples of the many candlestick patterns that traders use to identify potential trading opportunities. Each pattern can provide valuable insights into market sentiment and trend reversals. It is important to remember that candlestick patterns should be used in conjunction with other technical analysis tools and confirmation from the overall market context.
By understanding and recognizing these candlestick patterns, traders can enhance their ability to make informed trading decisions and increase their chances of success in the market.
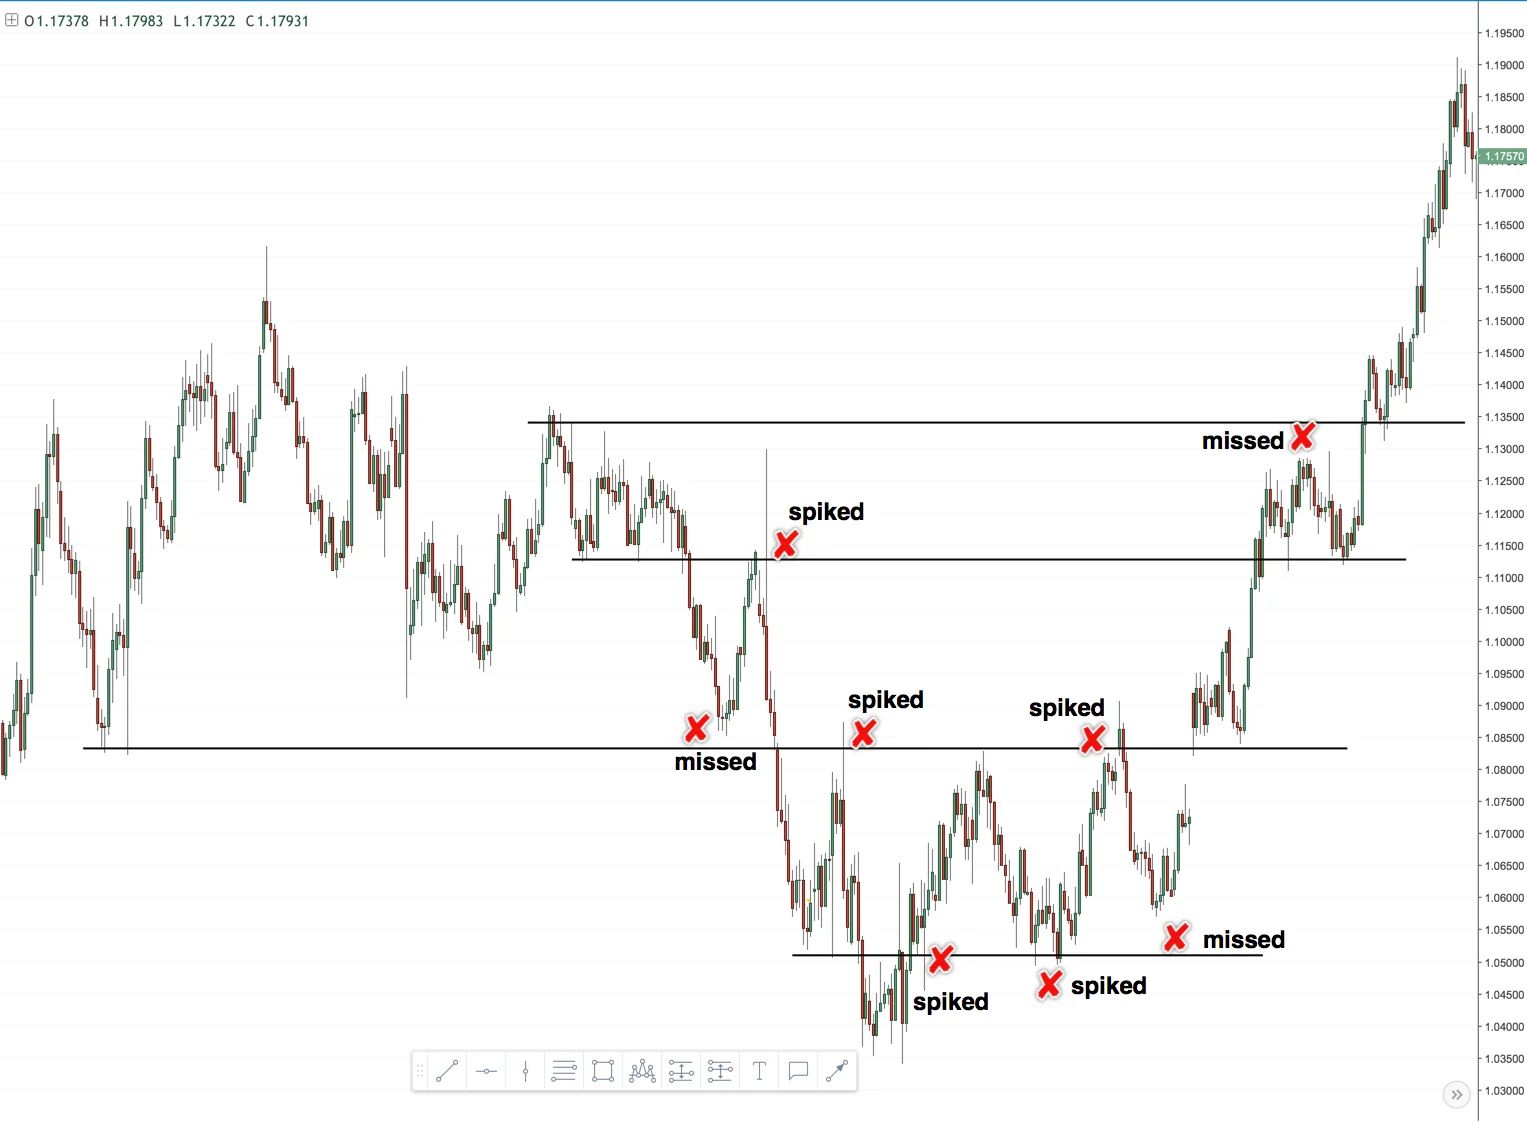
Support and Resistance Levels
Support and resistance levels are key concepts in price action analysis. They represent price levels where buying pressure (support) or selling pressure (resistance) is strong enough to prevent further price movement. By identifying and analyzing these levels, traders can make more informed trading decisions and increase their chances of success in the market.
Support levels are price levels where demand for a particular asset is strong enough to push prices higher, causing them to bounce back from that level. Traders often view support levels as good buying opportunities since they represent areas where market participants are willing to enter or add to their positions. When prices approach a support level, traders watch for signs of a bounce or a potential reversal in the market direction.
Resistance levels, on the other hand, are price levels where supply for an asset is strong enough to push prices lower, causing them to reverse or consolidate. These levels often act as barriers that prevent further upward movement. Traders view resistance levels as potential selling opportunities, as they represent areas where market participants are more likely to take profits or initiate short positions. When prices approach a resistance level, traders watch for signs of rejection or a potential reversal in the market direction.
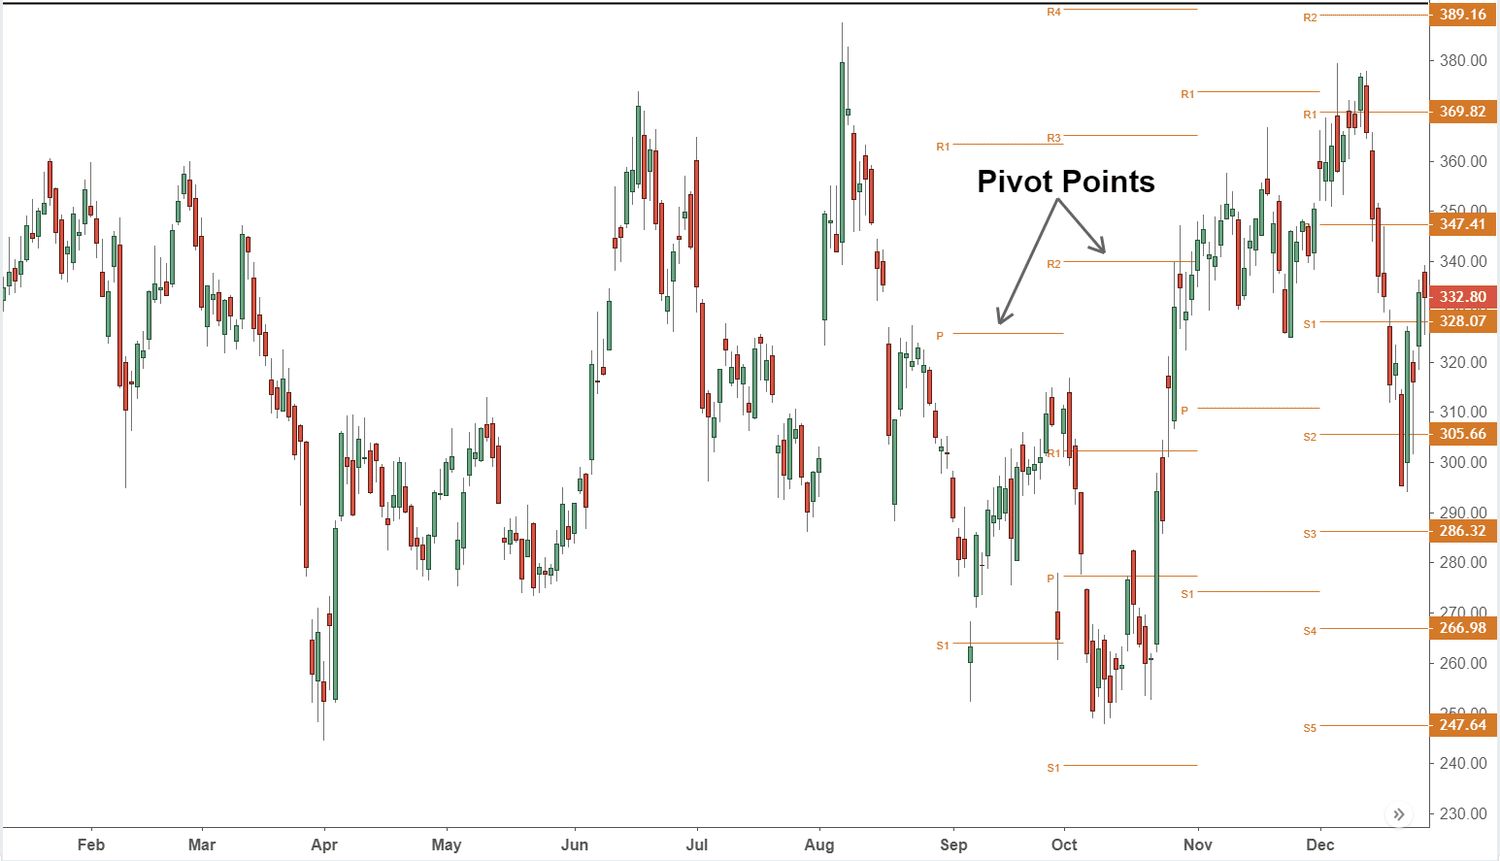
To identify support and resistance levels, traders often look for areas on the price chart where prices have historically reversed or consolidated. These areas can be determined using various techniques, such as drawing trend lines, identifying swing highs and lows, or using technical indicators like moving averages or Fibonacci retracements.
Support and resistance levels can also be identified based on psychological factors. For example, round numbers or significant price levels that end in 00 or 50 often act as strong support or resistance levels due to the psychological impact they have on traders.
It is important to note that support and resistance levels are not fixed or guaranteed to hold indefinitely. They can be broken at times, leading to a potential change in market dynamics. When a support level is breached, it becomes a potential resistance level, and vice versa.
Understanding and analyzing support and resistance levels can provide valuable insights into market sentiment and potential price reversals. Traders look for confluence, where multiple support or resistance levels intersect, as it strengthens the significance of those levels. By combining support and resistance analysis with other price action techniques, traders can make more informed trading decisions and increase their probabilities of success in the market.
Trend Analysis
Trend analysis is a crucial aspect of price action trading that helps traders identify the direction and strength of the market. By understanding the prevailing trend, traders can align their trades with the market momentum and increase their chances of successful outcomes.
A trend is the direction in which a market is moving over a certain period of time. It can be classified as an uptrend, downtrend, or sideways (also known as a ranging or consolidating) trend.
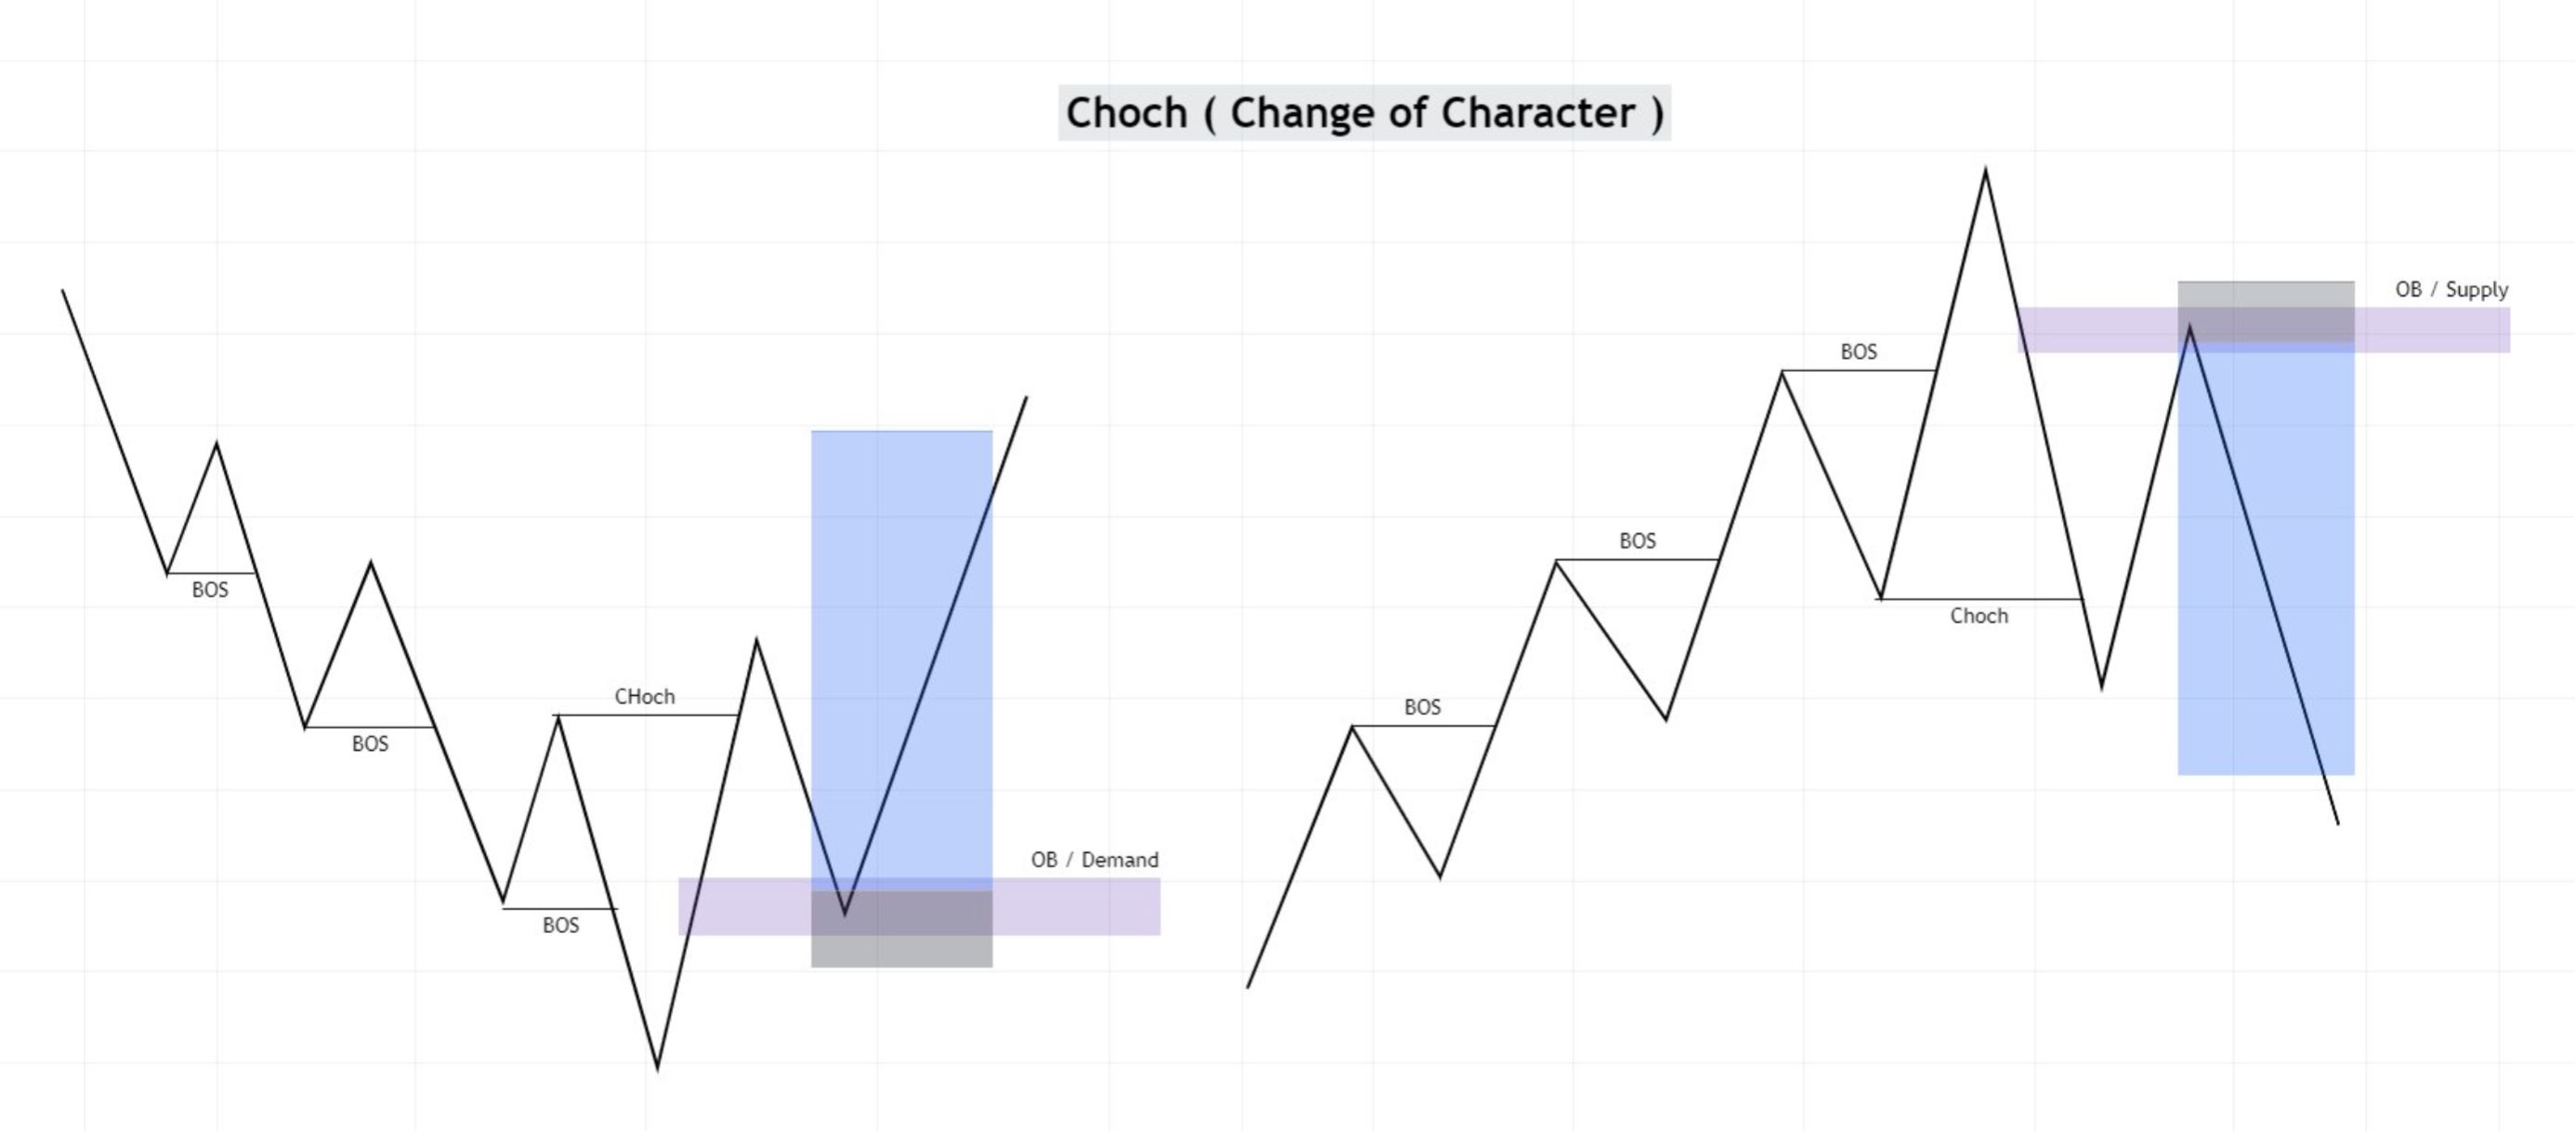
An uptrend occurs when prices consistently make higher highs and higher lows. This indicates that buyers are in control, pushing the market higher. Traders look for opportunities to buy in an uptrend, anticipating further price advances.
A downtrend, on the other hand, is characterized by a series of lower highs and lower lows. This suggests that sellers are dominating the market, pushing prices lower. Traders in a downtrend typically look for selling opportunities, expecting further price declines.
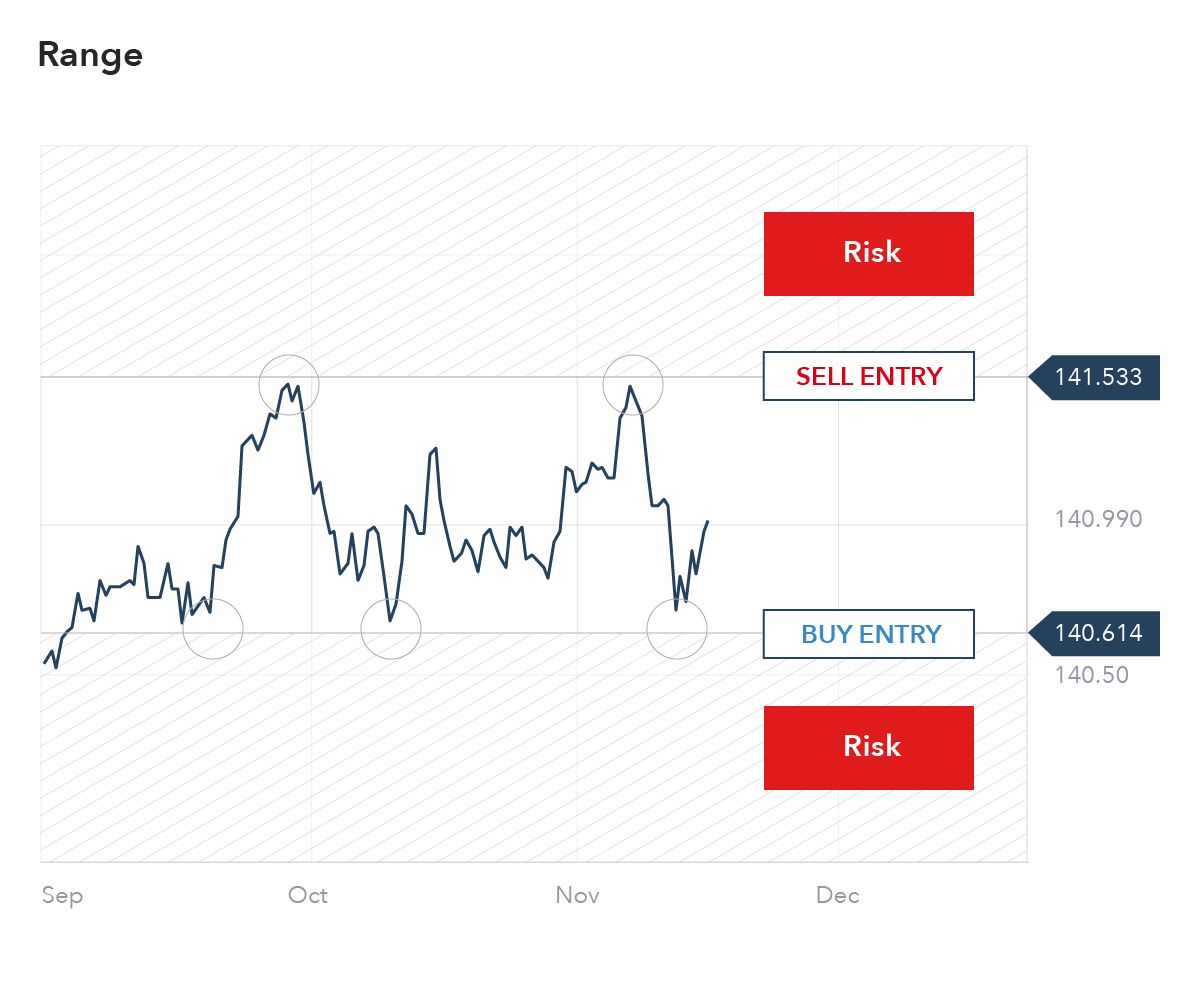
A sideways or ranging trend occurs when prices move within a defined range, without a clear and sustained upward or downward movement. Traders in a ranging market may choose to trade range-bound strategies, buying at support levels and selling at resistance levels until the market breaks out of the range.
There are various methods traders use to identify trends, such as trendlines, moving averages, or pattern recognition. Trendlines are drawn by connecting a series of higher lows in an uptrend or lower highs in a downtrend, providing a visual representation of the trend direction.
Moving averages are commonly used indicators to identify and confirm trends. A simple moving average (SMA) calculates the average price over a specific time period and plots it on the chart. Traders often use the crossover of different time period moving averages, such as the 50-day and 200-day SMAs, to identify trend changes.
Pattern recognition involves identifying recurring chart patterns that indicate a particular trend. Some popular trend continuation patterns include flags, pennants, and triangles, while reversal patterns include double tops, double bottoms, and head and shoulders patterns.
Once the trend is identified, traders can adjust their trading strategies accordingly. Trend following strategies are used in trending markets, aiming to capture the momentum of the trend and ride it until signs of a reversal occur. Contrarian strategies, on the other hand, look for trend reversals and attempt to profit from market turning points.
Trend analysis is essential for traders as it provides a framework for decision-making. Trading in the direction of the trend increases the probability of success and reduces the likelihood of entering trades against the prevailing market momentum.
However, it is important for traders to remember that trends can change, and market conditions can shift. Therefore, it is advisable to use other tools and techniques in conjunction with trend analysis to confirm trading opportunities and manage risk effectively.
Price Action Strategies
Price action trading offers a wide range of strategies that traders can use to analyze and make trading decisions based on price patterns and market behavior. These strategies utilize various price action techniques and provide a framework for identifying potential trading opportunities. Let’s explore some common price action strategies that traders employ.
1. Breakout Strategy: This strategy involves identifying key support and resistance levels and looking for breakouts. Traders anticipate a breakout above a resistance level or below a support level as a sign of a potential trend continuation. They may enter trades when prices break out of these levels and aim to ride the momentum of the breakout.
2. Pullback Strategy: Pullback, also known as retracement or correction, occurs when prices temporarily reverse against the prevailing trend. Traders using this strategy look for pullbacks within a trend and enter trades at favorable price levels to capitalize on potential trend continuation. They may use Fibonacci retracements or moving averages to identify potential pullback levels.
3. Support and Resistance Strategy: This strategy focuses on the analysis of support and resistance levels. Traders identify key levels where price has historically reversed or consolidated and look for trading opportunities when prices approach these levels. They may enter trades when prices bounce off support or resistance, or when these levels are broken.
4. Candlestick Pattern Strategy: Candlestick patterns offer valuable insights into market sentiment and potential reversals. Traders using this strategy analyze the formation of candlestick patterns such as dojis, engulfing patterns, or hammers, and interpret them as potential signals for entry or exit. They may combine candlestick patterns with other indicators or confirmation from the overall market context.
5. Trend Following Strategy: Trend following strategies aim to capture and ride the momentum of a trending market. Traders using this strategy identify the prevailing trend and enter trades in the direction of that trend. They may use trendlines, moving averages, or other trend indicators to confirm the trend and determine favorable entry and exit points.
6. Price Action Scalping: Scalping is a short-term trading strategy that aims to capture small price moves throughout the day. Traders using this strategy focus on quick trades based on price action signals, often in highly liquid markets. They may use chart patterns, support and resistance levels, or volatility indicators to identify scalp trading opportunities.
It’s important to note that these strategies are just a few examples, and there are many other variations and combinations that traders can explore based on their preferences and trading style. Traders often develop their own unique approaches by combining different price action techniques and indicators to suit their trading goals.
Regardless of the strategy chosen, the key to successful price action trading lies in understanding and interpreting price patterns, levels, and market behavior. It requires practice, experience, and a deep understanding of the underlying principles of price action analysis.
Benefits of Price Action Trading
Price action trading offers several benefits to traders of all experience levels. Let’s explore some of the key advantages of incorporating price action analysis into your trading approach.
1. Clear and Objective Decision-Making: Price action analysis allows traders to make clear and objective trading decisions based on the information provided by the price chart. By focusing on price patterns, support and resistance levels, and trends, traders can obtain a clear picture of market dynamics without relying solely on subjective indicators or complex trading systems.
2. Adaptability to Changing Market Conditions: Price action trading techniques can be applied to various market conditions, including trending, ranging, and volatile markets. This adaptability allows traders to adjust their strategies based on the current market environment, increasing their chances of success regardless of the prevailing conditions.
3. Sensitivity to Market Sentiment: Price action analysis provides insights into market sentiment by observing how prices behave in response to certain levels or events. By understanding the psychology of buyers and sellers, price action traders can anticipate potential market reversals or continuations, giving them an edge in their trading decisions.
4. Reduced Lag and Real-Time Analysis: Price action analysis offers real-time insights into the market, allowing traders to make timely trading decisions. Unlike lagging indicators that rely on historical data, price action techniques provide a current view of market dynamics, enabling traders to act upon potential trading opportunities as they arise.
5. Enhanced Risk Management: Price action trading encourages disciplined risk management. Traders can define clear entry and exit points based on support and resistance levels or other price patterns, allowing them to set appropriate stop-loss and take-profit levels. This disciplined approach to risk management helps traders control their losses and maximize their potential profits.
6. Combines Well with Other Trading Approaches: Price action analysis can be seamlessly integrated with other trading approaches, such as fundamental analysis or indicator-based systems. By combining different methodologies, traders can gain a more comprehensive understanding of the market and confirm trading opportunities from multiple perspectives.
7. Improved Trading Psychology: Price action trading promotes a disciplined and patient mindset, helping traders to overcome emotions such as fear and greed. By focusing on objective price-based information, traders can develop a more reliable and consistent trading approach, leading to improved trading psychology over time.
8. Suitable for Multiple Timeframes: Price action analysis can be applied to various timeframes, from short-term scalping to longer-term swing trading or position trading. This versatility allows traders to adapt their strategies to their preferred timeframe and trading style, catering to individual preferences and trading goals.
Overall, price action trading offers clear and objective decision-making, adaptability, sensitivity to market sentiment, reduced lag, enhanced risk management, compatibility with other trading approaches, improved trading psychology, and suitability across multiple timeframes. Incorporating price action analysis into your trading approach can help you gain a deeper understanding of price dynamics and increase your chances of success in the market.
Conclusion
Price action trading is a powerful approach that provides traders with valuable insights into the market. By analyzing historical price movements, identifying patterns, and understanding key levels, traders can make informed trading decisions based on price action analysis.
Throughout this article, we have explored the definition of price action, the significance of understanding candlestick patterns, the importance of support and resistance levels, the role of trend analysis, and various price action strategies. We have also discussed the benefits of incorporating price action trading into your approach.
Price action trading offers simplicity, real-time analysis, adaptability, objectivity, and flexibility in timeframe. It allows traders to gain a deeper understanding of market dynamics, make clear and objective trading decisions, and manage risk effectively. Price action analysis can be integrated with other trading approaches, promoting a comprehensive understanding of the market.
While price action trading does require practice and experience to master, it provides traders with a solid foundation for navigating the dynamic and ever-changing financial markets. By consistently applying price action techniques, traders can develop a deeper intuition for market behavior and increase their chances of success.
Remember, price action analysis is subjective in nature, and each trader may develop their own unique approach based on their preferences and trading style. It is important to continue learning and honing your skills in price action analysis, adapting to evolving market conditions and refining your strategies.
So, whether you are a novice trader just starting your journey or an experienced professional looking to enhance your trading approach, incorporating price action analysis can be a valuable tool in your arsenal. Embrace the power of price action to gain a deeper understanding of the market, make informed trading decisions, and increase your chances of achieving consistent profitability.