Introduction
Welcome to the fascinating world of trading! As a trader, you are constantly seeking ways to gain an edge in the market, to predict future price movements, and to make profitable trading decisions. One powerful tool at your disposal is the concept of divergence.
Divergence refers to a discrepancy or disagreement between price and an indicator or between two different indicators. By analyzing these divergences, traders can gain valuable insights into potential trend reversals or continuations, providing an opportunity to enter or exit trades at favorable prices.
Divergence is a widely used concept in various trading strategies, such as trend following, momentum trading, and mean reversion. It is applicable to any financial market and timeframe, making it a versatile tool for traders of all experience levels.
In this article, we will explore the definition of divergence, discuss its various types, explain how to identify divergence in the market, and provide examples of its application in trading strategies. We will also highlight the benefits and drawbacks of trading divergence, allowing you to make informed decisions when incorporating it into your trading arsenal.
By the end of this article, you will have a solid understanding of divergence and how it can enhance your trading outcomes. So, let’s dive in and explore the exciting world of trading divergence!
Definition of Divergence
Divergence in trading refers to a situation where the price of an asset moves in the opposite direction of a related indicator or another indicator. It represents a shift in momentum or a potential reversal in the current trend. By identifying and analyzing these divergences, traders can gain valuable insights into the market’s dynamics and make informed trading decisions.
Divergence can occur in different forms and under various scenarios. It is most commonly observed between price and an oscillating indicator, such as the Relative Strength Index (RSI), Moving Average Convergence Divergence (MACD), or Stochastic Oscillator. These indicators measure the momentum and overbought/oversold conditions in the market, providing traders with a deeper understanding of price movements.
There are two main types of divergence: bullish divergence and bearish divergence. Bullish divergence occurs when the price makes a lower low, but the indicator makes a higher low. This indicates a potential upcoming trend reversal from bearish to bullish. Conversely, bearish divergence occurs when the price makes a higher high, but the indicator makes a lower high. This suggests a possible shift from a bullish trend to a bearish one.
Divergence acts as a warning sign to traders, highlighting a potential shift in market sentiment. It indicates that the current trend may be weakening and that a trend reversal or correction might occur. By recognizing and interpreting these divergence patterns, traders can anticipate and profit from these market shifts.
It’s important to note that divergence alone shouldn’t be relied upon as the sole basis for making trading decisions. It should be used in conjunction with other technical analysis tools and indicators to confirm its validity. Additionally, false divergences can occur, so it’s crucial to exercise caution and verify the signals before taking any action.
Now that we understand the definition and significance of divergence in trading, let’s delve deeper into the different types of divergence and explore how they can be identified and utilized in trading strategies.
Types of Divergence
Divergence in trading can manifest in two main forms: bullish divergence and bearish divergence. Understanding the characteristics of each type is essential for successful trading.
1. Bullish Divergence: Bullish divergence occurs when the price of an asset forms a lower low, but the related indicator(s) show a higher low. This suggests that the selling pressure is weakening, indicating a potential reversal and the emergence of buying pressure. Traders interpret this as a signal to enter long positions or to close out short positions.
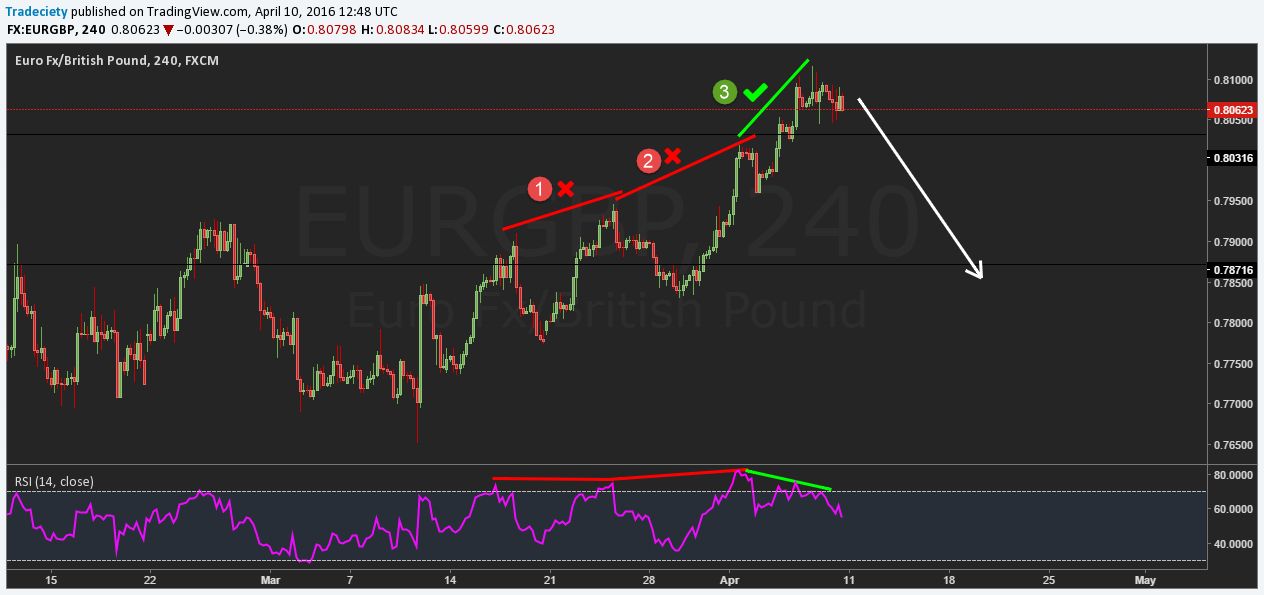
2. Bearish Divergence: Bearish divergence, on the other hand, occurs when the price of an asset forms a higher high, but the related indicator(s) form a lower high. This implies that the buying momentum is diminishing, signaling a potential reversal and the presence of selling pressure. Traders perceive this as a signal to enter short positions or to exit long positions.
It’s important to note that divergence can occur in multiple indicators simultaneously, increasing its significance. For example, if both the RSI and MACD show bullish divergence simultaneously, it strengthens the signal for a potential trend reversal or continuation.
While bullish and bearish divergence are the most common types, there are other variations that traders should be aware of:
3. Hidden Bullish Divergence: Hidden bullish divergence occurs when the price forms a higher low, but the indicator(s) form a lower low. This suggests that the buying pressure is stronger than it appears, indicating a potential continuation of the current upward trend. Traders interpret this as a signal to stay in long positions or to enter new ones.
4. Hidden Bearish Divergence: Hidden bearish divergence occurs when the price forms a lower high, but the indicator(s) form a higher high. This implies that the selling pressure is stronger than it appears, signaling a potential continuation of the current downward trend. Traders perceive this as a signal to stay in short positions or to enter new ones.
Recognizing and understanding these different types of divergence is crucial for traders to accurately interpret price movements and make informed trading decisions. In the next section, we will discuss how to identify divergence in the market.
Bullish Divergence
Bullish divergence is a powerful signal that suggests a potential reversal from a downtrend to an uptrend. It occurs when the price of an asset forms a lower low, but the related indicator(s) form a higher low. This discrepancy indicates that the selling pressure is weakening, and buyers may start to gain control of the market.
Traders use bullish divergence to identify potential buying opportunities or to exit short positions. It is a sign that the current downtrend may be losing strength and that a trend reversal or a substantial upward move may follow.
There are several types of indicators commonly used to identify bullish divergence, such as the Relative Strength Index (RSI), Moving Average Convergence Divergence (MACD), and Stochastic Oscillator. These indicators measure the strength and momentum of price movements in different ways.
When applying bullish divergence analysis, traders look for the following characteristics:
- The price should form a lower low, indicating a decline in the asset’s value.
- The indicator(s) should form a higher low, signaling that the selling pressure is weakening.
- Confirmation of the divergence by observing other technical indicators or chart patterns.
Once identified, traders can consider taking action based on bullish divergence signals. Some strategies include:
- Entering long positions: Traders may choose to enter a long position, anticipating a potential uptrend or a significant price increase.
- Exiting short positions: If already in a short position, bullish divergence can act as a signal to exit and minimize potential losses.
- Adjusting stop-loss levels: Traders can tighten stop-loss levels or move them higher to protect profits in anticipation of a trend reversal.
It’s important to note that bullish divergence alone is not a guaranteed indicator of a trend reversal. It should be used in conjunction with other technical analysis tools and indicators to confirm trading decisions. Additionally, false or weak divergences can occur, so it’s crucial to exercise caution and consider the overall market context.
Now that we have explored bullish divergence, let’s move on to understanding bearish divergence in the next section.
Bearish Divergence
Bearish divergence is a powerful signal that suggests a potential reversal from an uptrend to a downtrend. It occurs when the price of an asset forms a higher high, but the related indicator(s) form a lower high. This discrepancy indicates that the buying pressure is weakening, and sellers may start to gain control of the market.
Traders use bearish divergence to identify potential selling opportunities or to exit long positions. It is a sign that the current uptrend may be losing strength and that a trend reversal or a substantial downward move may follow.
Similar to bullish divergence, bearish divergence can be identified using various indicators such as the Relative Strength Index (RSI), Moving Average Convergence Divergence (MACD), or Stochastic Oscillator. These indicators help measure the strength and momentum of price movements.
When analyzing bearish divergence, traders look for the following characteristics:
- The price should form a higher high, indicating an increase in the asset’s value.
- The indicator(s) should form a lower high, signaling that the buying pressure is weakening.
- Confirmation of the divergence by observing other technical indicators or chart patterns.
Once bearish divergence is identified, traders can consider taking action based on the signals. Some strategies include:
- Entering short positions: Traders may choose to enter a short position, anticipating a potential downtrend or a significant price decrease.
- Exiting long positions: If already in a long position, bearish divergence can act as a signal to exit and lock in profits.
- Adjusting stop-loss levels: Traders can tighten stop-loss levels or move them lower to protect profits in anticipation of a trend reversal.
Like bullish divergence, bearish divergence should not be relied upon as the sole basis for making trading decisions. It should be used in conjunction with other technical analysis tools and indicators to confirm trading signals. Additionally, it’s important to be aware of false or weak divergences that may occur, and to consider the overall market context before taking any action.
Now that we understand bearish divergence, let’s move on to the next section where we will discuss how to identify divergence in the market.
How to Identify Divergence
Identifying divergence in the market is a crucial skill for traders, as it can provide valuable insight into potential trend reversals or continuations. While there are various indicators and methods to identify divergence, the following steps outline a general approach:
1. Select the appropriate indicators: Choose indicators that are commonly used to identify divergence, such as the Relative Strength Index (RSI), Moving Average Convergence Divergence (MACD), or Stochastic Oscillator. These indicators are widely available on most trading platforms and provide insights into price momentum and overbought/oversold conditions.
2. Compare price and indicators: Analyze the relationship between the price of the asset and the selected indicators. Look for discrepancies or divergences between the two. For bullish divergence, the price should form a lower low while the indicator(s) form a higher low. For bearish divergence, the price should form a higher high while the indicator(s) form a lower high.
3. Confirm the divergence: To strengthen the validity of the divergence signal, look for confirmation from other technical indicators or chart patterns. For example, you may observe a reversal pattern, such as a double bottom or a head and shoulders pattern, coinciding with the divergence signal.
4. Consider the timeframe: Divergence signals can vary depending on the timeframe you are analyzing. It’s essential to consider the timeframe relevant to your trading strategy. Divergence on longer timeframes tends to carry more significant implications than divergence on shorter timeframes.
5. Validate the signal: Once you have identified a potential divergence signal, it’s crucial to validate it before taking action. Look for supporting evidence such as volume patterns, trendline analysis, or candlestick patterns that align with the divergence signal.
6. Use multiple indicators: To increase the reliability of divergence signals, consider using multiple indicators simultaneously. If multiple indicators show divergence in the same direction, it strengthens the signal and provides more confidence in the potential trend reversal or continuation.
Remember that divergence analysis is not foolproof, and false or weak divergences can occur. It’s essential to combine divergence analysis with other technical analysis tools, such as support and resistance levels, trendlines, and chart patterns, to get a comprehensive view of market conditions before making trading decisions.
In the next section, we will explore how to incorporate divergence analysis into trading strategies to improve your trading outcomes.
Using Divergence in Trading Strategies
Divergence analysis can be a valuable tool for traders looking to improve their trading outcomes. By incorporating divergence signals into trading strategies, traders can identify potential entry and exit points with a higher probability of success. Here are some ways to use divergence in your trading strategies:
1. Trend Reversal Trading: Divergence signals can indicate potential trend reversals. For example, identifying bullish divergence in a downtrend can signal a potential reversal to an uptrend, while bearish divergence in an uptrend can signal a potential reversal to a downtrend. Traders can enter trades in the direction of the anticipated reversal and ride the trend for profit.
2. Trend Continuation Trading: Divergence can also indicate potential trend continuations. Hidden divergences, such as hidden bullish divergence in an uptrend or hidden bearish divergence in a downtrend, suggest that the trend is likely to persist. Traders can use these signals to stay in trades and maximize profits by extending their positions.
3. Confluence with Other Indicators: Divergence signals are most powerful when they align with other technical analysis indicators. Look for confluence between divergence signals and support/resistance levels, trendlines, Fibonacci retracements, or candlestick patterns. This confirmation from multiple indicators increases the probability of a successful trade.
4. Building Entry and Exit Strategies: Divergence signals can be used to fine-tune entry and exit strategies. Traders can wait for confirmation of divergence before entering a trade, thereby reducing the risk of false signals. Likewise, divergence can act as a warning sign to exit a trade when the trend may be weakening or reversing.
5. Timeframe Selection: Divergence signals can vary based on the timeframe analyzed. Shorter timeframes may provide more frequent but less reliable signals, while longer timeframes may provide stronger and more enduring signals. Consider the timeframe relevant to your trading strategy and adjust your trading plan accordingly.
It’s important to remember that divergence signals are not infallible and should be used in conjunction with other technical analysis tools, risk management techniques, and a solid understanding of market conditions. Timing your trades properly and managing your risk are key factors in achieving consistent profitability.
In the next section, we will examine the benefits and drawbacks of trading divergence to provide a balanced perspective on its usage.
Benefits and Drawbacks of Trading Divergence
Trading divergence offers several benefits that can enhance trading outcomes, but it also comes with certain drawbacks. Understanding both sides of the equation is crucial for traders to make informed decisions. Let’s explore the benefits and drawbacks of trading divergence:
1. Benefits:
- Early detection of potential reversals: Divergence signals can provide early indications of potential trend reversals, allowing traders to capitalize on new market directions and potentially enter trades at the beginning of a new trend.
- Increased probability of successful trades: Combining divergence analysis with other technical indicators and chart patterns can increase the probability of successful trades. When multiple indicators confirm a divergence signal, it strengthens the validity of the trade setup.
- Versatility across markets and timeframes: Divergence analysis can be applied to various financial markets and timeframes. It offers flexibility and adaptability, making it suitable for traders with different trading preferences and strategies.
- Diverse range of trading strategies: Divergence signals can be integrated into various trading strategies, such as trend following, mean reversion, or momentum trading. Traders can tailor their approach based on their preferred trading style.
2. Drawbacks:
- False or weak signals: Divergence signals are not infallible and can sometimes be false or weak. Relying solely on divergence analysis without considering other factors may lead to poor trading decisions.
- Challenging to time entries and exits accurately: Identifying divergence is one thing, but timing entries and exits accurately is another challenge. Traders need to have a solid understanding of market dynamics and use additional technical analysis tools to increase the effectiveness of their trading decisions.
- Subject to market conditions: Divergence analysis may be less reliable in certain market conditions, such as during periods of low volatility or in trending markets. Adapting to evolving market conditions and employing proper risk management is crucial for successful divergence trading.
- Complexity for novice traders: Divergence analysis can be complex for novice traders, requiring a good grasp of technical analysis concepts and indicators. It may take time and practice to become proficient in identifying and interpreting divergence signals.
By considering the benefits and drawbacks, traders can make more informed decisions when incorporating divergence analysis into their trading strategies. It’s essential to strike a balance and supplement divergence analysis with other technical analysis tools, risk management techniques, and a solid understanding of market conditions.
Now that we have explored the benefits and drawbacks of trading divergence, let’s move on to examine examples of divergence in the market.
Examples of Divergence in the Market
Divergence can be observed in various financial markets and provides valuable insights into potential trend reversals or continuations. Let’s explore a few examples of divergence in the market:
1. Bullish Divergence Example:
During a prolonged downtrend in a stock’s price, the Relative Strength Index (RSI) forms a higher low, while the price forms a lower low. This bullish divergence suggests that selling pressure is weakening, implying a potential trend reversal. Traders may interpret this signal as an opportunity to enter long positions or close out existing short positions, anticipating an upward price movement.
2. Bearish Divergence Example:
In an uptrending market, the Moving Average Convergence Divergence (MACD) forms a lower high, but the price of a currency pair forms a higher high. This bearish divergence indicates that buying momentum is weakening, suggesting a potential trend reversal to the downside. Traders may consider this as a signal to enter short positions or exit existing long positions, expecting a downward price movement.
3. Hidden Bullish Divergence Example:
During a consolidation phase within an uptrend, the price of a commodity forms a higher low, while the Stochastic Oscillator forms a lower low. This hidden bullish divergence suggests that the selling pressure within the consolidation is weaker than it appears and indicates a possible continuation of the uptrend. Traders may use this as a signal to stay in long positions or enter new ones, expecting the price to resume its upward movement.
4. Hidden Bearish Divergence Example:
In a sideways market, the price of a stock forms a lower high, while the RSI forms a higher high. This hidden bearish divergence suggests that buying pressure within the consolidation is weaker than it appears and indicates a potential continuation of the sideways or downward movement. Traders may interpret this signal as a warning to stay in short positions or enter new ones to align with the underlying trend.
It’s important to note that these examples are simplified for illustrative purposes. Real-life divergence signals often require careful analysis, consideration of multiple indicators, and confirmation from other technical analysis tools or chart patterns.
By recognizing and interpreting divergence patterns in the market, traders can gain a competitive edge and make informed trading decisions. However, it’s crucial to practice proper risk management techniques and validate divergence signals with other technical analysis tools to increase the probability of successful trades.
In the next section, we will wrap up our discussion and conclude our exploration of divergence in trading.
Conclusion
Divergence analysis is a powerful tool for traders, offering insights into potential trend reversals or continuations in the market. By identifying and interpreting divergence signals, traders can make informed trading decisions and enhance their trading outcomes.
In this article, we explored the definition of divergence, including its types such as bullish and bearish divergence. We discussed how to identify divergence using various indicators and confirmed the signals by considering other technical analysis tools. Additionally, we examined the benefits of trading divergence, such as early trend detection and increased probability of successful trades, while also acknowledging the drawbacks, including false signals and the need for accurate timing.
We explored how divergence can be incorporated into trading strategies, whether for trend reversals or continuations, and the importance of using multiple indicators and confirming signals with other technical analysis tools. We also discussed examples of divergence in different market situations.
It’s crucial for traders to remember that divergence analysis should be used as part of a comprehensive trading plan that includes risk management techniques, market analysis, and a solid understanding of market conditions. Divergence alone is not a guaranteed indicator, and false or weak signals can occur.
By understanding the concepts and techniques presented in this article, traders can add divergence analysis to their toolbox and improve their trading decision-making process. Continual practice, observation, and refinement of trading strategies will further enhance the effectiveness of divergence analysis in identifying potential trading opportunities with favorable risk-reward ratios.
Now, armed with this knowledge, it’s time to apply divergence analysis in your trading journey. May your trading be successful, and may divergence guide you to profitable outcomes in the ever-changing financial markets.