Introduction
When it comes to trading, having a comprehensive understanding of different technical indicators can greatly enhance your decision-making process. One such indicator is the Exponential Moving Average, commonly referred to as EMA. Whether you are an experienced trader or just starting out, understanding what EMA is and how it works can help you navigate the complex world of trading more effectively.
EMA is a widely used technical indicator that calculates the average price of a security over a specified period of time, placing more weight on recent data points. Unlike the Simple Moving Average (SMA), which assigns equal weight to all data points, EMA gives more importance to recent prices, making it more responsive to current market conditions.
By analyzing the EMA, traders can identify trends, monitor price movements, and generate buy or sell signals. It is a versatile tool that can be utilized across various financial markets, including stocks, forex, and cryptocurrencies.
Understanding how EMA works and its key differences from other moving average indicators is crucial in order to effectively incorporate it into your trading strategy. In this article, we will delve deeper into EMA, explore its calculation process, and discuss its importance as a trend indicator. We will also cover EMA crossover strategies and how to combine EMA with other indicators to maximize trading opportunities.
Whether you are a swing trader, day trader, or long-term investor, EMA can provide valuable insights into market trends, helping you make more informed trading decisions. So, let’s dive in and unlock the mysteries of EMA in trading.
What is EMA?
The Exponential Moving Average (EMA) is a technical indicator used to analyze price data and identify trends in financial markets. It is similar to the Simple Moving Average (SMA), but with a key distinction – EMA places more weight on recent data points.
EMA is calculated by applying a smoothing factor to the previous day’s EMA value and adding a fraction of the difference between the current price and the previous EMA value. This formula gives more weight to recent price data, allowing traders to react more quickly to changes in market conditions.
Unlike SMA, which considers all data points equally, EMA focuses more on the most recent prices, making it more responsive to short-term price movements. This responsiveness can be particularly useful for traders who want to capture quick trends or capitalize on short-term price fluctuations.
EMA is a versatile tool that can be customized to different trading strategies and timeframes. Traders can adjust the EMA period, which determines the number of data points used for calculation, to suit their specific trading preferences. For example, a shorter EMA period (e.g., 10 or 20) is often used for short-term trading, while a longer EMA period (e.g., 50 or 200) is commonly used for long-term analysis.
By incorporating EMA into their analysis, traders can gain insights into price trends, identify potential support and resistance levels, and generate buy or sell signals. EMA can also be used in combination with other indicators, such as moving average convergence divergence (MACD) or relative strength index (RSI), to further enhance trading decisions.
It’s important to note that, like any technical indicator, EMA is not foolproof and should not be solely relied upon for trading decisions. It is best used in conjunction with other analysis tools and market factors to increase the accuracy of predictions.
In the next section, we will explore how EMA works and its key differences from SMA, providing a deeper understanding of its calculation process and usage as a trend indicator.
How does EMA work?
The Exponential Moving Average (EMA) is a technical indicator that helps traders analyze price data and identify trends in financial markets. Unlike the Simple Moving Average (SMA), which assigns equal weight to all data points, EMA places more emphasis on recent price data, making it more responsive to short-term price movements.
EMA calculations rely on a smoothing factor, which determines the weight given to each data point. The most commonly used smoothing factor is the Exponential Moving Average multiplier (2 / (N + 1)), where N represents the number of periods specified for calculation. This multiplier gives greater weight to recent data, resulting in a faster response to price changes.
Let’s understand the calculation process with an example. Suppose we are calculating a 10-day EMA for a stock’s closing prices. The formula for calculating EMA is:
EMA = (Current Price – Previous EMA) * Multiplier + Previous EMA
To calculate the first EMA value, we start with the SMA for the specified period. Assuming the SMA for the first 10 days is 50, the initial EMA value would be:
EMA = (Day 10 Closing Price – SMA) * Multiplier + SMA
As new days pass, we continue to calculate the EMA using the previous day’s EMA value and the multiplier. This iterative process provides traders with a continuously updated EMA, reflecting the latest price data.
The main advantage of EMA over SMA lies in its responsiveness to recent price changes. Due to the increasing weighting given to recent prices, EMA reacts faster to price movements, enabling traders to capture short-term trends more effectively.
It is important to choose an appropriate EMA period based on your trading strategy and time horizon. Shorter EMA periods, such as 10 or 20 days, are commonly used for short-term trading or capturing quick trends. Conversely, longer EMA periods, like 50 or 200 days, are often utilized for long-term analysis or identifying major trends.
By utilizing EMA in their analysis, traders can identify potential buying or selling opportunities based on the crossover of different EMA periods or the relationship between price and the EMA line. Additionally, EMA can provide insights into potential support and resistance levels, helping traders make better-informed decisions.
In the next section, we will explore the key differences between EMA and SMA, shedding light on their respective strengths and weaknesses as technical indicators.
Key differences between EMA and SMA
While both the Exponential Moving Average (EMA) and Simple Moving Average (SMA) are widely used moving average indicators, they have distinct characteristics that set them apart from each other. Understanding the key differences between EMA and SMA can help traders choose the most appropriate indicator for their trading strategy and time horizon.
1. Weighting of data points:
The main difference between EMA and SMA lies in the weighting of data points. SMA assigns equal weight to all data points, providing a smoother average that reacts more slowly to price changes. On the other hand, EMA gives more weight to recent data points, making it more responsive to short-term price movements.
2. Responsiveness to price changes:
EMA is known for its responsiveness to recent price changes. Due to its weighted calculation, EMA reacts faster to price movements, allowing traders to capture short-term trends more effectively. On the other hand, SMA tends to smooth out fluctuations and may lag behind in identifying quick market reversals.
3. Calculation methodology:
The calculation methodology for EMA and SMA is different. SMA simply takes the average of a specified number of data points, while EMA applies a smoothing factor to the previous day’s EMA value and adds a fraction of the difference between the current price and the previous EMA value. This formula gives EMA its weighted calculation and responsiveness to recent prices.
4. Sensitivity to outliers:
EMA is more sensitive to outliers and extreme price movements compared to SMA. Since EMA places more weight on recent data, a substantial price swing can have a significant impact on the EMA line. This sensitivity can be both an advantage and a disadvantage, depending on the trading strategy.
5. Long-term vs. short-term analysis:
SMA is commonly used for long-term analysis, as it provides a smoother representation of price trends over a longer period. Traders use longer-term SMA values, such as 50-day or 200-day averages, to identify significant trends and potential support and resistance levels. EMA, on the other hand, is often favored for short-term analysis, as it reacts more quickly to recent price changes, allowing traders to identify short-term trends and potential trading opportunities.
Both EMA and SMA have their advantages and disadvantages, and the choice between the two depends on the individual trader’s preferences and trading strategy. Some traders may prefer the responsiveness of EMA for short-term trading, while others may opt for the smoother trend representation of SMA for long-term analysis.
Now that we understand the key differences between EMA and SMA, let’s explore the benefits of using EMA in trading in the next section.
Benefits of using EMA
The Exponential Moving Average (EMA) is a popular technical indicator in trading due to its numerous benefits. By incorporating EMA into their analysis, traders can gain valuable insights and potentially improve their trading decisions. Let’s explore some of the key benefits of using EMA:
1. Responsiveness to price changes:
One of the main advantages of EMA is its responsiveness to recent price changes. By giving more weight to recent data points, EMA reacts quickly to price movements, allowing traders to capture short-term trends and potential trading opportunities. This can be particularly useful for active traders who seek to capitalize on short-term price fluctuations.
2. Trend identification:
EMA is widely used as a trend indicator. It helps traders identify the direction of the market trend, whether it is an uptrend, a downtrend, or a sideways trend. By analyzing the slope and position of the EMA line, traders can determine the strength and stability of a trend, enabling them to make more informed trading decisions.
3. Potential support and resistance levels:
EMA can also assist traders in identifying potential support and resistance levels. When a stock or asset price approaches the EMA line, it can act as a support or resistance level, influencing price movements. Traders can utilize this information to determine entry and exit points, as well as to set stop-loss levels to manage risk.
4. Efficient risk management:
EMA can be a useful tool for risk management due to its responsive nature. Traders can set trailing stop-loss orders based on the EMA line, adjusting them as the price moves in their favor. This allows traders to lock in profits and protect their capital, reducing the potential impact of adverse price movements.
5. Versatility across timeframes and markets:
EMA is a versatile indicator that can be customized to different trading strategies and timeframes. Whether you are a short-term trader focusing on intraday price movements or a long-term investor analyzing monthly charts, EMA can be adjusted to reflect the desired timeframe. It is also applicable across various financial markets, including stocks, forex, and cryptocurrencies.
6. Combining with other indicators:
EMA can be effectively combined with other technical indicators to enhance trading strategies. By using EMA in conjunction with indicators like MACD, RSI, or Bollinger Bands, traders can create a more comprehensive analysis and improve the accuracy of their trading signals.
While EMA offers numerous benefits, it is important to remember that it should not be used as the sole basis for trading decisions. It is best used in combination with other analysis tools, market factors, and risk management strategies to increase the likelihood of successful trades.
Now that we have explored the benefits of using EMA in trading, let’s move on to the next section where we will delve into the calculation process of EMA.
How to calculate EMA
Calculating the Exponential Moving Average (EMA) requires a few simple steps. By following this process, traders can generate their own EMA values and incorporate them into their analysis. Here’s how to calculate EMA:
1. Determine the EMA period:
The first step in calculating EMA is to decide on the desired period for the moving average. The EMA period refers to the number of data points used in the calculation. For example, a 10-day EMA will consider the previous 10 days’ worth of price data.
2. Calculate the initial Simple Moving Average (SMA):
To initiate the EMA calculation, start by calculating the Simple Moving Average (SMA) for the specified period. Add up the closing prices for the selected time frame and divide the sum by the number of periods. For example, if you are calculating a 10-day EMA, add the closing prices of the last 10 days and divide the sum by 10.
3. Set the initial EMA value:
The initial EMA value is equal to the SMA value calculated in the previous step. For example, if the 10-day SMA is 50, the initial EMA value will also be 50.
4. Choose a smoothing factor (Multiplier):
The smoothing factor, often referred to as the exponential smoothing constant, determines the weight assigned to each data point. The most commonly used smoothing factor is the Exponential Moving Average multiplier, calculated as (2 / (N + 1)), where N represents the number of periods selected. For example, if the EMA period is 10, the smoothing factor would be (2 / (10 + 1)) = 0.1818.
5. Calculate subsequent EMA values:
To calculate the subsequent EMA, you will need the previous day’s EMA value. Use the following formula:
EMA = (Current Price – Previous EMA) * Multiplier + Previous EMA
For each subsequent data point, substitute the current price, the previous EMA value, and the chosen smoothing factor into the formula. This will provide the updated EMA value for that period.
Continue this process for all the data points in the selected period to generate a series of EMA values.
By calculating the EMA, traders can obtain valuable insights into price trends and market dynamics. The EMA line can be plotted on a price chart to visualize the moving average and its relationship to the current market price.
Remember to update the EMA calculation regularly as new data becomes available. This will ensure the EMA values accurately reflect the most recent price movements in the market.
In the next section, we will explore how EMA can be effectively used as a trend indicator for trading.
EMA as a trend indicator
The Exponential Moving Average (EMA) is widely used as a trend indicator in trading. By analyzing the EMA line in relation to price movements, traders can identify the direction and strength of market trends. Here’s how EMA can be leveraged as a trend indicator:
1. Determining the trend direction:
EMA helps traders identify the direction of the prevailing trend. When the EMA line is sloping upwards, it indicates an uptrend, signaling that prices are consistently rising. Conversely, when the EMA line is sloping downwards, it indicates a downtrend, suggesting that prices are consistently falling. By observing the slope of the EMA line, traders can determine the overall trend direction.
2. Identifying trend reversals:
EMA can also aid in recognizing potential trend reversals. When the EMA line changes its slope or direction, it may suggest a shift in the current trend. For example, if an uptrend suddenly changes to a downtrend, it could signal a potential reversal. By monitoring the EMA line and its changes, traders can be alerted to possible trend reversals and adjust their trading strategies accordingly.
3. Confirming trend strength:
The steepness of the EMA line can indicate the strength of a trend. A steeply sloping EMA line suggests a strong trend with significant momentum. On the other hand, a gently sloping or flat EMA line indicates a weak trend with limited price movement. By analyzing the steepness of the EMA line, traders can assess the strength of the current trend and adjust their trading strategies accordingly.
4. Support and resistance levels:
EMA can also be used to identify potential support and resistance levels. When the price approaches the EMA line, it may act as a support or resistance barrier, influencing price movements. Traders can utilize the EMA line as a reference point for setting entry and exit levels, as well as for placing stop-loss orders.
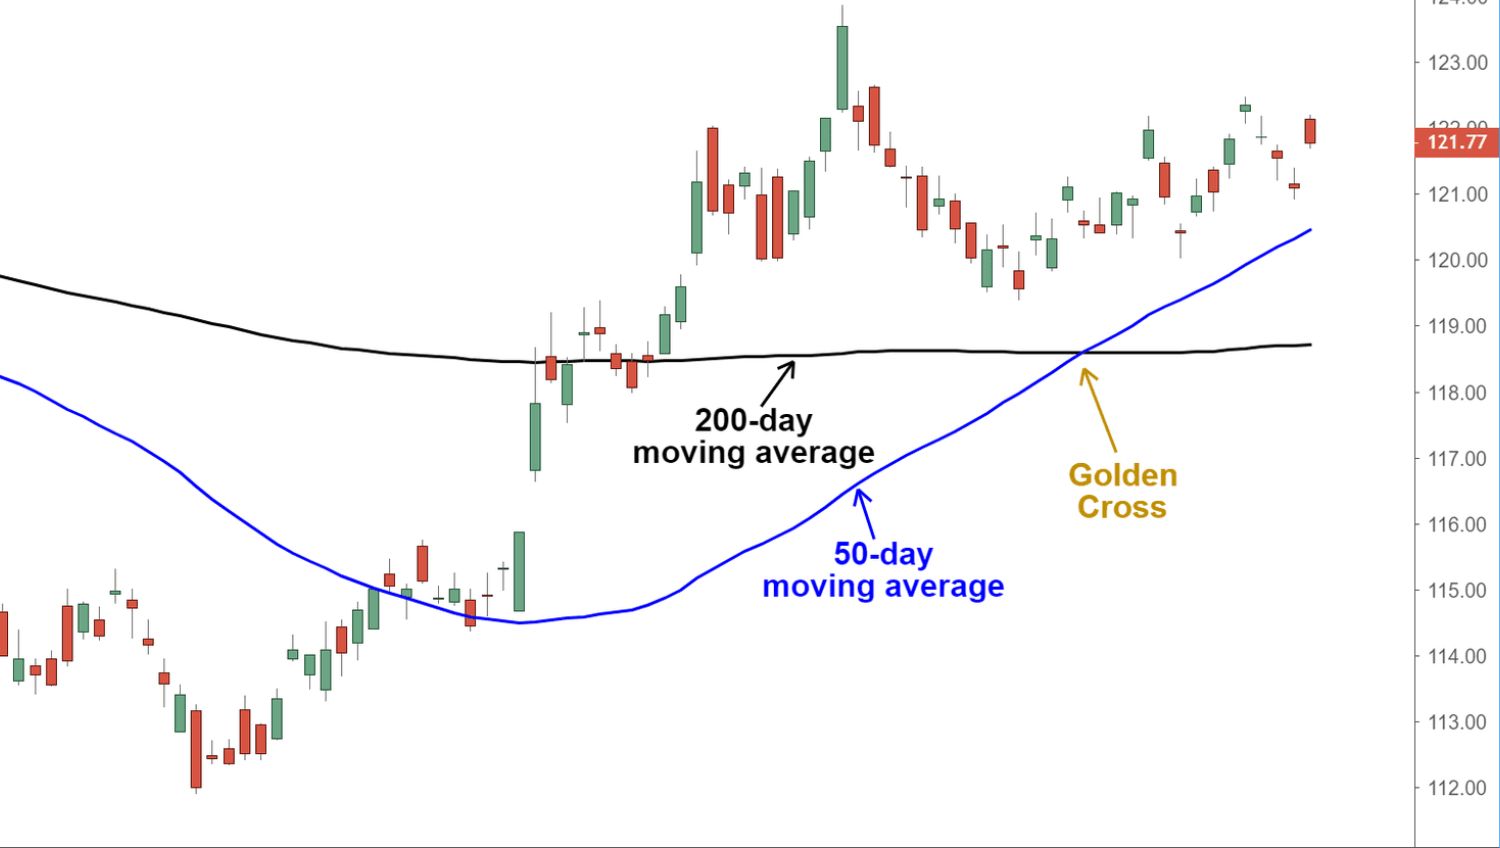
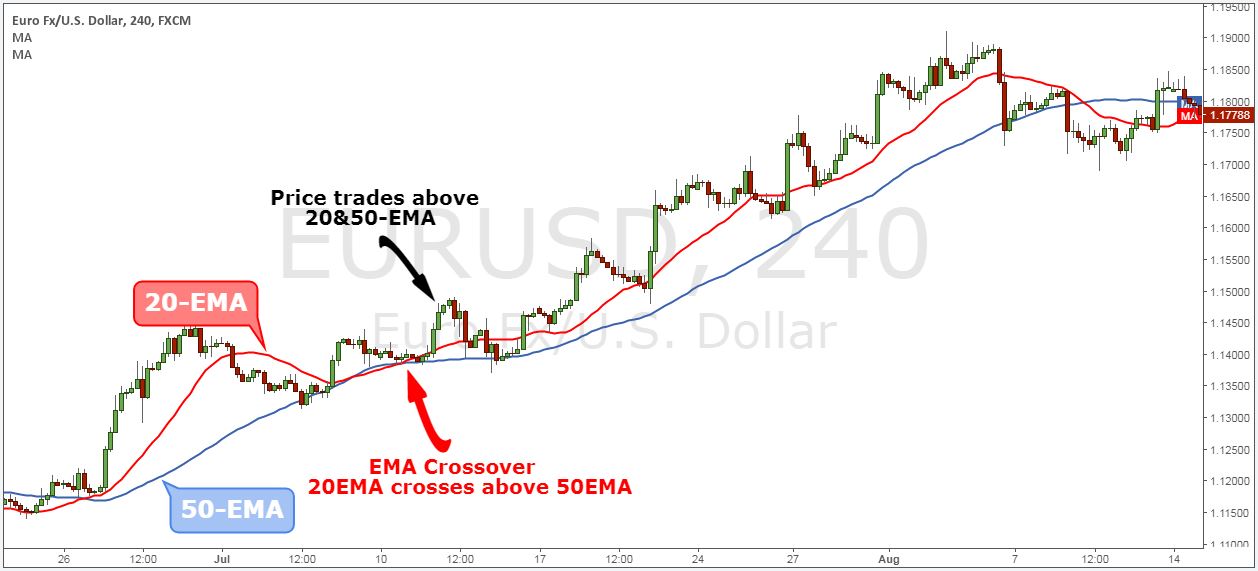
5. EMA crossovers:
EMA crossovers occur when two different EMA lines of varying periods intersect. These crossovers can provide valuable trading signals. A bullish EMA crossover occurs when a shorter EMA line crosses above a longer EMA line, indicating a potential buy signal. Conversely, a bearish EMA crossover happens when a shorter EMA line crosses below a longer EMA line, suggesting a potential sell signal. Traders often use these crossovers as entry or exit points in their trading strategies.
When using EMA as a trend indicator, it is important to consider the timeframe and market conditions. Shorter EMA periods, such as 10 or 20, are commonly used for short-term trend analysis, while longer EMA periods, like 50 or 200, are typically used for long-term trend analysis.
Overall, EMA provides traders with valuable insights into trends, trend reversals, trend strength, and potential support/resistance levels. By incorporating EMA as a trend indicator, traders can make more informed trading decisions and improve their chances of success.
In the next section, we will explore a popular trading strategy that utilizes EMA crossovers.
EMA crossover strategy
The Exponential Moving Average (EMA) crossover strategy is a popular trading technique that utilizes the crossover of two different EMA lines to generate trading signals. This strategy aims to identify potential buy or sell signals based on the interaction between two EMA lines of different periods. Here’s how the EMA crossover strategy works:
1. Choose two EMA periods:
The first step is to select two different EMA periods. Common combinations include a shorter-period EMA, such as 10 or 20, and a longer-period EMA, such as 50 or 200. The shorter-period EMA reacts more quickly to price changes, while the longer-period EMA provides a smoother representation of the overall trend.
2. Identify the crossover:
Watch for the crossover of the two EMA lines. A bullish crossover occurs when the shorter-period EMA line crosses above the longer-period EMA line, indicating a potential uptrend and a buy signal. Conversely, a bearish crossover happens when the shorter-period EMA line crosses below the longer-period EMA line, suggesting a potential downtrend and a sell signal.
3. Confirm the signal:
While the crossover itself provides a preliminary signal, it is important to confirm the signal using additional analysis tools or indicators. Traders may consider incorporating other technical indicators, such as the Relative Strength Index (RSI) or Moving Average Convergence Divergence (MACD), to provide further confirmation of the signal before entering a trade.
4. Set entry and exit points:
Once the crossover signal is confirmed, traders can establish entry and exit points for their trades. For a bullish crossover, the entry point is typically set above the crossover point, while the exit point may be determined using a trailing stop-loss or a predetermined profit target. Conversely, for a bearish crossover, the entry point is set below the crossover point, and the exit point is determined based on the trader’s risk management strategy.
5. Manage risk:
Implementing proper risk management is crucial in any trading strategy. Traders should set stop-loss orders to limit potential losses if the trade goes against their expectations. They may also consider adjusting the stop-loss level as the profit from the trade increases, allowing for a potential increase in profit potential.
The EMA crossover strategy is popular among traders due to its simplicity and the potential for capturing significant trends. However, it is important to note that no strategy is foolproof, and false signals can occur. Traders should exercise caution and combine the EMA crossover strategy with other analysis tools to increase the likelihood of successful trades.
Now that we have explored the EMA crossover strategy, let’s move on to the next section, where we will discuss how EMA can be effectively combined with other indicators to maximize trading opportunities.
EMA in combination with other indicators
The Exponential Moving Average (EMA) is a versatile indicator that can be effectively combined with other technical indicators to enhance trading strategies and maximize trading opportunities. By using EMA in conjunction with other indicators, traders can gain deeper insights and increase the accuracy of their trading signals. Here are a few examples of how EMA can be combined with other indicators:
1. Moving Average Convergence Divergence (MACD):
MACD is a popular oscillator that consists of two lines, the MACD line and the signal line. Traders often use EMA as the basis for calculating both lines in the MACD indicator. By combining EMA with MACD, traders can generate buy or sell signals based on the crossovers of the MACD and signal lines, along with the confirmation from the EMA trend.
2. Relative Strength Index (RSI):
RSI is a momentum oscillator that measures the speed and change of price movements. When combined with EMA, traders can look for divergences between the RSI indicator and the price action, along with confirmation from the EMA trend. Divergences between RSI and price can indicate potential trend reversals or the continuation of existing trends.
3. Bollinger Bands:
Bollinger Bands consist of a middle band, which is typically a simple moving average (SMA), and two outer bands that are a specified number of standard deviations away from the middle band. By replacing the SMA with EMA in the Bollinger Bands indicator, traders can observe how price interacts with the EMA band, providing valuable insights into potential breakout or reversal opportunities.
4. Fibonacci retracement:
Fibonacci retracement levels are often used to identify potential support and resistance levels in a price chart. When combined with EMA, traders can look for price retracements to the EMA line along with key Fibonacci levels. This combination can help identify optimal entry or exit points in a trend, as price often shows a reaction at these levels.
5. Volume analysis:
By incorporating volume analysis with EMA, traders can gain additional confirmation of trend strength or potential trend reversals. Higher trading volume during a bullish EMA crossover or a bearish EMA crossover can further validate the trading signal. Conversely, low trading volume during a crossover may indicate a lack of market conviction.
It is important for traders to experiment and find the combination of indicators that works best for their trading style and preferences. Each indicator provides different insights into the market, and when used in combination, they can provide a comprehensive analysis and increase the probability of successful trades.
Keep in mind that combining indicators should not result in overcrowding the chart or overcomplicating the analysis. It is crucial to strike a balance and focus on the most relevant indicators for a clear and effective trading strategy.
In the next section, we will wrap up our exploration of EMA by summarizing the key points discussed throughout this article.
Conclusion
The Exponential Moving Average (EMA) is a valuable technical indicator in trading that provides insights into price trends, potential reversal points, and market dynamics. By incorporating EMA into their analysis, traders can make more informed decisions and improve their chances of success.
We began by understanding what EMA is and how it works. EMA places more weight on recent price data, making it more responsive to short-term price movements compared to the Simple Moving Average (SMA). We learned about the EMA calculation process, which involves the use of a smoothing factor and iterative calculations to generate a series of EMA values.
EMA offers several benefits for traders. Its responsiveness to price changes allows for the identification of short-term trends and potential trading opportunities. EMA also serves as a trend indicator, helping traders determine the direction and strength of market trends. It aids in identifying potential support and resistance levels, which can be useful for setting entry and exit points.
We explored the EMA crossover strategy, where traders utilize the crossover of two different EMA lines to generate buy or sell signals. This strategy helps identify trend reversals and can be enhanced with the use of additional confirmation indicators. We also touched upon combining EMA with other technical indicators such as MACD, RSI, Bollinger Bands, Fibonacci retracement, and volume analysis to create more comprehensive trading strategies.
However, it is crucial to remember that no indicator or strategy guarantees success in trading. Traders should use EMA in combination with other analysis tools, risk management strategies, and market factors to increase the accuracy of their trading decisions.
By understanding and effectively utilizing EMA, traders can gain valuable insights into market trends, timely identify potential trading opportunities, and make informed trading decisions. The versatility and adaptability of EMA make it a valuable tool for traders in various financial markets and timeframes.
So, whether you are a seasoned trader or just starting out, incorporating EMA into your trading analysis can provide you with the edge needed to navigate the complex world of trading more effectively.