Introduction
Day trading is a popular form of speculative trading where individuals enter and exit trades within the same trading day. It requires quick decision-making, analytical skills, and the ability to interpret market data in real-time. To maximize the chances of success, day traders rely on various indicators to identify potential trading opportunities and make informed decisions.
These indicators are mathematical calculations based on historical price and volume data. They help traders analyze market trends, volatility, and potential price reversals. By understanding these indicators and incorporating them into their trading strategies, day traders can increase their chances of profitability.
In this article, we will explore some of the best indicators for day trading. These indicators are widely used by experienced traders to identify potential entry and exit points in the market. It’s important to note that no single indicator can guarantee success in day trading. Traders often use a combination of indicators to confirm signals and reduce the risk of false trading opportunities.
Let’s dive into the world of day trading indicators and discover how they can be utilized to improve your trading decisions.
Moving Average
The moving average is one of the most commonly used indicators in day trading. It smooths out price fluctuations and helps traders identify the overall trend of a security. The moving average is calculated by taking the average price of a security over a specified period of time.
There are different types of moving averages, such as the simple moving average (SMA) and the exponential moving average (EMA). The SMA gives equal weight to all price data, while the EMA assigns greater weight to recent prices. Traders choose the moving average type based on their trading strategy and preferred level of responsiveness to price changes.
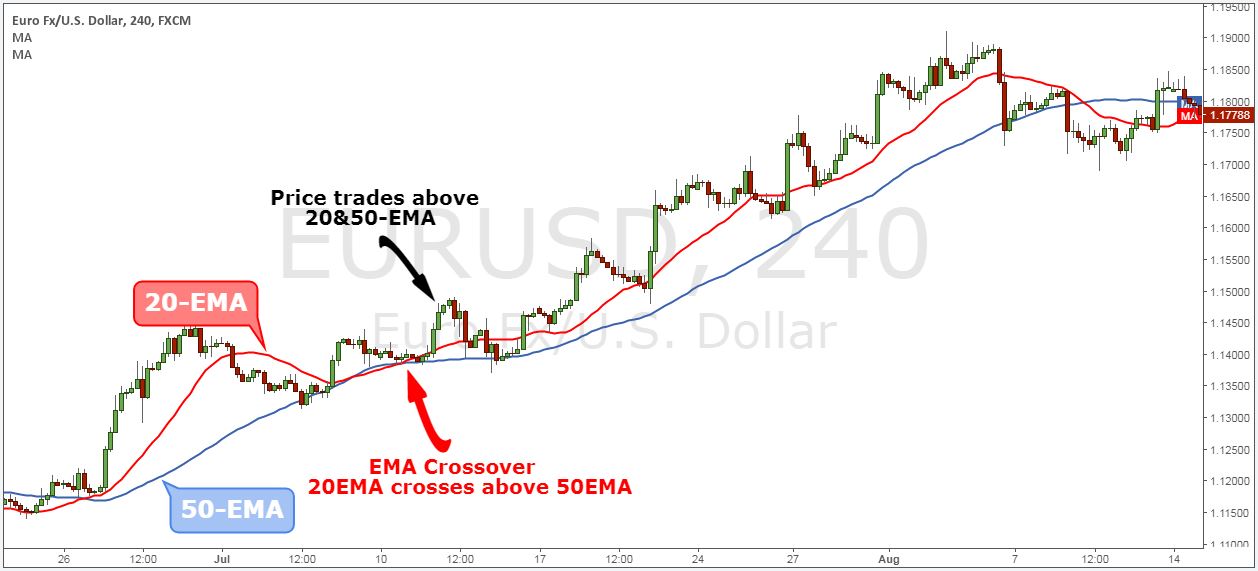
Day traders often use a combination of different moving averages to identify trends and generate trading signals. For example, they may look for the crossover of a shorter-term moving average, such as the 10-day or 20-day moving average, above or below a longer-term moving average, like the 50-day or 200-day moving average. This crossover can indicate a potential shift in the trend.
Another popular strategy is to use moving averages as support and resistance levels. When the price of a security approaches a moving average, it can act as a barrier that prevents further price movement. Traders may look for a bounce or breakout at these levels to make trading decisions.
The moving average is also used to generate buy and sell signals. For example, when the price of a security crosses above its moving average, it may suggest a bullish signal and a potential buying opportunity. Conversely, when the price crosses below its moving average, it may indicate a bearish signal and a potential selling opportunity.
It’s important to note that moving averages work best in trending markets. In choppy or sideways markets, moving averages may produce false signals. Therefore, it’s crucial for day traders to combine moving averages with other indicators and incorporate proper risk management techniques to avoid unnecessary losses.
Relative Strength Index (RSI)
The Relative Strength Index (RSI) is a momentum oscillator that measures the speed and change of price movements. It is one of the most widely used indicators in day trading to identify overbought and oversold conditions in a security.
The RSI is plotted on a scale from 0 to 100. A reading above 70 is considered overbought, indicating that the security may be due for a price correction or reversal. Conversely, a reading below 30 is considered oversold, suggesting that the security may be undervalued and due for a potential upward move.
Day traders use the RSI to generate trading signals. For example, when the RSI crosses above the 30 level from below, it may indicate a potential buying opportunity as the security is coming out of oversold territory. Conversely, when the RSI crosses below the 70 level from above, it may suggest a potential selling opportunity as the security is becoming overbought.
The RSI can also be used to confirm price trends. If the price of a security is trending higher and the RSI is also trending higher, it confirms the strength of the uptrend. Conversely, if the price is trending lower and the RSI is trending lower, it confirms the strength of the downtrend.
Traders also look for divergences between the RSI and the price of a security. A bullish divergence occurs when the price makes a lower low while the RSI makes a higher low. This may indicate a potential bullish reversal. Conversely, a bearish divergence occurs when the price makes a higher high while the RSI makes a lower high. This may indicate a potential bearish reversal.
While the RSI is a powerful indicator, it should not be used in isolation. Day traders often combine the RSI with other indicators to confirm signals and reduce the risk of false trading opportunities. It’s also important to consider other factors such as market conditions, volume, and news events when interpreting the RSI.
Bollinger Bands
Bollinger Bands are a popular technical analysis tool used by day traders to measure volatility and identify potential price reversals. They consist of three lines: the middle band, which is a simple moving average, and two outer bands that are based on the standard deviation of prices.
The middle band represents the average price over a specific period, typically 20 periods. The outer bands are placed above and below the middle band at a distance equal to a multiple of the standard deviation of prices. The most common multiple used is two standard deviations.
When the market is experiencing high volatility, the outer bands widen, whereas during periods of low volatility, the bands contract. This visual representation of volatility can be insightful for day traders, as it helps identify potential breakouts or reversals.
Traders often look for price action near the outer bands. If the price touches or penetrates the upper band, it may suggest that the security is overbought, and a price correction or reversal could occur. Conversely, if the price touches or penetrates the lower band, it may suggest that the security is oversold, and a price bounce or reversal could happen.
Another strategy with Bollinger Bands is to look for a squeeze. A squeeze occurs when the volatility is extremely low, and the bands contract tightly. This indicates that a significant price move could be imminent. Traders may wait for the breakout of the price outside the bands to take a position in the direction of the breakout.
It’s important to note that Bollinger Bands are not a standalone indicator and should be combined with other tools and analysis techniques. Traders often use them in conjunction with other indicators, such as the RSI or volume indicators, to confirm trading signals and increase the probability of successful trades.
As with any indicator, Bollinger Bands have limitations and can produce false signals. Therefore, it’s important for day traders to practice proper risk management and consider other factors, such as market conditions and news events, when making trading decisions.
MACD (Moving Average Convergence Divergence)
The MACD (Moving Average Convergence Divergence) is a popular momentum indicator used by day traders to identify potential trends and generate trading signals. It consists of two lines: the MACD line and the signal line, along with a histogram that represents the difference between the two lines.
The MACD line is calculated by subtracting the 26-day exponential moving average (EMA) from the 12-day EMA. The signal line is a 9-day EMA of the MACD line. The histogram represents the difference between the MACD line and the signal line, providing visual cues for potential trend changes.
Traders use the MACD to spot bullish and bearish divergences, as well as to identify potential entry and exit points. When the MACD line crosses above the signal line, it generates a bullish signal, indicating a potential buying opportunity. Conversely, when the MACD line crosses below the signal line, it generates a bearish signal, suggesting a potential selling opportunity.
Another trading technique with the MACD is analyzing the convergence and divergence of the MACD line and the price of a security. If the price is making higher highs, but the MACD line is making lower highs, it can indicate a bearish divergence, suggesting a potential trend reversal to the downside. Conversely, if the price is making lower lows, but the MACD line is making higher lows, it can indicate a bullish divergence, suggesting a potential trend reversal to the upside.
In addition to crossovers and divergences, day traders also pay attention to the histogram. When the histogram bars are above the zero line, it suggests bullish momentum, while bars below the zero line indicate bearish momentum. Traders may look for histogram expansions and contractions to gauge the strength or weakness of a trend.
It’s worth noting that the MACD is a lagging indicator, meaning it may not always capture rapid price movements or provide timely signals. Therefore, it’s common for day traders to combine the MACD with other indicators and analysis techniques to confirm signals and reduce the risk of false trading opportunities.
Moreover, it’s important for traders to adjust the settings of the MACD based on the specific market and timeframe they are trading. Different settings may produce different results, so it’s crucial to conduct extensive backtesting and analysis to find the most suitable parameters for the desired trading strategy.
Stochastic Oscillator
The Stochastic Oscillator is a momentum indicator used by day traders to identify potential overbought and oversold conditions in a security. It compares the most recent closing price to the range of prices over a specified period, typically 14 periods, and generates a reading between 0 and 100.
The Stochastic Oscillator consists of two lines: the %K line and the %D line. The %K line represents the current closing price relative to the high and low range over the specified period. The %D line is a moving average of the %K line and smooths out the fluctuations.
Traders use the Stochastic Oscillator to identify potential trend reversals or corrections. When the %K line crosses above the %D line and both lines are below the oversold level of 20, it may suggest a potential buying opportunity as the security is reversing from oversold conditions. Conversely, when the %K line crosses below the %D line and both lines are above the overbought level of 80, it may indicate a potential selling opportunity as the security is reversing from overbought conditions.
Another strategy with the Stochastic Oscillator is to look for divergences between the indicator and the price of a security. A bullish divergence occurs when the price makes a lower low while the Stochastic Oscillator makes a higher low. This may indicate a potential bullish reversal. On the other hand, a bearish divergence occurs when the price makes a higher high while the Stochastic Oscillator makes a lower high, indicating a potential bearish reversal.
Traders also pay attention to the speed and trajectory of the Stochastic Oscillator. If the lines are steep and moving away from each other, it suggests strong momentum. Conversely, if the lines are slowing down and converging, it may indicate a potential weakening of the trend.
It’s important to note that the Stochastic Oscillator, like any indicator, has its limitations and can produce false signals. Therefore, day traders often combine the Stochastic Oscillator with other technical analysis tools or indicators to confirm signals and increase the probability of successful trades.
In addition, traders should consider the market conditions, such as overall trend direction and volume, when interpreting the Stochastic Oscillator. It’s crucial to avoid solely relying on one indicator and to have a comprehensive trading plan that incorporates risk management strategies.
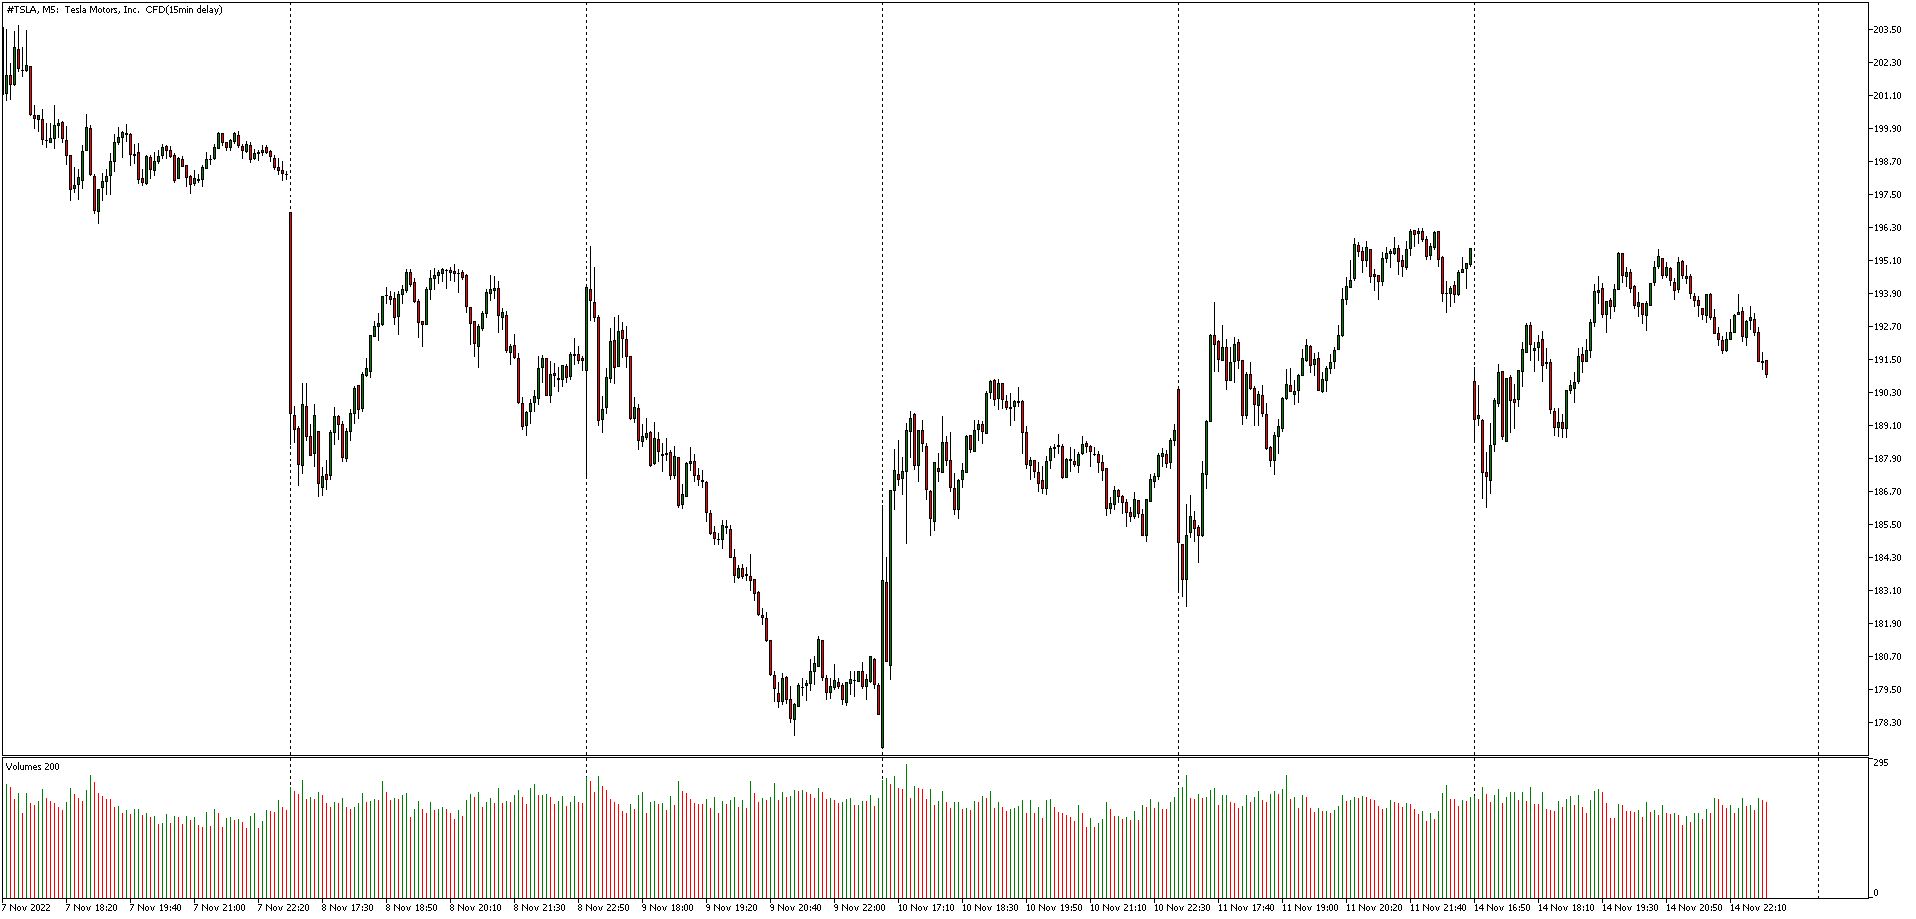
Volume
Volume is a critical indicator used by day traders to analyze the strength and validity of price movements. It measures the number of shares or contracts traded in a given period and is displayed as a histogram or a line chart below the price chart.
High volume during price movements indicates strong investor interest and participation, confirming the validity of the price trend. Conversely, low volume during price movements suggests a lack of conviction and can indicate a potential reversal or a limited sustainability of the price move.
Day traders analyze volume in conjunction with price patterns and indicators to make informed trading decisions. For example, strong price moves accompanied by high volume can validate the continuation of a trend or indicate a potential breakout. Traders may enter trades in the direction of the trend and the supporting volume to capitalize on the momentum.
On the other hand, if the price is making new highs or lows but volume is declining, it can suggest a lack of interest in the market and a potential weakening of the trend. This divergence between price and volume may signal a correction or reversal, prompting traders to adjust their trading strategy accordingly.
Volume can also help identify support and resistance levels. Significant volume levels that act as barriers to price movements are known as volume-based support and resistance. When the price approaches these levels, traders monitor the volume to assess whether the level is likely to hold or break. High volume breakouts above resistance or below support can provide valuable trading opportunities.
Another useful volume indicator is the volume moving average, which smooths out volume fluctuations. Traders may look for crossovers of the volume moving average above or below the actual volume to identify shifts in buying or selling pressure.
It’s important to note that volume analysis requires careful interpretation and comparison to historical data. Analyzing volume in isolation may not provide sufficient information for making trading decisions. Traders often use volume in combination with other indicators, such as moving averages or trend lines, to confirm signals and reduce the risk of false trading opportunities.
Lastly, day traders should be aware of the specific characteristics of the market they are trading. Different markets may have different volume patterns and behavior, requiring traders to adapt their strategies accordingly.
Fibonacci Retracement
Fibonacci Retracement is a popular technical analysis tool used by day traders to identify potential levels of support and resistance in the price of a security. It is based on the Fibonacci sequence, a mathematical pattern discovered by an Italian mathematician named Leonardo Fibonacci.
The Fibonacci sequence is a series of numbers where each number is the sum of the two preceding ones: 0, 1, 1, 2, 3, 5, 8, 13, 21, and so on. The Fibonacci ratio, expressed as a percentage, is derived from these numbers. The most commonly used ratios are 38.2%, 50%, and 61.8%.
To apply Fibonacci Retracement, traders choose two extreme points on a price chart, usually a recent swing high and a swing low. The tool then divides the vertical distance between these two points into the key Fibonacci ratios. The resulting levels act as potential areas of support or resistance where the price may reverse or consolidate.
Traders use Fibonacci Retracement in multiple ways. Firstly, they may look for price retracements during an uptrend or downtrend. If the price is in an uptrend, traders anticipate that it will retrace a portion of its upward movement and potentially find support near the Fibonacci retracement levels. Conversely, during a downtrend, traders anticipate price retracements to find resistance near these levels.
Secondly, traders use Fibonacci Retracement to identify potential entry points. Once the price has retraced to a Fibonacci level, traders look for additional technical indicators or candlestick patterns to confirm a potential reversal and initiate a trade in the direction of the original trend.
Thirdly, Fibonacci extensions can be used to project potential price targets. Traders identify a significant price move and then use Fibonacci ratios to forecast where the price may reach in the future. These extensions can serve as profit targets or levels to adjust stop-loss orders.
It’s important to note that Fibonacci Retracement levels are not foolproof and should be used in conjunction with other technical analysis tools and indicators. Traders often combine Fibonacci Retracement with other tools, such as trendlines or moving averages, to confirm potential support or resistance areas.
Fibonacci Retracement levels are considered more effective in trending markets, while they may produce less reliable results in sideways or choppy markets. Therefore, it’s crucial for day traders to assess the overall market conditions and use Fibonacci Retracement as part of a comprehensive analysis and trading strategy.
Ichimoku Cloud
The Ichimoku Cloud, also known as Ichimoku Kinko Hyo, is a powerful technical analysis tool that originated in Japan. It provides a comprehensive view of the price action and trend direction, offering traders valuable information about support and resistance levels, momentum, and potential trading opportunities.
The Ichimoku Cloud consists of five main components:
- Tenkan Sen (Conversion Line): It is a short-term moving average calculated by averaging the highest high and the lowest low over a specific period, usually 9 periods.
- Kijun Sen (Base Line): It is a medium-term moving average calculated by averaging the highest high and the lowest low over a longer period, typically 26 periods.
- Senkou Span A (Leading Span A): It represents the midpoint between the Tenkan Sen and Kijun Sen lines and is plotted 26 periods ahead.
- Senkou Span B (Leading Span B): It represents the midpoint between the highest high and the lowest low over an even longer period, typically 52 periods, and is also plotted 26 periods ahead.
- Chikou Span (Lagging Span): It represents the closing price of the current period plotted 26 periods back on the chart to show the historical price action in relation to the cloud.
The cloud itself is formed between Senkou Span A and Senkou Span B and is referred to as the “Kumo.” It provides a visual representation of support and resistance levels. When the price is above the cloud, it indicates a bullish trend, and when the price is below the cloud, it indicates a bearish trend. The thickness of the cloud also indicates the strength of the support or resistance level.
Traders look for various signals generated by the Ichimoku Cloud. For example, when the Tenkan Sen crosses above the Kijun Sen, it generates a bullish signal. On the other hand, when the Tenkan Sen crosses below the Kijun Sen, it generates a bearish signal. These crossovers can be used to enter or exit trades in the direction of the trend.
Another significant signal is the price crossing above or below the cloud. When the price breaks above the cloud, it suggests a potential bullish trend reversal, while a break below the cloud may indicate a potential bearish trend reversal. Traders may use these signals to confirm other technical analysis indicators or to identify potential entry and exit points.
The Chikou Span is also used to guide trading decisions. When the Chikou Span crosses above or below the historical price action, it can indicate potential support or resistance levels. Traders may look for these cross signals to confirm the strength of a trend or to identify potential reversals.
It’s important to note that the Ichimoku Cloud is a versatile indicator that can be applied to various timeframes and markets. However, like any indicator, it has its limitations and should be used in conjunction with other tools and techniques to confirm signals and reduce the risk of false trading opportunities.
Conclusion
In conclusion, utilizing the right indicators can greatly enhance a day trader’s ability to analyze market trends, identify potential entry and exit points, and make informed trading decisions. While no single indicator can guarantee success in day trading, combining multiple indicators and analysis techniques can significantly increase the probability of profitable trades.
We have explored some of the best indicators for day trading, including moving averages, relative strength index (RSI), Bollinger Bands, MACD (Moving Average Convergence Divergence), stochastic oscillator, volume, Fibonacci retracement, and Ichimoku Cloud. Each of these indicators provides unique insights into price movements, momentum, support and resistance levels, and trend analysis.
It’s crucial for day traders to understand the strengths and limitations of each indicator and to use them in conjunction with proper risk management techniques. Additionally, it’s important to adapt these indicators to the specific market being traded and to incorporate other analysis tools, such as trendlines, candlestick patterns, and volume analysis, to confirm signals and reduce the risk of false trading opportunities.
Furthermore, day traders should continuously test and refine their strategies, adjusting indicator parameters and analyzing historical data to optimize their trading systems. Additionally, staying up-to-date with market news, events, and broader market conditions can further enhance decision-making processes.
In summary, mastering the art of day trading requires a combination of technical analysis skills, experience, and a deep understanding of market dynamics. By harnessing the power of these indicators and incorporating them into a comprehensive trading strategy, day traders can increase their probability of success and navigate the fast-paced world of day trading with confidence.