Understanding the Basics
To effectively read crypto charts, it is essential to start with a basic understanding of how they function. Crypto charts display the historical price movements of cryptocurrencies, allowing traders and investors to analyze trends, make informed decisions, and potentially predict future price movements.
The most commonly used type of chart in crypto trading is the line chart. It displays the closing price of an asset over a specific period, typically plotted on the Y-axis against time on the X-axis. Line charts provide a simple overview of price trends, making them ideal for beginners.
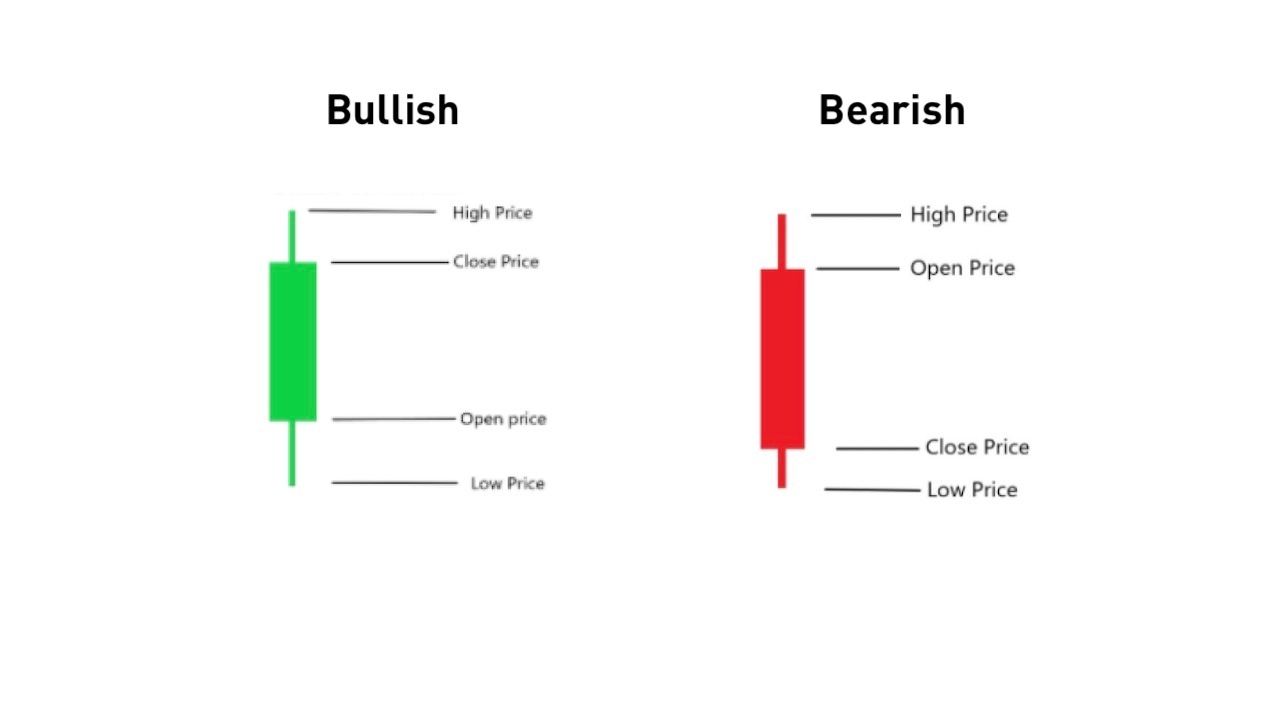
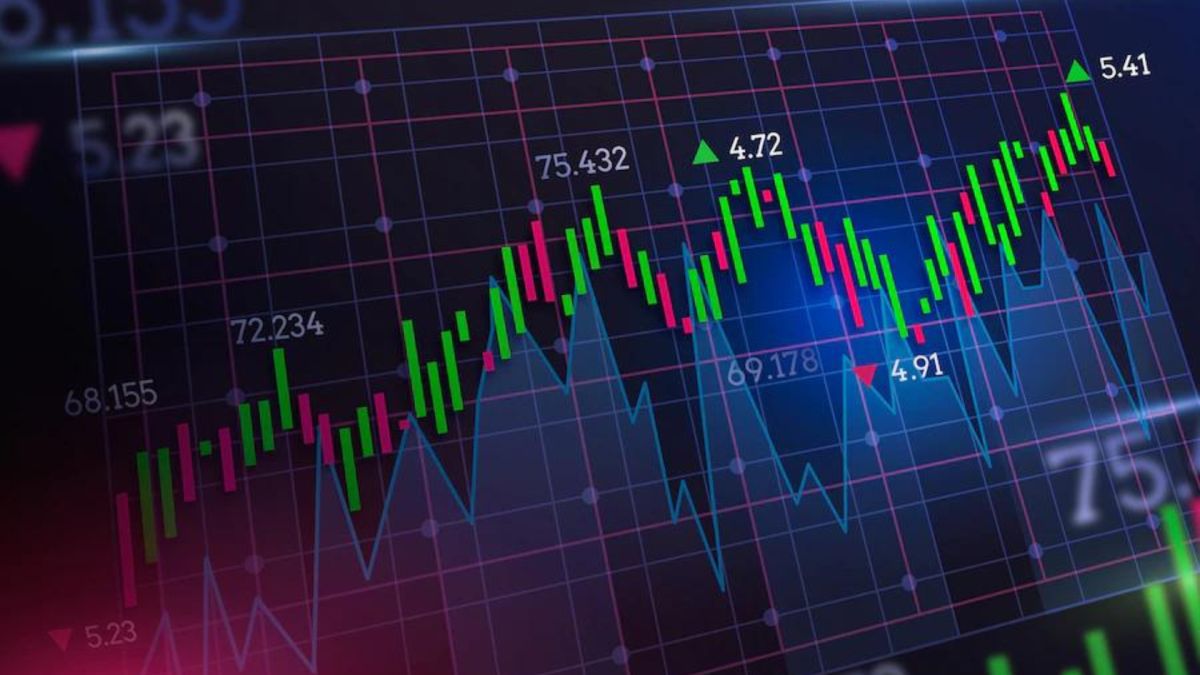
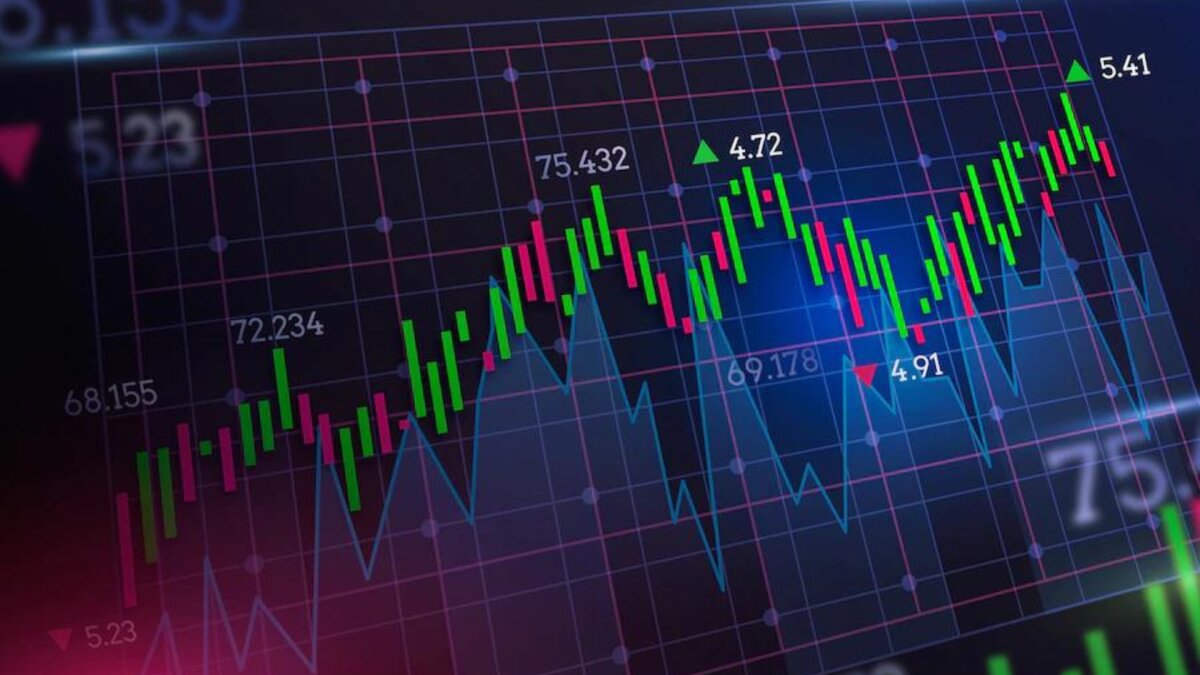
Another popular type of chart is the candlestick chart, which provides more detailed information about price movements. Candlestick charts display four key data points: the opening price, closing price, highest price, and lowest price, represented by individual “candles”. These candles can be green (or white) for bullish movements or red (or black) for bearish movements.
Understanding these basics is crucial as it forms the foundation for further analysis and interpretation of crypto charts. By familiarizing yourself with the various chart types and their components, you can begin to make sense of the data presented and make informed trading decisions.
Types of Crypto Charts
When it comes to reading crypto charts, there are several types to choose from, each offering different insights into price movements and trends. Let’s explore the most common types of charts used in cryptocurrency trading:
- Line Chart: This is the simplest and most straightforward chart type. It represents the closing prices of an asset over a specified time period using a continuous line. Line charts are useful for identifying overall trends and support and resistance levels in a cryptocurrency’s price.
- Candlestick Chart: Candlestick charts are widely used for detailed analysis in crypto trading. They provide information about the opening, closing, highest, and lowest prices within a specific time interval. The “candles” on the chart have a body and wicks, representing the price range and volatility of the asset.
- Bar Chart: Bar charts display price data using vertical bars that represent the range between the high and low prices. The opening and closing prices are indicated by horizontal lines or dashes on the bars.
- Renko Chart: Renko charts focus solely on price movements and ignore time intervals. They consist of bricks that are either filled or hollow, with each brick representing a certain price movement or “box” size.
- Point and Figure Chart: Point and Figure charts use X’s and O’s to represent price movements. They focus on significant price changes and eliminate minor fluctuations, providing a clear view of support and resistance levels.
Each type of chart has its own advantages and can be useful for different trading strategies. It’s important to familiarize yourself with these chart types and experiment with them to find the one that suits your trading style and preferences best.
Reading the Price Axis
The price axis, also known as the Y-axis, is a vital component of a crypto chart as it represents the price levels of the cryptocurrency being analyzed. By understanding how to interpret the price axis, traders can gain valuable insights into price movements and make informed trading decisions.
When reading the price axis, there are a few key elements to consider:
- Price Scale: The price scale on the Y-axis determines the range of prices displayed on the chart. It can be displayed in a linear scale, where the distance between prices remains the same, or a logarithmic scale, which emphasizes percentage movements. Traders should pay attention to the scale used, as it can significantly impact the visual representation of price movements.
- Support and Resistance Levels: Support and resistance levels are horizontal lines that represent price levels where the cryptocurrency has historically had difficulty either falling below (support) or rising above (resistance). These levels can act as significant turning points in the price, indicating potential buying or selling opportunities.
- Trendlines: Trendlines are drawn using the price axis to connect higher highs or lower lows on a chart, helping identify the direction of the trend. An upward-sloping trendline indicates an uptrend, while a downward-sloping trendline suggests a downtrend.
- Volume Profile: Volume profiles are often displayed on the price axis to illustrate the trading volume at different price levels. Traders can analyze the volume profile to identify areas of high or low trading interest, which can influence future price movements.
By carefully studying and analyzing the price axis, traders can gain a better understanding of the market dynamics, pinpoint important price levels, and identify potential entry and exit points for their trades.
Analyzing the Time Axis
The time axis, also known as the X-axis, is a crucial component of a crypto chart as it represents the time intervals over which the price data is plotted. Analyzing the time axis is essential for understanding the duration and frequency of price movements, as well as identifying patterns and trends in the market.
When analyzing the time axis, consider the following factors:
- Time Intervals: Crypto charts offer various time intervals, such as one minute, five minutes, one hour, one day, and beyond. Shorter time intervals provide more detailed views of price movements, while longer intervals offer a broader perspective. Traders should choose the time interval that aligns with their trading strategy and time horizon.
- Chart Patterns: Certain chart patterns tend to occur within specific time intervals. For example, intraday traders may focus on shorter time intervals to identify scalping opportunities, while swing traders may analyze longer intervals to spot trend reversals or continuation patterns.
- Historical Data: The time axis displays historical data, allowing traders to backtest strategies and analyze past price movements. By studying historical data, traders can identify recurring patterns or seasonal trends that may influence future price movements.
- Market Hours: The time axis also reflects the market hours during which the cryptocurrency is being traded. Understanding these hours is important for gauging liquidity and volatility levels, as well as adjusting trading strategies accordingly.
By analyzing the time axis, traders can gain insights into the timing of price movements and potential market behavior. It helps to develop a comprehensive understanding of the cryptocurrency’s price action and can guide traders in making informed decisions based on the historical and current trends.
Candlestick Charts: The Basics
Candlestick charts are a popular type of chart used in crypto trading, providing a wealth of information about price movements within a specific time period. Understanding the basics of candlestick charts is essential for effectively analyzing and interpreting price data.
Here are the key components of a candlestick:
- Body: The body of a candlestick represents the price range between the opening and closing prices of the cryptocurrency during the specified time interval. A filled (or colored) body indicates a bearish movement, where the closing price is lower than the opening price. A hollow (or uncolored) body represents a bullish movement, with the closing price higher than the opening price.
- Wicks: Also referred to as “shadows” or “tails,” wicks extend from the top and bottom of the body and represent the highest and lowest prices reached during the time interval. The upper wick indicates the highest price, while the lower wick represents the lowest price.
By observing the patterns and formations of candlesticks, traders can gain insights into market sentiment and potential price reversals. Here are some common candlestick patterns:
- Doji: A doji occurs when the opening and closing prices are very close or identical, resulting in a small or non-existent body. It suggests indecision in the market and can indicate a potential reversal.
- Engulfing: An engulfing pattern occurs when a larger candle completely engulfs the previous candle, indicating a potential trend reversal. Bullish engulfing patterns have a smaller bearish candle followed by a larger bullish candle, while bearish engulfing patterns have the opposite arrangement.
- Hammer and Hanging Man: These patterns have small bodies with long lower wicks. A hammer forms at the bottom of a downtrend and suggests a potential reversal to an uptrend. A hanging man appears at the top of an uptrend and can signal a bearish reversal.
It’s important to note that candlestick patterns should be confirmed by other technical indicators and analysis tools to increase their reliability. Traders should consider the context and overall market conditions when interpreting candlestick patterns.
By mastering the basics of candlestick charts and recognizing common patterns, traders can gain a deeper understanding of price movements and make more informed decisions in their crypto trading activities.
Interpreting Candlestick Patterns
Candlestick patterns are valuable tools for analyzing price movements in crypto trading. These patterns provide insights into market sentiment and can help traders anticipate potential trend reversals or continuation. Interpreting candlestick patterns involves understanding the formations and their significance within the broader context of the market.
Here are some commonly encountered candlestick patterns and their interpretations:
- Doji: A doji is characterized by a small or non-existent body, where the opening and closing prices are very close or identical. It suggests indecision in the market and can be a sign of potential reversal. Confirmation from other indicators and price action is crucial when trading doji patterns.
- Engulfing: Engulfing patterns occur when a larger candle engulfs the previous smaller candle, indicating a potential trend reversal. A bullish engulfing pattern forms when a smaller bearish candle is followed by a larger bullish candle, signaling a possible uptrend. Conversely, a bearish engulfing pattern, with a smaller bullish candle followed by a larger bearish candle, hints at a potential downtrend.
- Hammer and Hanging Man: The hammer and hanging man patterns have small bodies with long lower wicks. A hammer forms at the bottom of a downtrend and suggests a potential reversal to an uptrend. On the other hand, a hanging man candlestick appears at the top of an uptrend and can indicate a bearish reversal.
- Morning Star and Evening Star: These patterns consist of three candles and occur at the end of an uptrend (evening star) or a downtrend (morning star). The evening star comprises a large bullish candle, followed by a small candle that indicates indecision, and finally a large bearish candle. The morning star is the opposite, starting with a bearish candle, followed by a small indecisive candle, and concluding with a bullish candle. These patterns suggest a potential reversal in the respective trends.
While these are just a few examples, there are numerous other candlestick patterns that traders can explore and learn. It is important to remember that candlestick patterns should be used in conjunction with other technical indicators and analysis tools to increase their reliability. Confirming the patterns with trendlines, support and resistance levels, or volume analysis can provide stronger signals.
Additionally, it’s essential to consider the broader context of the market when interpreting candlestick patterns. Factors such as overall market trend, volume, news events, and market sentiment should be taken into account to make well-informed trading decisions.
By familiarizing yourself with different candlestick patterns and understanding their interpretations, you can enhance your ability to analyze price movements and identify potential trading opportunities in the crypto market.
Support and Resistance Levels
Support and resistance levels are critical concepts in technical analysis that can provide valuable insights into price movements and potential trading opportunities in the crypto market. Understanding these levels is essential for making informed trading decisions and managing risk effectively.
Support Levels: Support levels refer to price levels where the demand for a cryptocurrency is strong enough to prevent it from falling further. These levels act as a floor for the price, as buyers outnumber sellers and are willing to step in and buy the asset, creating upward pressure. Traders often identify support levels by observing areas where prices have historically bounced back or consolidated.
Resistance Levels: Resistance levels, on the other hand, represent price levels where the supply of a cryptocurrency outweighs the demand, causing the price to struggle in moving higher. These levels act as a ceiling for the price, as sellers outnumber buyers and are willing to sell the asset, creating downward pressure. Resistance levels can be identified by looking for areas where prices have previously encountered obstacles or faced selling pressure.
Traders use support and resistance levels in various ways:
- Confirmation of Breakouts: When a cryptocurrency’s price breaks above a resistance level or below a support level, it is perceived as a potential breakout. Traders watch for these breakouts to confirm a new trend and may enter long or short positions accordingly.
- Entry and Exit Points: Support and resistance levels can help traders determine optimal entry and exit points for their trades. Buying near support levels or selling near resistance levels allows traders to place stop-loss orders just below support or above resistance, respectively, to manage risk.
- Profit Targets: Traders often set profit targets near resistance levels during uptrends or near support levels during downtrends. These levels may act as price targets, where selling pressure may increase or buying pressure may emerge.
It’s important to note that support and resistance levels are not fixed or absolute. They can shift as market dynamics change, and price can break through these levels, leading to potential trend reversals. Therefore, it’s advisable to analyze other technical indicators, volume, and market sentiment alongside support and resistance levels for more accurate trading decisions.
By identifying and understanding support and resistance levels, traders can gain insights into the supply and demand dynamics of a cryptocurrency and make more informed decisions regarding entry, exit, and risk management in the crypto market.
Moving Averages: Simplifying Trends
Moving averages are widely used technical indicators that help traders identify and simplify trends in the crypto market. They provide a smoothed line that filters out short-term price fluctuations, making it easier to spot the direction and strength of a trend. Understanding moving averages can greatly enhance your ability to analyze price movements and make informed trading decisions.
Here are the key aspects of moving averages:
- Definition: A moving average is calculated by taking the average of a cryptocurrency’s price over a specific period of time. The period can vary based on the trader’s preference, such as 50-day moving average (MA) or 200-day MA.
- Simplifying Trends: Moving averages help smooth out price data, reducing noise and revealing the underlying trend. By plotting moving averages on a chart, traders can easily visualize whether the market is in an uptrend, downtrend, or range-bound.
- Types of Moving Averages: There are different types of moving averages, including simple moving averages (SMA) and exponential moving averages (EMA). SMAs provide equal weight to all data points within the chosen period, while EMAs place greater emphasis on recent data points, making them more responsive to changes in price.
- Death Cross and Golden Cross: When a shorter-term moving average, such as the 50-day MA, crosses below a longer-term moving average, such as the 200-day MA, it is known as a “death cross” and is considered a bearish signal. Conversely, when the shorter-term MA crosses above the longer-term MA, it’s called a “golden cross” and is viewed as a bullish signal.
- Support and Resistance: Moving averages can also act as support or resistance levels. During an uptrend, the price may find support near the moving average, while in a downtrend, it can face resistance near the moving average.
Traders often use moving averages in combination with other technical indicators and chart patterns. For example, they might use moving average crossovers along with support and resistance levels to confirm a potential trend reversal or breakout.
It’s important to note that moving averages are lagging indicators, as they are based on historical data. Therefore, they may not always provide timely signals, especially during volatile market conditions. It’s recommended to combine moving averages with other technical tools for more accurate analysis.
By understanding and utilizing moving averages, traders can simplify trend analysis, identify potential entry and exit points, and gain valuable insights into the overall market sentiment.
Indicators: Enhancing Analysis
Indicators play a crucial role in enhancing the analysis of price movements and identifying potential trading opportunities in the crypto market. These technical tools are designed to provide additional insights into market trends, momentum, and potential reversals. Incorporating indicators into your analysis can help you make more informed trading decisions.
Here are several types of indicators commonly used in crypto trading:
- Trend Indicators: Trend indicators help identify the direction and strength of a trend. They include moving averages, trendlines, and the Average Directional Index (ADX). These indicators help traders understand whether the market is in an uptrend, downtrend, or range-bound consolidation.
- Oscillators: Oscillators, such as the Relative Strength Index (RSI) and the Stochastic Oscillator, measure the speed and magnitude of price movements. They help identify overbought or oversold conditions, indicating potential trend reversals or continuation.
- Volume Indicators: Volume indicators, such as the On-Balance Volume (OBV) and the Volume Weighted Average Price (VWAP), provide insights into market participation and the strength of a price movement. High volume often confirms the validity of a trend or signals potential trend reversals.
- Volatility Indicators: Volatility indicators, like Bollinger Bands and Average True Range (ATR), measure the range or volatility of price movements. They assist traders in assessing the potential risk and reward of a trade and determining appropriate stop-loss and take-profit levels.
- Support and Resistance Indicators: Indicators like pivot points and Fibonacci retracement levels help identify potential support and resistance zones. These levels can act as turning points for price movements, providing valuable entry and exit points.
When using indicators, it’s important to choose those that align with your trading strategy and preferred time frame. It’s also essential to avoid overloading your charts with too many indicators, as it can lead to information overload and confusion.
Traders often combine multiple indicators to strengthen their analysis and confirm signals. For example, they might use a moving average crossover along with an oscillator to validate potential trend reversals.
It’s important to note that indicators are not foolproof and should never be used in isolation. They should be used alongside other technical analysis tools, such as chart patterns, support and resistance levels, and fundamental analysis, to make well-informed trading decisions.
By integrating indicators into your analysis, you can enhance your understanding of market dynamics, improve the timing of your trades, and potentially increase your trading success in the crypto market.
Charting Tools and Techniques
Charting tools and techniques are essential for conducting in-depth analysis and making informed trading decisions in the crypto market. These tools provide traders with a wide range of features and capabilities to effectively interpret and visualize price movements. By utilizing charting tools and techniques, traders can gain valuable insights and improve their overall trading strategies.
Here are some commonly used charting tools and techniques:
- Overlay Indicators: Overlay indicators are technical analysis tools that are superimposed on price charts to provide additional information. Examples include moving averages, Bollinger Bands, and Ichimoku Clouds. Traders can customize the settings and parameters of these indicators to suit their trading needs.
- Drawing Tools: Drawing tools allow traders to annotate and highlight important areas on a chart. These tools include trendlines, support and resistance lines, Fibonacci retracements, and channels. Traders can manually draw these lines to identify key levels and patterns.
- Time Frames: Charting platforms offer various time frames, ranging from one minute to monthly, allowing traders to analyze price movements from different perspectives. Shorter time frames provide more granular details, while longer time frames offer a broader view of trends.
- Multiple Charts: Traders can display multiple charts simultaneously on their screen, either in the same asset or different assets. Comparing multiple charts can help identify correlations, divergences, or patterns across different cryptocurrencies or trading pairs.
- Chart Patterns: Chart patterns are recurring formations that traders look for to identify potential trend reversals or continuations. Examples include head and shoulders, double tops, and symmetrical triangles. These patterns can be visually identified and used to formulate trading strategies.
- Scanners and Screeners: Charting platforms often include scanners and screeners that allow traders to filter and identify specific trading opportunities based on preset criteria. These tools can scan for technical patterns, breakout stocks, or other price conditions.
It’s important for traders to familiarize themselves with the charting tools and techniques available on their chosen platform. Learning how to effectively use these tools can significantly enhance technical analysis and assist in making more accurate trading decisions.
It’s also worth noting that charting tools and techniques should be used in conjunction with other types of analysis, including fundamental analysis and market news. Combining multiple sources of information provides a comprehensive view of the market and increases the probability of successful trades.
By utilizing charting tools and techniques, traders can spot trends, identify key levels, and uncover potential trading opportunities in the dynamic world of cryptocurrencies.
Tips and Tricks for Effective Chart Reading
Mastering the art of chart reading is crucial for successful trading in the crypto market. Here are some tips and tricks to help you effectively interpret and analyze cryptocurrency charts:
- Focus on Multiple Time Frames: Look at the price action on different time frames, from shorter to longer periods. Higher time frames provide a broader perspective, while lower time frames offer more detailed insights.
- Identify Key Support and Resistance Levels: Pay attention to areas where price frequently bounces off or faces obstacles. These levels can act as turning points and provide important entry and exit points.
- Use Multiple Indicators: Combine various technical indicators to gain a comprehensive view of price movements. Using oscillators, trend indicators, and volume indicators together can provide more robust signals.
- Consider the Overall Market Trend: Determine the prevailing trend using moving averages or trendlines. Aligning your trades with the overall market direction increases the probability of success.
- Practice Risk Management: Set proper stop-loss and take-profit levels based on support and resistance levels. Maintain a disciplined approach to risk management to protect your capital.
- Keep an Eye on Volume: Analyze the trading volume alongside price movements. Higher volume during price rallies or breakouts confirms the strength of the move.
- Stay Updated with News and Events: Monitor market news, announcements, and economic events that can impact the cryptocurrency market. Fundamental factors can influence the validity of technical patterns.
- Be Aware of Market Psychology: Consider the emotions and behavior of market participants. Price patterns often reflect psychological patterns, such as fear, greed, or indecision.
- Practice Patience and Discipline: Avoid impulsive trading decisions and stick to a well-defined trading plan. Patience and discipline are key to successful chart reading and trading in the crypto market.
Remember, chart reading requires practice and experience. Continuously refine your skills and adapt your strategies based on market conditions. By applying these tips and tricks, you can enhance your ability to read charts effectively and make better-informed trading decisions.
Putting It All Together: Case Studies
To illustrate the practical application of chart reading techniques and indicators, let’s explore a few case studies involving real-world crypto charts:
- Case Study 1: Breakout Confirmation
After identifying a prolonged period of consolidation on the daily chart, a trader notices a bullish breakout above a strong resistance level. The trader confirms the breakout by observing increasing volume and the Relative Strength Index (RSI) crossing above the overbought threshold. This combination of price action, volume, and indicator signals confirms a potential trend reversal, prompting the trader to enter a long position. - Case Study 2: Double Top Pattern
A trader identifies a double top pattern on the 4-hour chart of a cryptocurrency. The price creates two peaks at a similar level, followed by a downward move below the neckline. The trader employs a bearish oscillator, such as the Stochastic Oscillator, to confirm overbought conditions. Taking into account the bearish chart pattern, the trendline break, and the oscillator signal, the trader decides to initiate a short position with a predetermined stop-loss above the recent high. - Case Study 3: Moving Average Crossover
The 50-day and 200-day moving averages are widely watched indicators in the crypto market. A trader monitors the daily chart of a cryptocurrency and notices a bullish crossover, with the 50-day moving average crossing above the 200-day moving average. This bullish signal confirms a potential upward trend. The trader validates this signal with other supporting factors, such as strong buying volume and positive fundamental news, before considering a long position.
These case studies demonstrate the importance of combining various chart reading techniques and incorporating indicators to make informed trading decisions. However, it’s crucial to note that no strategy or pattern guarantees success in the market. Each case requires careful analysis and consideration of other factors, including market conditions, risk tolerance, and personal trading preferences.
As a trader, it’s important to familiarize yourself with different chart patterns, technical indicators, and tools while refining and testing your strategies. Continuously analyzing and learning from real-world case studies can provide invaluable insights and contribute to your trading success in the dynamic crypto market.
Conclusion
Mastering the art of chart reading is essential for successful trading in the cryptocurrency market. By understanding the basics, exploring different chart types, and incorporating various technical indicators and tools, traders can gain valuable insights into price movements, trends, and potential trading opportunities.
Through this guide, we have covered the fundamentals of chart reading, including understanding different chart types, analyzing the price and time axes, interpreting candlestick patterns, identifying support and resistance levels, using moving averages, incorporating indicators, utilizing charting tools and techniques, and implementing effective strategies.
It’s important to note that chart reading is both an art and a science. It requires a combination of technical analysis skills, experience, and market awareness. It’s crucial to exercise discretion and consider other factors, such as fundamental analysis, market news, and risk management, alongside chart analysis.
Continual learning, practice, and adaptability are key to improving chart reading abilities. As the cryptocurrency market evolves, new patterns and trends emerge. Therefore, staying up to date with market developments and continually refining strategies is vital for achieving consistent trading success.
Remember, while chart reading can provide valuable insights, it is not a crystal ball for predicting the future. Markets are influenced by a multitude of factors, and price movements can be influenced by unexpected events. It’s important to approach trading with a disciplined mindset and adhere to risk management principles.
By incorporating the knowledge and techniques outlined in this guide, you can elevate your chart reading skills and enhance your ability to identify trends, spot potential reversals, and make well-informed trading decisions in the dynamic and exciting world of cryptocurrency trading.