Introduction
Welcome to the world of trading, where the rapid movements of the financial markets can present both opportunities and challenges. As a trader, it is crucial to have a deep understanding of various technical indicators that can help you make informed decisions and enhance your trading strategy. One such widely-used indicator is the Relative Strength Index (RSI).
The RSI is a momentum oscillator that measures the speed and change of price movements. Developed by J. Welles Wilder Jr., it is a versatile tool that can provide valuable insights into market trends, identify potential reversals, and indicate overbought or oversold conditions.
Understanding how the RSI works and how to interpret its readings can be a valuable asset in your trading arsenal. In this article, we will delve into the definition, calculation, interpretation, and practical application of the RSI. We’ll explore how this indicator can be used to identify potential trading opportunities and discuss the limitations and cautions to keep in mind while using it.
Whether you are a beginner just starting to explore the world of trading or an experienced trader looking to refine your strategy, the RSI can be a powerful tool to add to your repertoire. So, let’s dive in and uncover the secrets of the RSI to take your trading skills to the next level.
Definition of RSI
The Relative Strength Index (RSI) is a popular technical indicator used in trading analysis to measure the strength and speed of a price’s recent price movements. It falls under the category of momentum oscillators, which means it measures the velocity and magnitude of price changes. The RSI is based on the concept that price trends tend to accelerate before reversing, and it can help traders identify overbought and oversold levels in the market.
The RSI is expressed as a single line that moves between the values of 0 and 100. A reading above 70 is generally considered overbought, indicating that the price may be due for a downward correction. On the other hand, a reading below 30 is typically considered oversold, suggesting that the price may be due for an upward bounce.
The RSI is calculated using a mathematical formula that compares the average gains and losses over a specified period. The most common period used is 14, which means the RSI is based on the previous 14 price candles or periods. However, traders can adjust the period to suit their trading style and time frame.
By analyzing the RSI readings, traders can gain insights into the potential strength of a trend, spot divergences that may signal a reversal, and identify potential entry and exit points for their trades.
It’s important to note that the RSI is just one tool in a trader’s arsenal and should be used in conjunction with other technical indicators and analysis techniques to make well-informed trading decisions. Additionally, it’s crucial to understand that the RSI is not infallible and can generate false signals. Therefore, it’s recommended to combine the RSI with other confirmation indicators and have a solid risk management strategy in place.
Calculation of RSI
The Relative Strength Index (RSI) is calculated using a simple mathematical formula that compares the magnitude of recent gains to recent losses. The formula involves several steps:
- First, you need to determine the average gain and average loss for the specified period (commonly 14 periods). The average gain is the sum of gains over the period divided by the number of periods, while the average loss is the sum of losses over the period divided by the number of periods.
- Next, you calculate the relative strength (RS), which is the ratio of the average gain to the average loss. RS = Average Gain / Average Loss.
- Once you have the RS, you can calculate the RSI using the following formula: RSI = 100 – (100 / (1 + RS)).
Here’s a step-by-step example for better understanding:
Let’s say we’re calculating the RSI for a stock over a 14-day period. We determine the average gain and the average loss by summing up the gains and losses over the 14 periods and dividing them by 14. For instance, if the average gain is 150 points and the average loss is 75 points, the RS would be 2 (150/75).
Using the RS value, we can now calculate the RSI: RSI = 100 – (100 / (1 + 2)). In this case, the RSI would be 66.67.
The RSI value ranges from 0 to 100. A reading above 70 is typically considered overbought, suggesting a potential downward reversal, while a reading below 30 is considered oversold, indicating a potential upward reversal.
It’s important to note that many trading platforms and charting software automatically calculate and display the RSI, saving you the hassle of performing the calculations manually.
Understanding the calculation of the RSI is essential for interpreting the indicator and using it effectively in your trading strategy. By observing the RSI value, you can gain insights into the strength of the trend and potential reversals, helping you make informed trading decisions.
Interpretation of RSI values
Interpreting the values of the Relative Strength Index (RSI) is crucial for using this indicator effectively in your trading analysis. The RSI provides insights into the strength and potential reversals in the market. Here’s how you can interpret the RSI values:
1. Overbought and Oversold Levels: The RSI value ranges from 0 to 100, with readings above 70 indicating overbought conditions, and readings below 30 indicating oversold conditions. An overbought condition suggests that the price may be due for a downward correction, while an oversold condition suggests that the price may be due for an upward bounce.
2. Trend Strength: The RSI can provide an indication of the strength of the current trend. A rising RSI suggests that bullish momentum is gaining strength, while a declining RSI indicates that bearish momentum is increasing. Traders often look for divergences between the RSI and price movements to identify potential trend reversals.
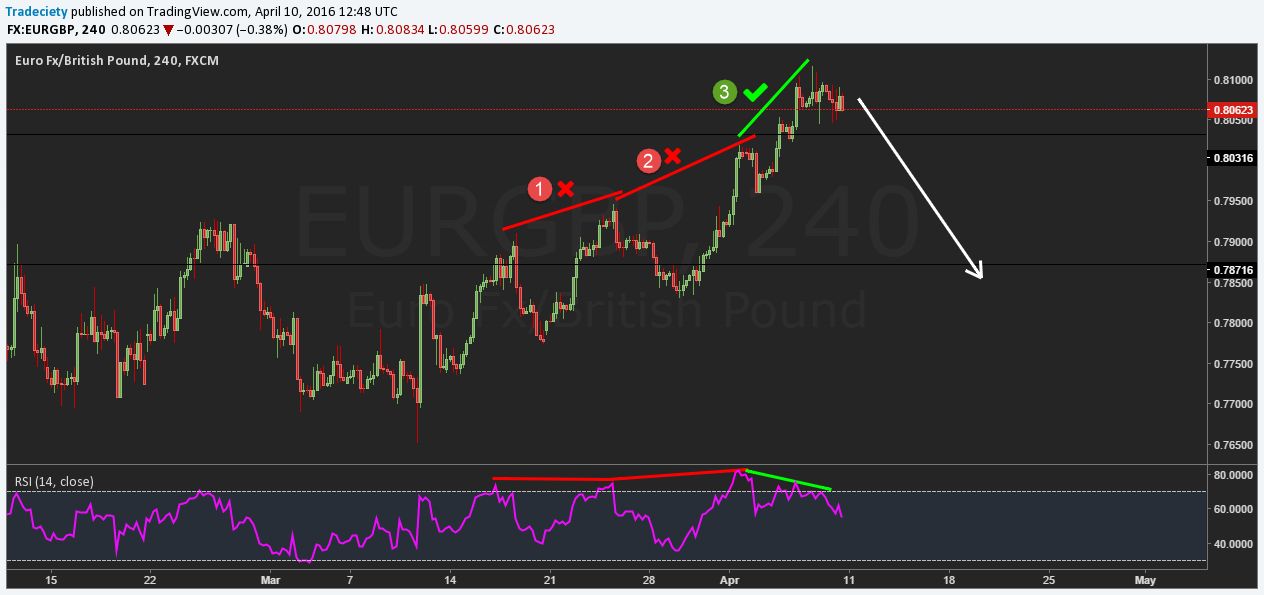
3. Bullish and Bearish Divergences: Divergences occur when the RSI and price movements move in opposite directions. Bullish divergence occurs when the price makes a lower low, but the RSI forms a higher low, indicating potential bullish momentum. Bearish divergence occurs when the price makes a higher high, but the RSI forms a lower high, indicating potential bearish momentum.
4. Continuation and Reversal Signals: RSI values above 50 generally suggest a stronger uptrend, while values below 50 indicate a stronger downtrend. Traders can use the RSI to identify potential entry points in the direction of the prevailing trend. When the RSI crosses above 50, it can signal a continuation of the uptrend, while a cross below 50 can indicate a continuation of the downtrend.
5. Multiple Time Frames: It’s essential to consider the RSI values across multiple time frames for a comprehensive analysis. RSI readings on longer time frames, such as daily or weekly, carry more weight and provide a broader perspective on market trends.
Remember that the RSI is just one tool in your trading toolkit and should be used in conjunction with other technical indicators and analysis techniques. It is crucial to validate the signals generated by the RSI with other supporting indicators or price action patterns to enhance the accuracy of your trading decisions.
By interpreting RSI values effectively, you can identify potential entry and exit points, understand trend strength, and gain insights into market reversals. It is important to practice and fine-tune your interpretation skills to maximize the benefits of employing the RSI in your trading strategy.
Identifying Overbought and Oversold Conditions with RSI
One of the primary uses of the Relative Strength Index (RSI) is to identify overbought and oversold conditions in the market. Overbought conditions occur when the RSI reading exceeds 70, indicating that the price may have risen too far, too fast and could be due for a downward correction. Oversold conditions, on the other hand, occur when the RSI reading drops below 30, suggesting that the price may have fallen too far and could be due for an upward bounce.
Identifying overbought and oversold conditions with the RSI can help traders pinpoint potential opportunities for entering or exiting trades. Here are some key points to keep in mind:
1. Overbought Conditions: When the RSI reading is above 70, it suggests that the market may be overextended on the upside. This indicates that buyers have been aggressive and pushed the price up significantly. Traders may consider this as a signal to be cautious and look for potential opportunities to sell or take profits on existing long positions. It does not necessarily mean that the price will reverse immediately, but rather that it may be due for a possible downward correction or consolidation.
2. Oversold Conditions: When the RSI reading is below 30, it suggests that the market may be oversold. This means that sellers have been dominant, pushing the price down significantly. Traders may view this as a signal to be alert and look for potential opportunities to buy or consider closing out short positions. Similar to overbought conditions, an oversold reading does not guarantee an immediate price reversal, but it indicates the possibility of an upward bounce or consolidation.
3. False Signals: It’s important to recognize that the RSI can generate false signals, especially in strong trending markets. Just because the RSI indicates overbought or oversold conditions does not mean that the price will reverse immediately. Traders should combine the RSI with other confirming indicators or patterns to increase the accuracy of their analysis.
4. Divergence: Divergences between the RSI and price movements can also provide insights into potential reversals. If the price is making higher highs while the RSI is making lower highs, it could indicate a bearish divergence and suggest that the uptrend is losing momentum. Conversely, if the price is making lower lows while the RSI is making higher lows, it could indicate a bullish divergence and suggest that the downtrend is weakening. Traders can use these divergences as additional confirmation when identifying overbought and oversold conditions with the RSI.
It’s important to note that overbought and oversold conditions are relative and should be used in conjunction with other technical analysis tools. Additionally, traders should consider the overall market context, trend direction, and support/resistance levels when interpreting RSI readings to avoid false signals.
By effectively identifying overbought and oversold conditions with the RSI, traders can enhance their decision-making process and improve the timing of their trades. However, it is essential to use the RSI in conjunction with other technical indicators and analysis techniques to increase the accuracy of trading signals.
RSI Divergence as a Signal
One of the powerful ways to utilize the Relative Strength Index (RSI) as a signal is by observing divergence between the RSI and price movements. Divergence occurs when the RSI and price move in opposite directions, signaling potential trend reversals. By understanding and effectively utilizing RSI divergence, traders can enhance their decision-making process. Here’s how RSI divergence can be used as a signal:
1. Bullish Divergence: Bullish divergence occurs when the price forms a lower low, but the RSI forms a higher low. This suggests that the momentum of the downtrend is waning, and a possible bullish reversal may be on the horizon. It indicates that even though the price is making lower lows, the RSI is showing positive momentum. Traders may interpret this as a signal to prepare for a potential trend reversal and consider entering long positions or closing out existing short positions.
2. Bearish Divergence: Bearish divergence occurs when the price forms a higher high, but the RSI forms a lower high. This suggests that the momentum of the uptrend is weakening, and a possible bearish reversal may occur. It indicates that even though the price is making higher highs, the RSI is showing negative momentum. Traders may view this as a signal to prepare for a potential trend reversal and consider entering short positions or closing out existing long positions.
3. Confirmation with Price Patterns: RSI divergence becomes more powerful when it aligns with other confirming technical analysis tools or patterns. For example, if there is a bearish divergence between the RSI and price, and at the same time, the price is also forming a bearish reversal pattern like a double top or a head and shoulders pattern, it adds more weight to the potential bearish reversal signal. Similarly, when a bullish divergence aligns with a bullish reversal pattern, it strengthens the potential bullish reversal signal.
4. Multiple Time Frames: It’s essential to observe RSI divergence across multiple time frames for a comprehensive analysis. Divergences on longer time frames, such as daily or weekly charts, carry more significance and may indicate more significant trend reversals compared to shorter time frames.
It’s important to note that RSI divergence is not foolproof and should be used in conjunction with other technical indicators and analysis techniques for confirmation. False signals can occur, so it’s crucial to consider other factors such as trend direction and support/resistance levels. Additionally, it’s advisable to practice and backtest RSI divergence signals to refine their effectiveness within your trading strategy.
By employing RSI divergence as a signal, traders can identify potential trend reversals and seize lucrative trading opportunities. However, it’s important to approach divergence with caution, validate signals with other confirming factors, and practice risk management strategies to minimize potential losses.
Using RSI in Trading Strategies
The Relative Strength Index (RSI) is a versatile technical indicator that can be incorporated into various trading strategies. Understanding how to use the RSI effectively can provide valuable insights and improve the timing of your trades. Here are a few common ways to utilize the RSI in trading strategies:
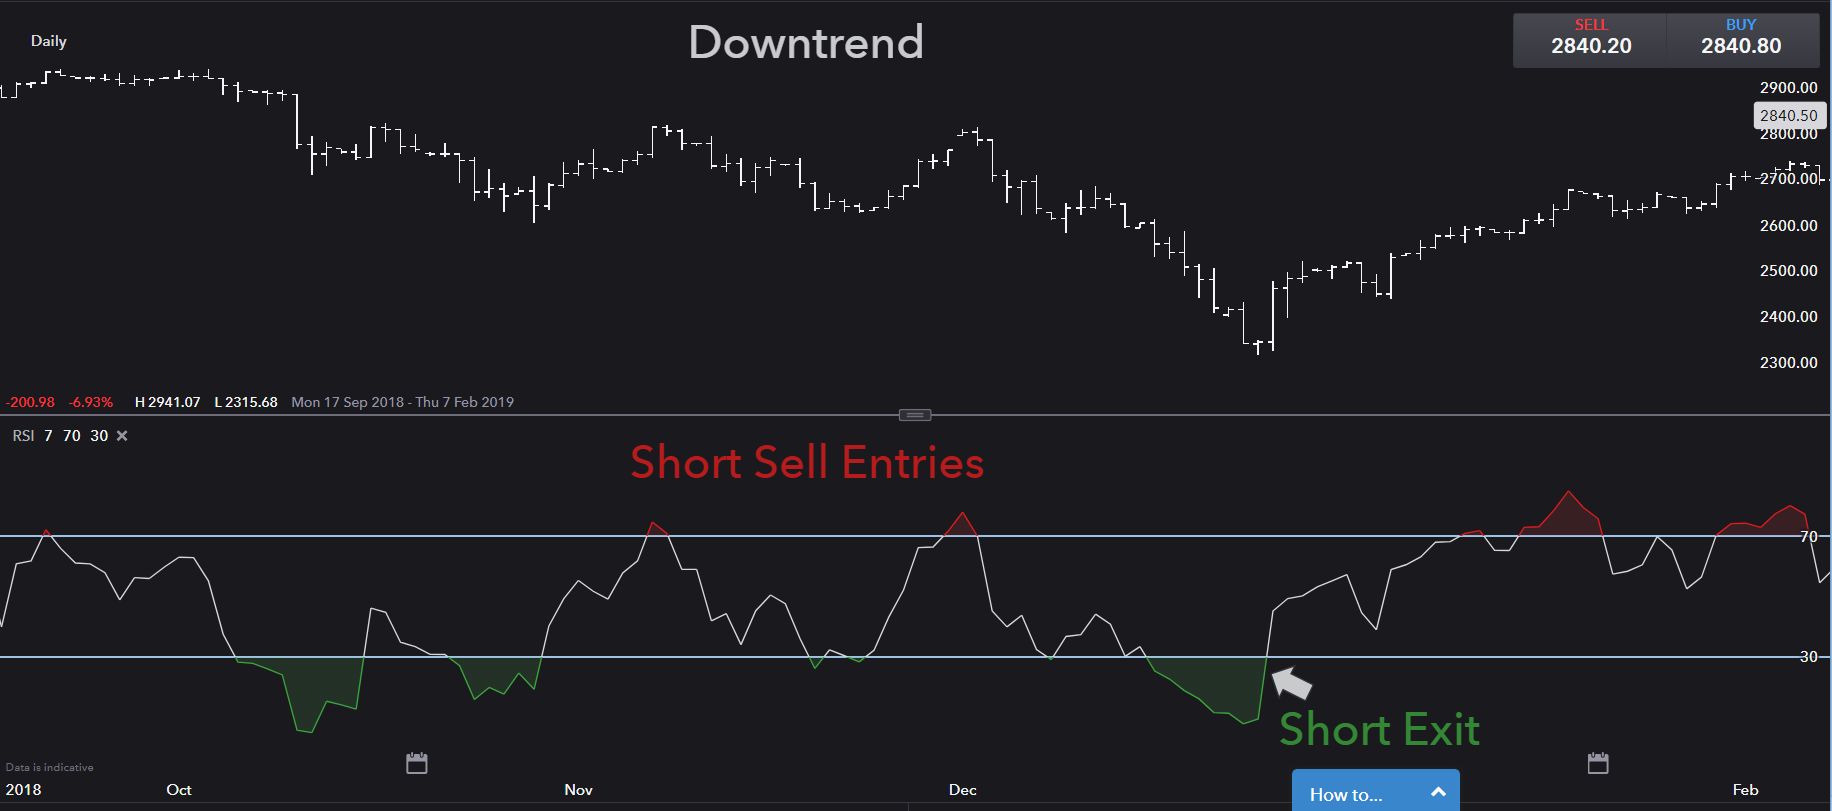
1. Overbought and Oversold Strategy: One of the most straightforward ways to use the RSI is by identifying overbought and oversold conditions. When the RSI reading exceeds 70, it suggests an overbought condition, while a reading below 30 indicates an oversold condition. Traders can use these levels as potential signals to enter trades in the opposite direction of the prevailing trend. For example, when the RSI is overbought, they may consider entering a short position, expecting a downward correction.
2. Trend Reversal Strategy: The RSI can also help identify potential trend reversals when combined with other technical analysis tools. Traders can look for bullish or bearish divergences between the RSI and price movements, as mentioned earlier. When a divergence occurs, it can serve as a signal to anticipate a trend reversal and consider entering trades in the direction of the anticipated reversal.
3. Trend Confirmation and Continuation Strategy: The RSI can be utilized to confirm a prevailing trend and identify potential entry points. When the RSI consistently remains above 50, it suggests a bullish trend, while an RSI below 50 indicates a bearish trend. Traders can wait for the RSI to cross above or below the 50 level and consider this as a confirmation to enter trades in the direction of the trend. Additionally, traders can look for pullbacks or consolidations in a trending market and wait for the RSI to re-enter the overbought or oversold zones before initiating trades in the direction of the prevailing trend.
4. Multiple Time Frame Analysis: The RSI can be applied across different time frames to gain more comprehensive insights into trends and reversals. Traders can analyze the RSI on longer-term charts, such as daily or weekly, to identify major trends, and then use shorter-term charts, such as hourly or 15-minute, to time their entries or exits based on RSI signals.
It’s important to note that while the RSI is a useful tool, it should not be relied upon as the sole trading strategy. It works best when used in combination with other technical indicators, such as moving averages, support and resistance levels, and price patterns. Traders should also take into account fundamental analysis, market news, and risk management principles.
By incorporating the RSI into your trading strategies, you can enhance your decision-making process, improve entry and exit timing, and increase the probability of successful trades. However, it’s crucial to practice, backtest, and adapt the RSI strategy based on market conditions and individual trading preferences.
Limitations and Cautions When Using RSI
The Relative Strength Index (RSI) is a valuable tool for traders, but it’s important to be aware of its limitations and exercise caution when incorporating it into your trading analysis. Here are some key limitations and cautions to keep in mind when using the RSI:
1. False Signals: Like any technical indicator, the RSI can generate false signals. It’s essential to validate RSI readings with other confirming indicators or patterns before making trading decisions. False signals can occur, especially during periods of low volatility or in strong trending markets. It’s recommended to use the RSI in conjunction with other technical analysis tools for increased accuracy.
2. Choppiness in Sideways Markets: The RSI performs best in trending markets, as it is designed to capture momentum. In sideways or ranging markets, the RSI can provide misleading signals, as it may frequently cross over the 50 level and generate whipsaw signals. It’s crucial to consider market context, as well as support and resistance levels, when analyzing the RSI in sideways market conditions.
3. Divergence Timing: While RSI divergence can be a powerful signal, it’s important to exercise caution when timing your trades based solely on divergence. Divergence indicates a potential trend reversal, but it doesn’t provide an exact timing for when the reversal will occur. It’s advisable to combine divergence signals with other technical analysis tools, such as support and resistance levels or candlestick patterns, to enhance the precision of your trade entries.
4. Different Securities, Different Optimal RSI Settings: Optimal RSI settings can vary across different securities and time frames. It’s important to test and adjust the RSI parameters to suit the specific instrument and time frame you are trading. For instance, while a period of 14 is commonly used, securities with more or less volatility may require a shorter or longer period for optimal results.
5. Market Conditions: The effectiveness of the RSI can vary depending on market conditions. During highly volatile periods or news events, the RSI may produce erratic or inconsistent signals. It’s crucial to consider market conditions and use the RSI in conjunction with fundamental analysis and market sentiment to make informed trading decisions.
6. Risk Management: As with any trading tool, it’s essential to practice proper risk management when using the RSI. Place stop-loss orders or implement trailing stops to protect against potential losses. The RSI should be used as part of a comprehensive trading plan that includes risk management strategies, position sizing, and proper trade execution.
It is crucial to always be aware of the limitations of the RSI and to adapt your trading strategy accordingly. Each trader should develop their own approach by combining the RSI with other technical indicators, price patterns, and fundamental analysis to gain a more comprehensive understanding of the market dynamics.
By understanding and applying caution when using the RSI, traders can harness its power while mitigating its potential shortcomings. It’s essential to continuously monitor and evaluate the effectiveness of the RSI within your trading strategy and make adjustments as necessary.
Conclusion
The Relative Strength Index (RSI) is a valuable tool that can provide insightful information into market trends, potential reversals, and overbought or oversold conditions. By understanding how to interpret and utilize the RSI effectively, traders can enhance their decision-making process and improve the timing of their trades.
Throughout this article, we have explored the definition of the RSI, its calculation, and its interpretation. We discussed how to identify overbought and oversold conditions using the RSI and how to leverage RSI divergence as a signal for potential trend reversals. Additionally, we learned about various trading strategies that incorporate the RSI and the limitations and cautions to keep in mind when using this indicator.
It’s important to remember that the RSI is just one tool in a trader’s arsenal and should be used in conjunction with other technical indicators, analysis techniques, and market context. Traders should continuously adapt and refine their strategies, combining the RSI with other confirming factors, such as price patterns, support and resistance levels, and fundamental analysis.
Lastly, practicing proper risk management and continuously monitoring the effectiveness of the RSI within your trading strategy is crucial. By doing so, traders can make well-informed decisions and potentially increase their trading success.
Incorporating the RSI into your trading analysis requires experience, practice, and an understanding of its limitations. By gaining a deep understanding of the RSI and utilizing it strategically, you can improve your trading skills and strive towards achieving consistent profitability in the dynamic world of financial markets.