Introduction
Welcome to the world of day trading! If you’re new to this exciting and potentially lucrative endeavor, you’re about to embark on a journey where knowledge and strategy can make all the difference. One of the fundamental tools used in day trading is the candlestick chart. Understanding how to read and interpret these charts is essential for making informed decisions and maximizing your trading success.
Candlestick charts provide a visual representation of price movements within a specified time period. They originated in Japan in the 18th century and have since become an integral part of technical analysis in financial markets worldwide. Unlike traditional bar charts, candlestick charts offer a more comprehensive and intuitive view of price action.
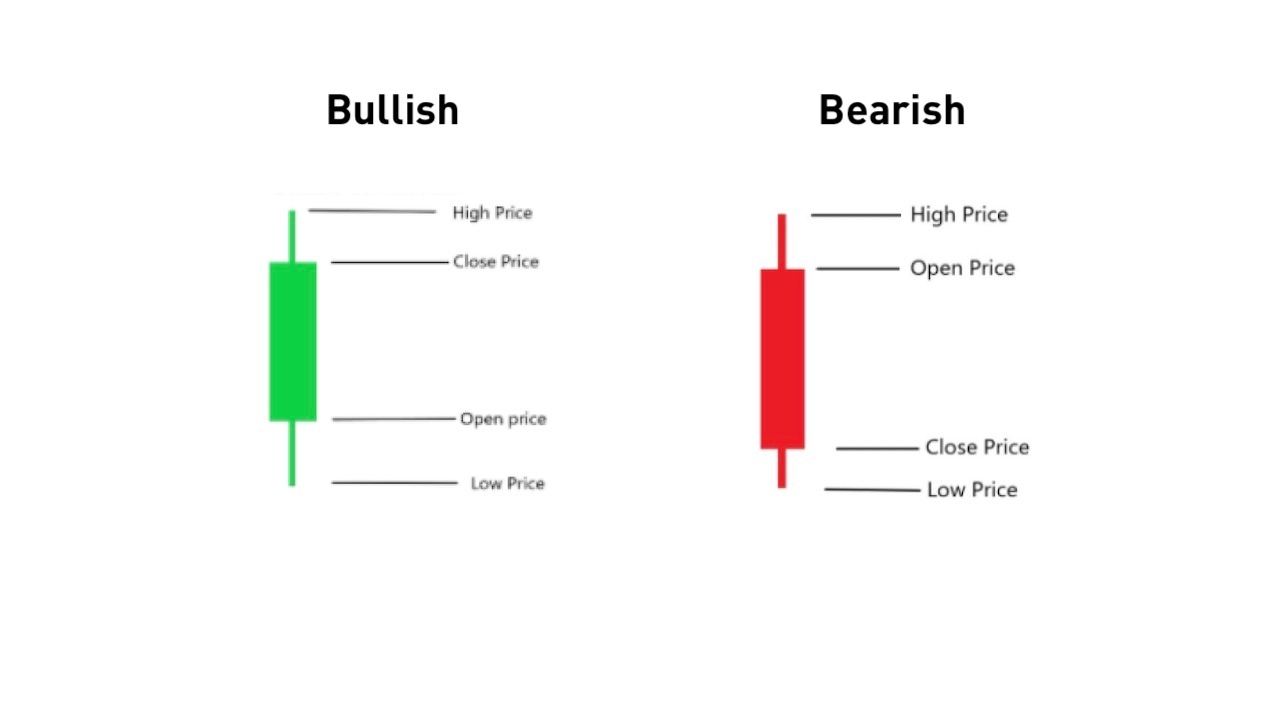
The basic structure of a candlestick consists of a rectangular “body” and two “wicks” or “shadows” extending from the top and bottom. The body represents the opening and closing prices, while the wicks show the high and low prices reached during the given time period. The color of the candlestick body can provide valuable insights into market sentiment, with green or white usually indicating bullishness and red or black indicating bearishness.
However, interpreting individual candlesticks is just the beginning. The true power of candlestick charts lies in their ability to form various patterns that can signal potential trend reversals or continuations. These patterns, known as candlestick patterns, provide valuable clues about market psychology and can help traders make more accurate predictions.
In this article, we will explore some common bullish and bearish candlestick patterns that can greatly assist you in making informed trading decisions. We’ll also discuss how to effectively incorporate these patterns into your day trading strategy. Additionally, we’ll provide some useful tips for reading candlestick charts and avoiding common pitfalls.
So, whether you’re a beginner just starting out or an experienced trader looking to refine your skills, understanding candlestick charts is crucial for success in day trading. Let’s dive in and unlock the secrets they hold!
What are Candlestick Charts
Candlestick charts are a popular tool used in technical analysis to track and analyze price movements in financial markets. They provide a visual representation of price data over a specified time period, giving traders valuable insights into market trends, sentiment, and potential trading opportunities.
Candlestick charts originated in Japan in the 18th century and were popularized by a rice trader named Homma Munehisa. They were primarily used to track the price fluctuations of rice contracts but have since been adopted by traders in various financial markets, including stocks, forex, commodities, and cryptocurrencies.
Unlike traditional bar charts that simply show the opening, closing, high, and low prices, candlestick charts offer a more comprehensive view of price action. Each individual candlestick represents a specific time period, such as one minute, five minutes, one day, or one week, depending on the trader’s preference.
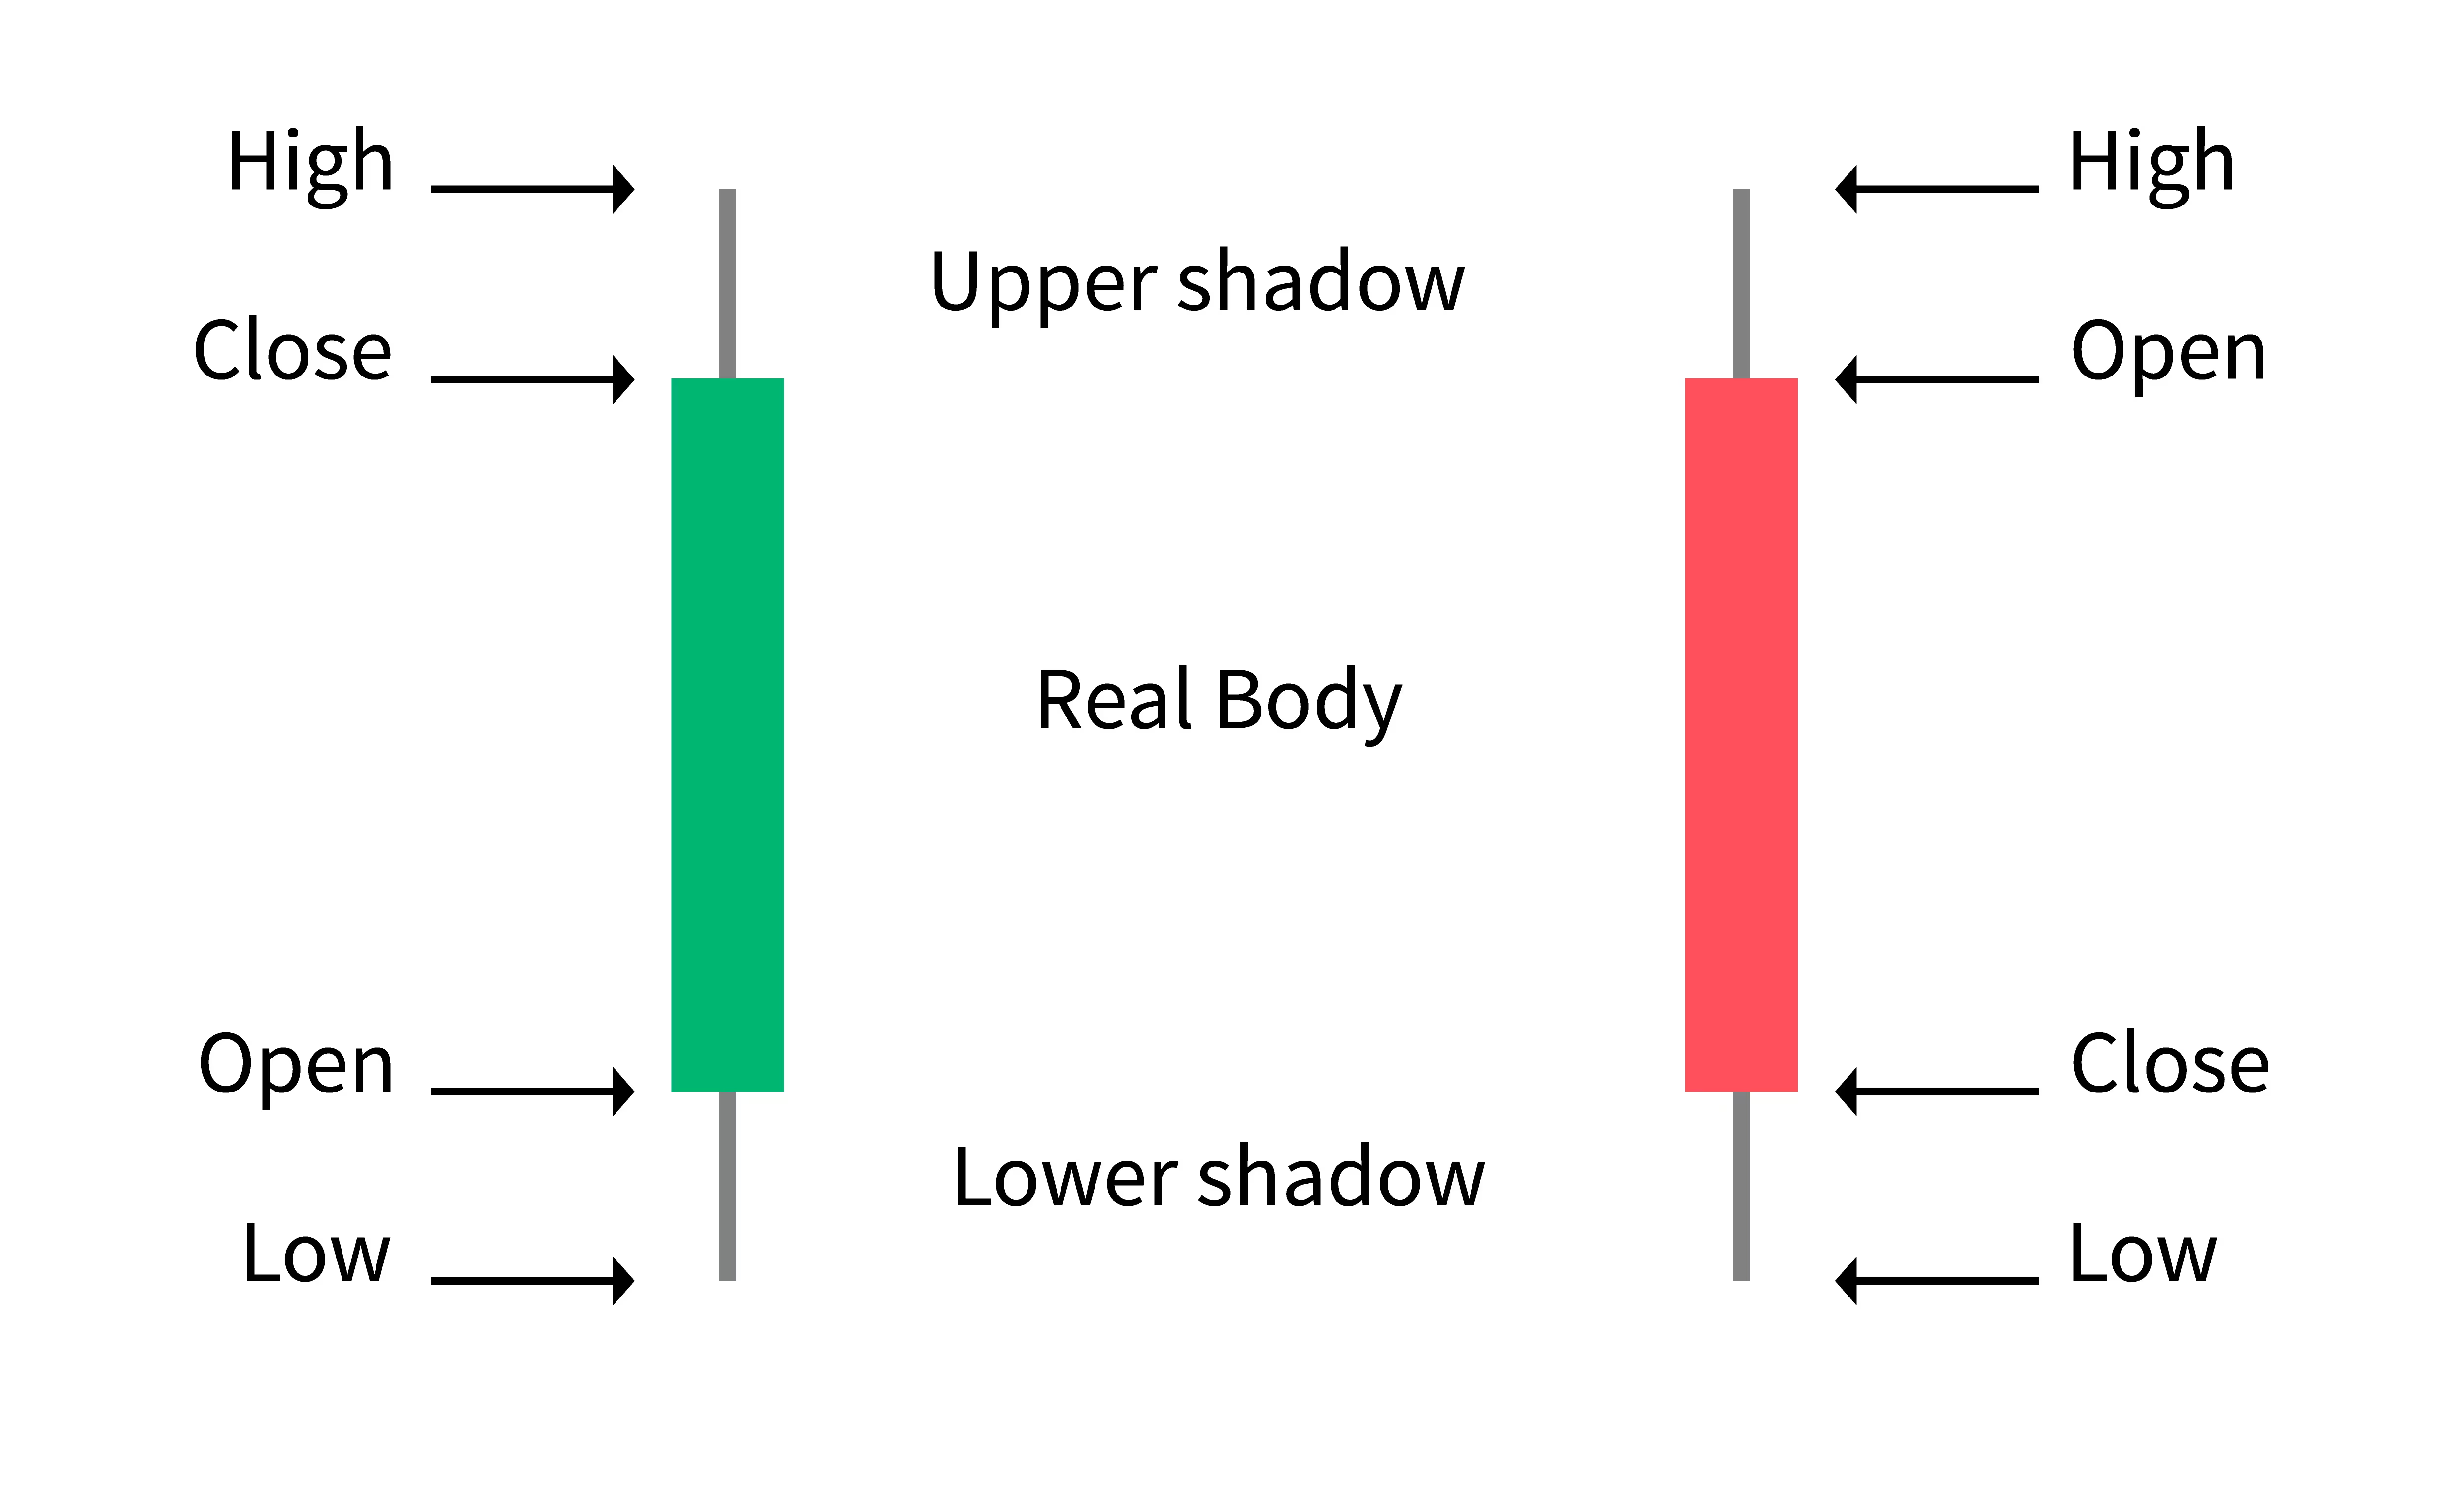
The basic structure of a candlestick consists of a rectangular “body” and two “wicks” or “shadows” extending from the top and bottom. The length of the body represents the price range between the opening and closing prices. If the closing price is higher than the opening price, the body is typically filled or colored green or white to indicate a bullish or positive sentiment. Conversely, if the closing price is lower than the opening price, the body is usually unfilled or colored red or black to signify a bearish or negative sentiment.
The wicks, or shadows, represent the price ranges beyond the opening and closing prices. The upper wick shows the highest price reached during the time period, while the lower wick indicates the lowest price. The length of the wicks can provide valuable insights into the volatility and strength of the market during that specific time period.
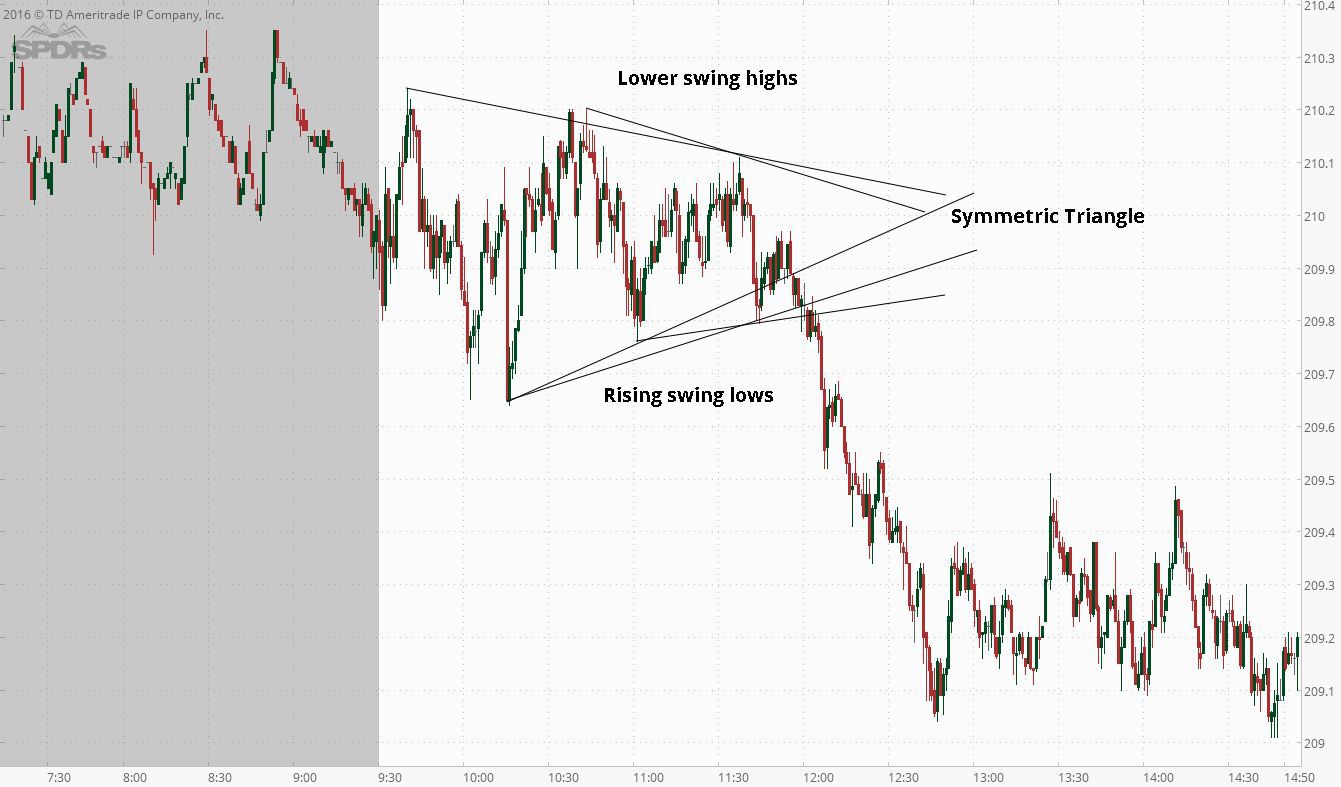
One of the key advantages of candlestick charts is their ability to display patterns and formations that can help traders identify potential trend reversals or continuations. These patterns, often referred to as candlestick patterns, are formed by a combination of multiple candlesticks and can provide valuable information about market psychology and potential future price movements.
In the next section, we will explore the basic structure of candlestick charts in more detail, helping you gain a comprehensive understanding of how they work and how to interpret them effectively.
Basic Structure of Candlestick Charts
Candlestick charts have a unique structure that provides traders with valuable information about price movements within a specific time period. Understanding the basic elements of candlestick charts is essential for interpreting them effectively and making informed trading decisions.
The main components of a candlestick are the body and the wicks. The body represents the price range between the opening and closing prices, while the wicks, also known as shadows, show the highest and lowest prices reached during the specified time period.
The length of the body is determined by the price difference between the opening and closing prices. If the closing price is higher than the opening price, the body is usually filled or colored green or white to indicate a bullish sentiment. Conversely, if the closing price is lower than the opening price, the body is typically unfilled or colored red or black to signify a bearish sentiment.
When the body is small or non-existent, it indicates that there was little or no price difference between the opening and closing prices. This can suggest indecision or lack of strong market sentiment during that time period.
The wicks, or shadows, extend from the top and bottom of the body and represent the price range outside the opening and closing prices. The upper wick shows the highest price reached during the time period, while the lower wick indicates the lowest price.
If the wicks are long, it indicates that the price moved significantly in both directions during the time period, showing high market volatility. On the other hand, short wicks suggest that the price remained relatively stagnant within a narrow range.
Candlestick charts can be displayed in various time frames, such as one minute, five minutes, one hour, or one day. The choice of time frame depends on the trader’s trading style and preferences.
By analyzing the patterns formed by multiple candlesticks over different time frames, traders can gain insights into market trends, strength, and potential future price movements. Candlestick patterns, which we will delve into in the following sections, provide valuable signals that can help identify potential buying and selling opportunities.
In the next section, we will explore different types of candlestick patterns, both bullish and bearish, that can assist traders in making more accurate trading decisions.
Understanding Candlestick Patterns
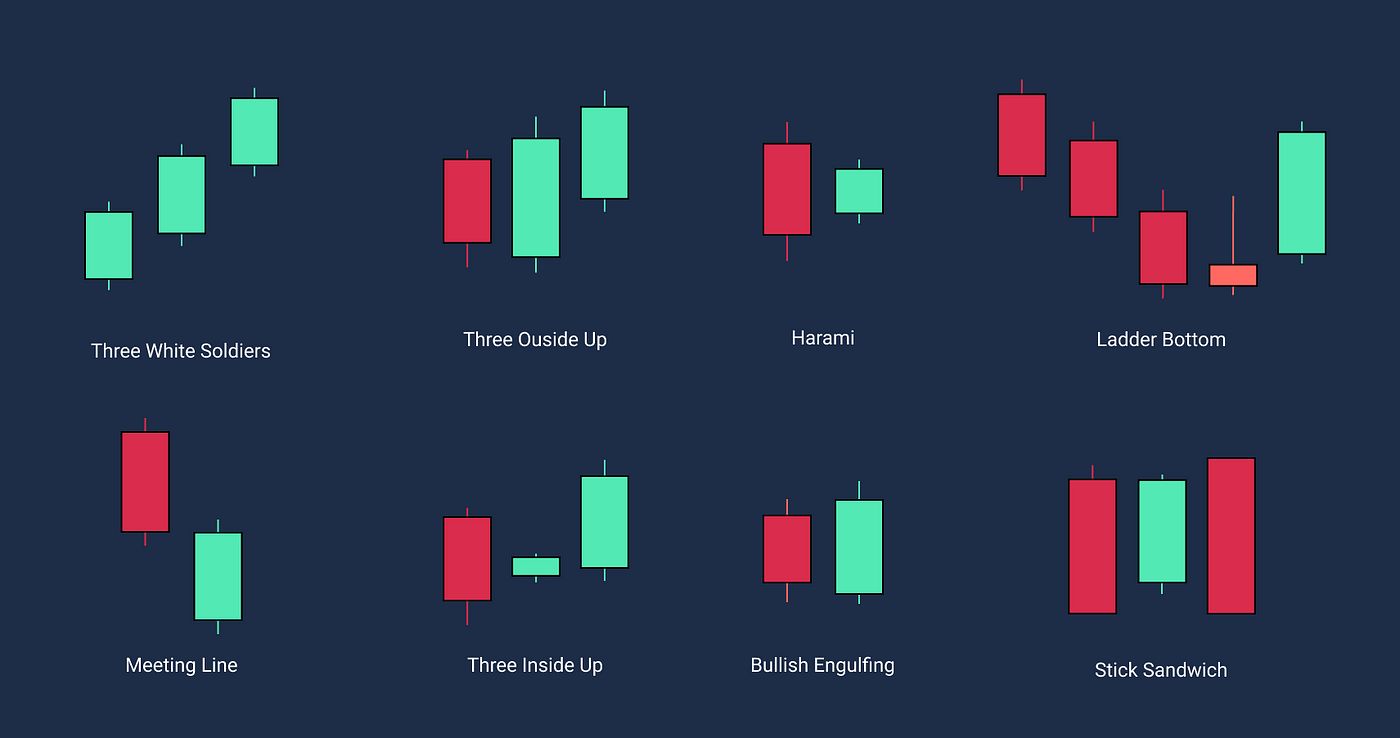
Candlestick patterns are formations that occur when multiple candlesticks appear in a specific sequence and configuration. These patterns provide valuable insights into market psychology and can help traders identify potential trend reversals or continuations. Understanding these patterns is essential for interpreting candlestick charts effectively and making informed trading decisions.
There are two main types of candlestick patterns: bullish and bearish. Bullish patterns indicate a potential upward price movement, while bearish patterns suggest a potential downward price movement.
Some common bullish candlestick patterns include:
- Hammer: A single candlestick pattern that has a small body and a long lower wick. It indicates potential bullish reversal after a downward trend.
- Bullish Engulfing: A two-candlestick pattern where the second candlestick completely engulfs the body of the previous candlestick. It suggests a potential bullish reversal.
- Piercing Line: A two-candlestick pattern where the second candlestick opens below the previous candlestick’s close and then closes above its midpoint. It indicates potential bullish reversal.
- Morning Star: A three-candlestick pattern consisting of a long bearish candlestick, a small-bodied candlestick, and a long bullish candlestick. It suggests a potential bullish reversal.
On the other hand, bearish candlestick patterns indicate a potential downward price movement. Some common bearish patterns include:
- Shooting Star: A single candlestick pattern that has a small body and a long upper wick. It indicates potential bearish reversal after an upward trend.
- Bearish Engulfing: A two-candlestick pattern where the second candlestick completely engulfs the body of the previous candlestick. It suggests a potential bearish reversal.
- Dark Cloud Cover: A two-candlestick pattern where the second candlestick opens above the previous candlestick’s close and then closes below its midpoint. It indicates a potential bearish reversal.
- Evening Star: A three-candlestick pattern consisting of a long bullish candlestick, a small-bodied candlestick, and a long bearish candlestick. It suggests a potential bearish reversal.
It’s important to note that candlestick patterns should not be considered in isolation but in conjunction with other technical indicators and analysis. Traders should also consider the overall market context and other factors that may influence price movements.
By understanding and recognizing these candlestick patterns, traders can gain an edge in their decision-making process and increase the probability of successful trades. In the next section, we will explore how to effectively use candlestick patterns in day trading strategies.
Bullish Candlestick Patterns
Bullish candlestick patterns are formations that indicate a potential upward price movement in the market. These patterns provide valuable insights into market sentiment and can help traders identify buying opportunities. Understanding these patterns and their implications is essential for successful trading strategies.
Here are some common bullish candlestick patterns:
- Hammer: The hammer pattern consists of a single candlestick with a small body and a long lower wick. It suggests a potential bullish reversal after a downtrend. The long lower wick indicates that buyers have stepped in to push the price higher, overcoming the selling pressure.
- Bullish Engulfing: This two-candlestick pattern occurs when the second candlestick completely engulfs the body of the previous candlestick. It suggests a potential bullish reversal as buyers have taken control and overwhelmed the sellers. The larger the bullish engulfing candlestick, the stronger the potential reversal signal.
- Piercing Line: The piercing line pattern consists of two candlesticks. The first candlestick is a bearish candle, followed by a bullish candle that opens below the previous candlestick’s close and closes above its midpoint. It suggests a potential bullish reversal. The second candlestick indicates that buyers have regained control and may continue to push the price higher.
- Morning Star: The morning star pattern is a three-candlestick pattern. It consists of a long bearish candlestick, followed by a small-bodied candlestick that gaps down, and finally a long bullish candlestick. It suggests a potential bullish reversal as buyers have stepped in after a period of selling pressure. The morning star pattern indicates a shift in market sentiment from bearish to bullish.
When identifying bullish candlestick patterns, it’s important to consider their reliability and context. Traders should look for confirmation signals such as high trading volume, support from other technical indicators, or a positive shift in market sentiment.
Using bullish candlestick patterns as part of your trading strategy can provide valuable entry and exit signals. They can help you identify potential buying opportunities and establish favorable risk-to-reward ratios. However, it’s crucial to combine candlestick patterns with other technical analysis tools and consider the overall market conditions before making trading decisions. Risk management and proper position sizing are also important factors to consider to protect your capital.
In the next section, we will explore bearish candlestick patterns, which can help traders identify potential selling opportunities in the market.
Bearish Candlestick Patterns
Bearish candlestick patterns are formations that indicate a potential downward price movement in the market. These patterns provide valuable insights into market sentiment and can help traders identify selling opportunities. Understanding these patterns and their implications is essential for successful trading strategies.
Here are some common bearish candlestick patterns:
- Shooting Star: The shooting star pattern consists of a single candlestick with a small body and a long upper wick. It suggests a potential bearish reversal after an uptrend. The long upper wick indicates that sellers have stepped in to push the price lower, overcoming the buying pressure.
- Bearish Engulfing: This two-candlestick pattern occurs when the second candlestick completely engulfs the body of the previous candlestick. It suggests a potential bearish reversal as sellers have taken control and overwhelmed the buyers. The larger the bearish engulfing candlestick, the stronger the potential reversal signal.
- Dark Cloud Cover: The dark cloud cover pattern consists of two candlesticks. The first candlestick is a bullish candle, followed by a bearish candle that opens above the previous candlestick’s close and closes below its midpoint. It suggests a potential bearish reversal. The second candlestick indicates that sellers have regained control and may continue to push the price lower.
- Evening Star: The evening star pattern is a three-candlestick pattern. It consists of a long bullish candlestick, followed by a small-bodied candlestick that gaps up, and finally a long bearish candlestick. It suggests a potential bearish reversal as sellers have stepped in after a period of buying pressure. The evening star pattern indicates a shift in market sentiment from bullish to bearish.
When identifying bearish candlestick patterns, it’s important to consider their reliability and context. Traders should look for confirmation signals such as high trading volume, support from other technical indicators, or a negative shift in market sentiment.
Using bearish candlestick patterns as part of your trading strategy can provide valuable entry and exit signals. They can help you identify potential selling opportunities and establish favorable risk-to-reward ratios. However, it’s crucial to combine candlestick patterns with other technical analysis tools and consider the overall market conditions before making trading decisions. Risk management and proper position sizing are also important factors to consider to protect your capital.
Remember that candlestick patterns are not foolproof and should not be solely relied upon for trading decisions. It’s essential to practice sound risk management, apply proper technical analysis, and consider other market factors to increase the probability of successful trades.
In the next section, we will explore how to effectively incorporate candlestick patterns into your day trading strategy.
Using Candlestick Patterns in Day Trading
Candlestick patterns are valuable tools that day traders can use to make informed trading decisions and increase their chances of success. By understanding and incorporating candlestick patterns into your day trading strategy, you can identify potential entry and exit points, manage risk, and improve your overall trading performance.
Here are some ways to effectively use candlestick patterns in day trading:
- Confirmation with other indicators: While candlestick patterns can provide useful signals on their own, it is often beneficial to confirm them with other technical indicators. For example, you can combine candlestick patterns with trend lines, moving averages, or oscillators to increase the reliability of your trading signals.
- Timeframe selection: Consider the timeframe you are trading on. Different candlestick patterns may hold different significance depending on the timeframe. For shorter timeframes like intraday trading, focus on patterns that occur within the same trading session or shorter time periods.
- Combining multiple patterns: Look for confluence by combining multiple candlestick patterns. When different patterns appear in proximity to each other, it can strengthen the potential trading signal. For example, if a bearish engulfing pattern forms near a resistance level, it may indicate a stronger potential reversal.
- Consider market context: Analyze the overall market conditions before placing trades based solely on candlestick patterns. Take into account factors such as market trends, support and resistance levels, and news events that may influence price movements. This will help you make more informed trading decisions.
- Practice risk management: Manage your risk effectively by setting stop-loss orders and adhering to proper position sizing. Remember that not all trades based on candlestick patterns will be successful, so it’s crucial to protect your capital and limit potential losses.
It’s important to note that not all candlestick patterns will result in successful trades. There is still a level of uncertainty involved in trading, and no pattern can guarantee profitable outcomes. Therefore, it is essential to combine candlestick patterns with other technical and fundamental analysis tools and exercise sound trading discipline.
As a day trader, practicing proper trade management, maintaining a trading journal, and continually learning and adapting to market conditions will contribute to your long-term success. Regularly review and evaluate your trading strategy to refine your approach and stay ahead in the dynamic world of day trading.
In the next section, we will provide some valuable tips for effectively reading candlestick charts, further enhancing your ability to interpret and utilize this powerful technical analysis tool.
Tips for Reading Candlestick Charts
Reading candlestick charts effectively is crucial for understanding price movements and making informed trading decisions. Here are some valuable tips that can help you enhance your ability to interpret and analyze candlestick charts:
- Learn the basic candlestick patterns: Familiarize yourself with the basic bullish and bearish candlestick patterns such as hammers, engulfing patterns, and dojis. Understanding these patterns will give you a foundation for recognizing more complex formations.
- Consider the larger context: Analyze the overall market trend and the larger timeframes. Higher timeframes can provide a broader perspective and help you avoid trading against the prevailing trend.
- Combine with other technical indicators: Use candlestick patterns in conjunction with other technical indicators like moving averages, trend lines, or oscillators. This can provide further confirmation and increase the accuracy of your trading signals.
- Observe the volume: Pay attention to the trading volume accompanying specific candlestick patterns. High volume can signal strong price movements and increase the validity of the observed pattern.
- Watch for patterns at support and resistance levels: Candlestick patterns that form near significant support or resistance levels are more likely to result in meaningful price reversals or breakouts. These levels act as psychological barriers for market participants.
- Use multiple timeframes: Analyze candlestick charts across multiple timeframes to obtain a more comprehensive view of price action. Combining different timeframes can help you identify potential entry and exit points with greater precision.
- Practice pattern recognition: Regularly expose yourself to different candlestick patterns by studying historical charts and practicing pattern recognition exercises. The more familiar you become with patterns, the easier it will be to interpret them in real-time trading situations.
- Maintain a trading journal: Keep a record of your trades and the corresponding candlestick patterns. This will help you analyze your trading performance over time and identify areas for improvement.
- Stay adaptable: Market conditions can change rapidly, so be prepared to adapt your trading strategies. Recognize that not all candlestick patterns will result in successful trades, and be open to adjusting your approach based on market dynamics.
Remember, reading candlestick charts is not a foolproof method for predicting future price movements. It requires practice, experience, and a systematic approach to analyzing the charts. Continuously educating yourself and staying updated on market trends and news events will also contribute to your ability to interpret candlestick patterns accurately.
Implementing these tips in your trading routine will enhance your skills in reading candlestick charts and increase your chances of making successful trading decisions.
In the next section, we will conclude our discussion on candlestick charts and summarize the key takeaways from this article.
Conclusion
Candlestick charts are a powerful tool in the arsenal of a day trader. Understanding how to read and interpret these charts can provide valuable insights into market trends, sentiment, and potential trading opportunities. By recognizing and analyzing different candlestick patterns, traders can make informed decisions and improve their overall trading performance.
In this article, we explored the basics of candlestick charts, including their structure and the significance of the body and wicks. We delved into both bullish and bearish candlestick patterns, discussing their formations and implications. Furthermore, we provided tips on how to effectively use candlestick patterns in day trading, such as combining them with other technical indicators and considering the larger market context.
Additionally, we discussed the importance of risk management, proper trade management, and adaptability in building a successful trading strategy. Recognizing that not all candlestick patterns guarantee profitable trades, we emphasized the need for continuous learning, practice, and refinement of trading skills.
By incorporating these tips and strategies into your trading routine, you can increase your ability to accurately read and interpret candlestick charts, ultimately enhancing your trading decisions and potentially improving your overall trading results.
Remember, trading is a dynamic and ever-changing field. Markets can be influenced by various factors, and no strategy or analysis method is foolproof. It is essential to remain disciplined, adapt to changing market conditions, and practice proper risk management in your day trading journey.
Continually educate yourself, stay updated on market trends, and adapt your trading strategies as needed. By doing so, you will be better equipped to navigate the complexities of the financial markets and potentially achieve your trading goals.
Wishing you success and profitable trading endeavors!