Introduction
Welcome to the world of digital currency trading! If you’re new to the exciting and dynamic world of cryptocurrencies, understanding how to read candlestick charts is an essential skill. Candlestick charts provide valuable insights into the price movement and trends of any given cryptocurrency, allowing traders to make informed decisions.
So, what exactly are candlestick charts? And how can you interpret them to gain a deeper understanding of the market?
In this article, we will delve into the basics of candlestick representation, explore different candlestick patterns, and provide tips on how to read candlesticks effectively. By the end of this guide, you will have a solid foundation in reading digital currency candlestick charts, setting you on the path to becoming a more confident and successful trader.
Before we dive into the specifics, it’s important to note that candlestick charts are based on the concept of Japanese candlestick charting. This method was developed in the 18th century by a Japanese rice trader named Homma Munehisa. The detailed analytical techniques used in candlestick charts have since become widely popular in many financial markets, including digital currency trading.
With that in mind, let’s begin our journey into the fascinating world of interpreting candlestick patterns in digital currency trading.
What Are Candlestick Charts?
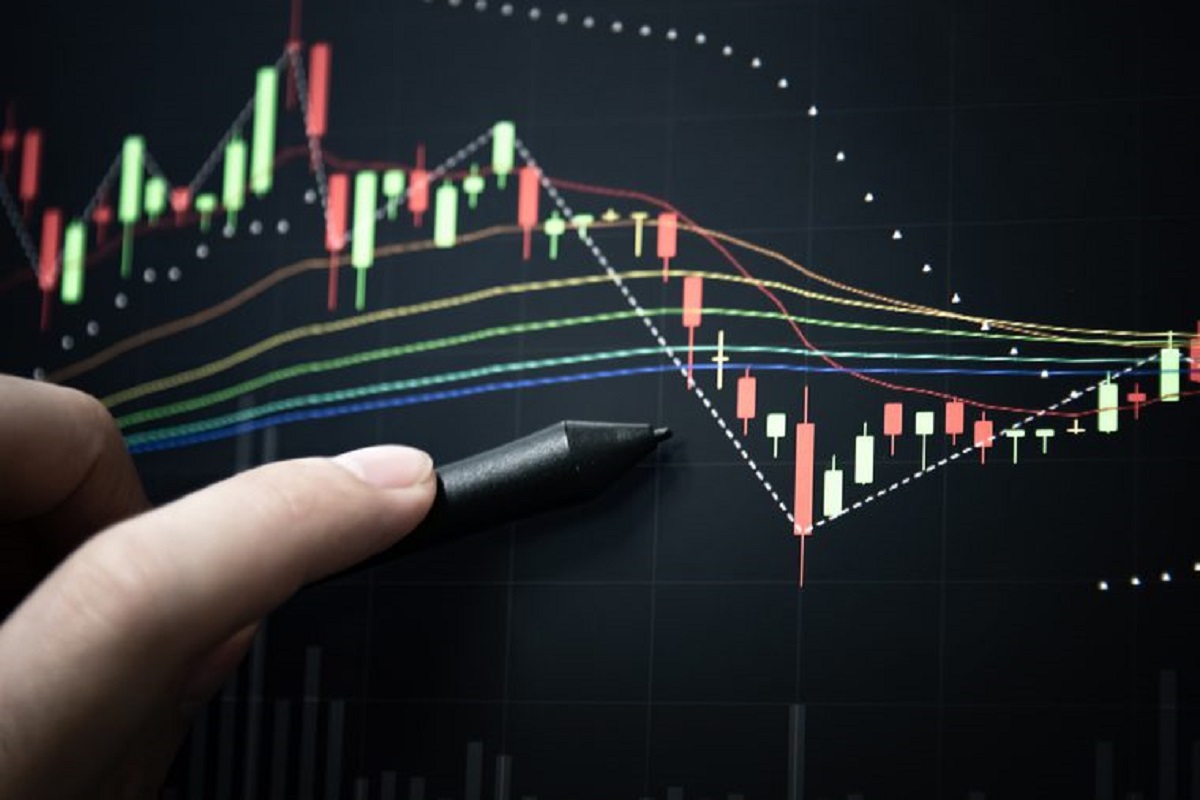
Candlestick charts, also known as Japanese candlestick charts, are a popular way to represent the price movement of financial assets, including digital currencies. They provide a visual representation of price data over a specified time period, making it easier for traders to identify patterns, trends, and potential market reversals.
Each candlestick on the chart represents a specific time frame, such as one minute, one hour, or one day. The shape and color of the candlestick can reveal crucial information about the price dynamics during that time frame. By analyzing these patterns, traders can gain insights into the market sentiment and make more informed trading decisions.
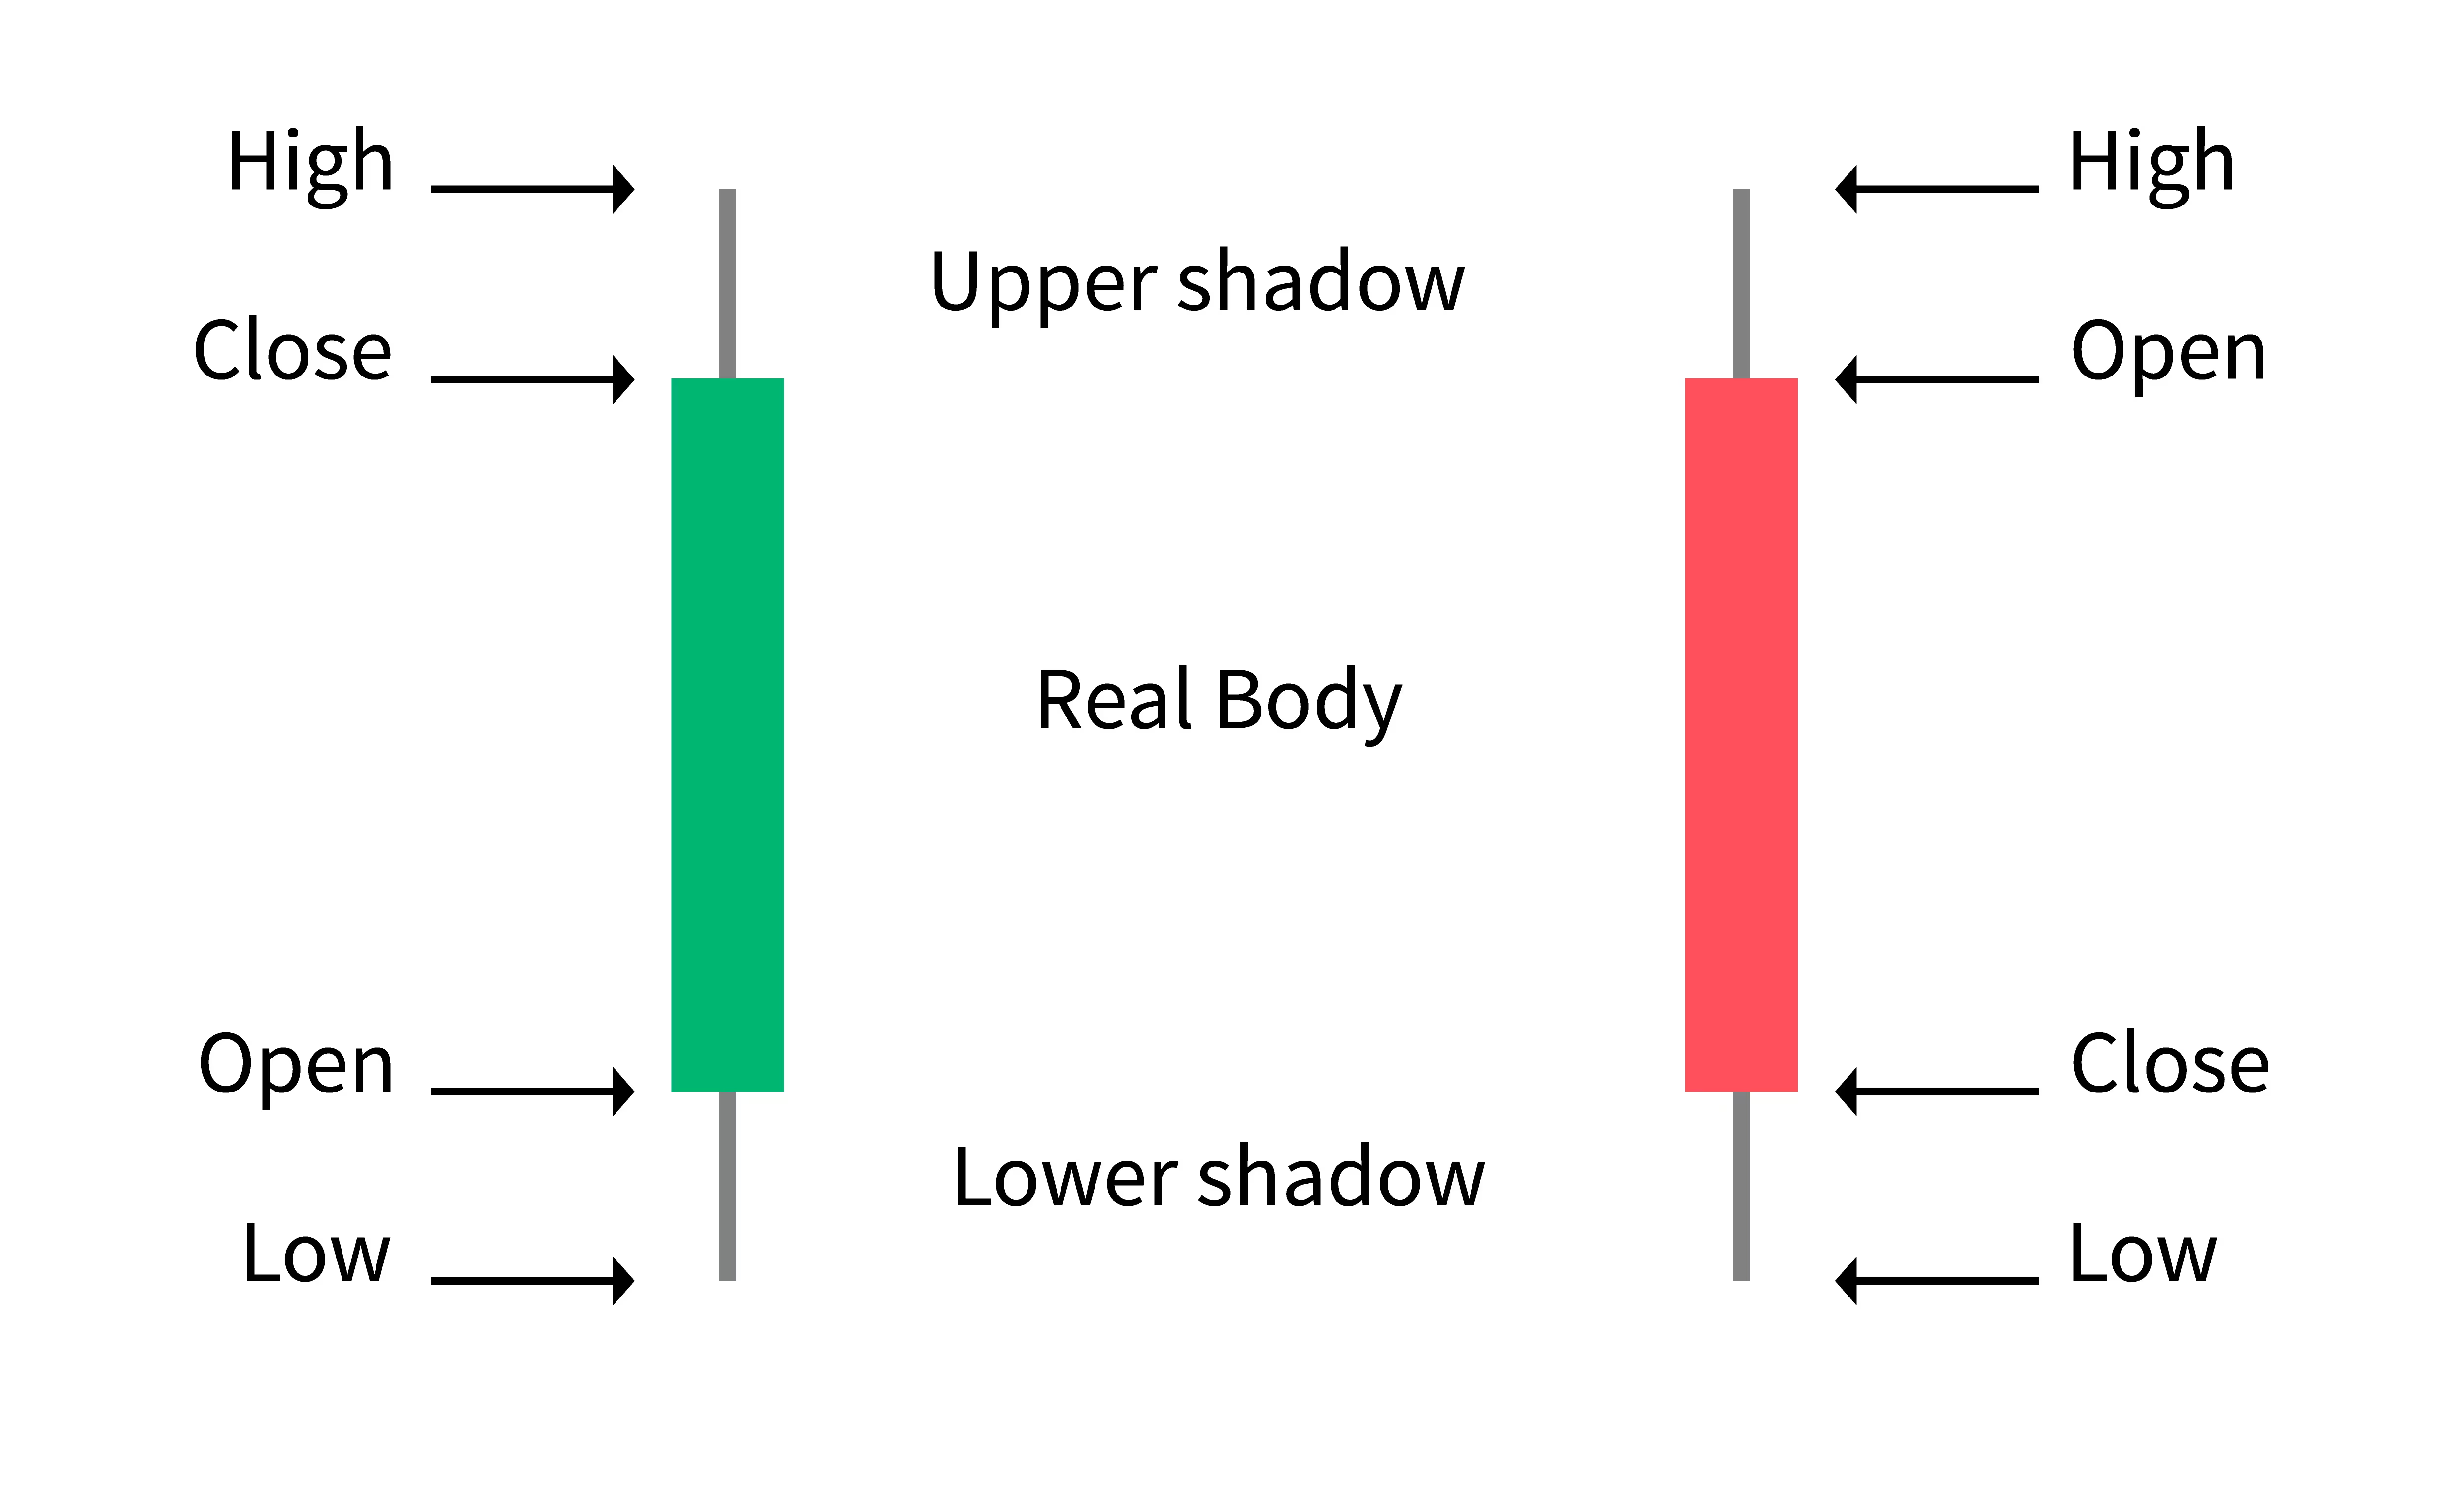
The basic components of a candlestick are the body and the wicks (also known as shadows). The body represents the price range between the opening and closing prices, while the wicks show the high and low prices during the time period.
If the closing price is higher than the opening price, the candlestick is typically colored green or white, indicating a bullish or positive sentiment. Conversely, if the closing price is lower than the opening price, the candlestick is usually colored red or black, indicating a bearish or negative sentiment.
It’s important to note that not all candlestick charts use the same color scheme. Different trading platforms and charting tools may have their own coloring conventions, but the underlying principles remain the same.
Candlestick charts are incredibly versatile, offering a wide range of patterns and formations that traders can analyze. These patterns can indicate potential reversals, continuations, or consolidation phases in the market. By combining the analysis of candlestick patterns with other technical indicators, traders can develop a comprehensive trading strategy to enhance their decision-making process.
Now that we have a basic understanding of candlestick charts, let’s explore how to interpret these patterns and make sense of the market movements.
The Basics of Candlestick Representation
To effectively analyze candlestick charts, it’s important to understand the basic elements of candlestick representation. Each individual candlestick can provide valuable insights into price dynamics and market sentiment.
As mentioned earlier, a candlestick consists of a body and wicks/shadows. The body represents the price range between the opening and closing prices. When the closing price is higher than the opening price, the body is typically colored green or white. Conversely, when the closing price is lower than the opening price, the body is colored red or black.
The wicks or shadows, on the other hand, represent the high and low prices during the specified time frame. The upper wick shows the highest price reached, while the lower wick displays the lowest price. Analyzing the length and position of the wicks can provide valuable insights into market volatility and potential support or resistance levels.
It’s also important to understand the different time frames used in candlestick charts. Depending on your trading strategy and goals, you can choose different time periods, such as one minute, one hour, one day, or even longer. Shorter time frames provide more granular details about price movements, while longer time frames offer a broader perspective on trends.
Additionally, candlestick charts can be configured to display different market data, including opening, high, low, and closing prices. Some charts may also include volume information, which can give an indication of the level of market participation during a specific time frame.
Understanding the basics of candlestick representation is crucial for accurately interpreting price patterns and making informed trading decisions. By analyzing the size, color, and position of the candlesticks, traders can identify potential trends, reversals, and areas of support and resistance.
Now that we have covered the basics of candlestick representation, let’s move on to the exciting part – learning how to interpret candlestick patterns and make sense of the market movements.
How to Interpret Candlestick Patterns
Interpreting candlestick patterns is an essential skill for traders looking to gain insights into market trends and potential price reversals. By understanding and recognizing these patterns, traders can make more informed decisions and increase their chances of success in the digital currency market.
There are numerous candlestick patterns that traders can analyze, each with its own significance and implications. Here are some common candlestick patterns and how to interpret them:
1. Doji: A doji candlestick has a small or nonexistent body, indicating that the opening and closing prices are almost the same. This pattern suggests indecision in the market and can signal a potential reversal or trend continuation depending on the context.
2. Hammer: A hammer candlestick has a small body and a long lower wick, resembling a hammer. This pattern typically indicates a potential bullish reversal, especially after a downtrend. The long lower wick suggests that buyers are stepping in and pushing the price higher.
3. Engulfing: An engulfing pattern occurs when a larger candle “engulfs” the previous smaller candle, indicating a potential reversal. A bullish engulfing pattern forms when a larger green candle completely engulfs the previous red candle, suggesting a shift from bearish to bullish sentiment. The opposite is true for a bearish engulfing pattern.
4. Shooting Star: A shooting star candlestick has a small body and a long upper wick, resembling a shooting star. This pattern often occurs at the end of an uptrend and can signal a potential bearish reversal. The long upper wick shows that sellers are pushing the price lower after an initial upward movement.
5. Tweezer Tops and Bottoms: Tweezer tops and bottoms are formed when two or more consecutive candlesticks have similar highs or lows, indicating a potential reversal. A tweezer top occurs when two candlesticks have matching highs, suggesting a potential bearish reversal. A tweezer bottom, on the other hand, occurs when two candlesticks have similar lows, indicating a potential bullish reversal.
These are just a few examples of candlestick patterns that traders can use to interpret price movements. It’s important to remember that candlestick patterns should not be used in isolation. Traders should analyze these patterns within the broader context of the market, considering other technical indicators, support and resistance levels, and market fundamentals.
By combining the analysis of candlestick patterns with other tools and strategies, traders can develop a more comprehensive and effective approach to interpreting market movements and making informed trading decisions.
Bullish Candlestick Patterns
Bullish candlestick patterns are formation of candlesticks that indicate potential upward price movements in the market. These patterns often provide traders with signals of bullish sentiment and can be used as indications to enter into long positions or hold existing positions.
Here are some common bullish candlestick patterns:
1. Hammer: As mentioned before, a hammer candlestick has a small body and a long lower wick. This pattern suggests that buyers are stepping in and pushing the price higher, indicating a potential bullish reversal.
2. Bullish Engulfing: A bullish engulfing pattern occurs when a larger green candle completely engulfs the previous smaller red candle. This formation suggests a shift from bearish to bullish sentiment, indicating potential upward price movement.
3. Piercing Line: The piercing line pattern consists of a small red candle followed by a larger green candle that opens below the previous candle’s low and closes above its midpoint. This formation indicates a potential reversal from a downtrend to an uptrend.
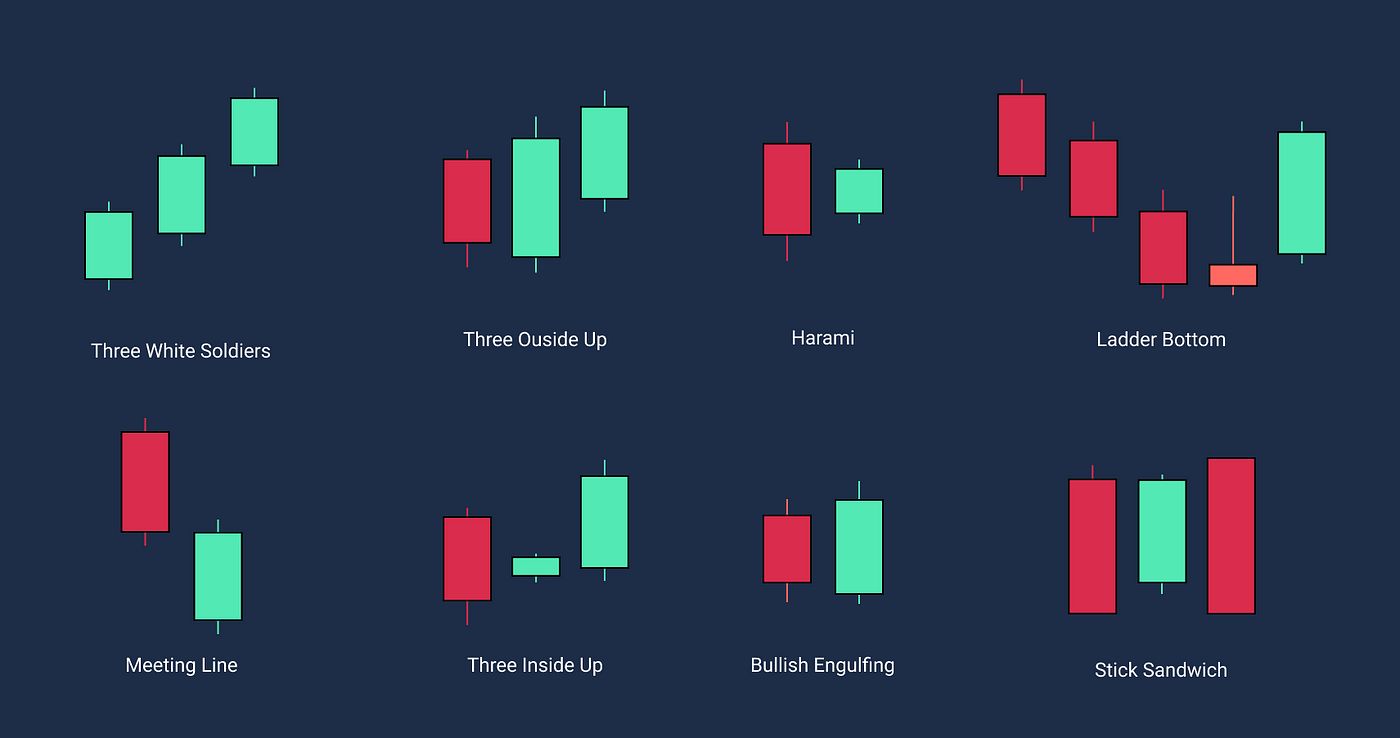
4. Three White Soldiers: The three white soldiers pattern is a bullish reversal pattern that consists of three consecutive green candles with each candle closing higher than the previous one. This formation suggests a strong uptrend and a potential continuation of bullish sentiment.
5. Bullish Harami: A bullish harami pattern occurs when a small red candle is followed by a larger green candle that is completely contained within the body of the previous candle. This formation indicates a potential trend reversal from bearish to bullish.
These are just a few examples of bullish candlestick patterns that traders can look for in the market. It’s important to note that the reliability of these patterns increases when they occur after a downtrend or at key support levels.
When identifying bullish candlestick patterns, it’s crucial to consider other technical indicators, support and resistance levels, and market fundamentals to confirm the potential bullish sentiment. Additionally, risk management and proper position sizing should always be taken into account when trading based on candlestick patterns.
By recognizing and understanding these bullish candlestick patterns, traders can gain insights into potential bullish price movements and make more informed trading decisions.
Bearish Candlestick Patterns
Bearish candlestick patterns are formations of candlesticks that indicate potential downward price movements in the market. These patterns often provide traders with signals of bearish sentiment and can be used as indications to enter into short positions or exit existing long positions to avoid potential losses.
Here are some common bearish candlestick patterns:
1. Shooting Star: A shooting star candlestick has a small body and a long upper wick, resembling a shooting star. This pattern often occurs at the end of an uptrend and suggests a potential bearish reversal. The long upper wick indicates that sellers are pushing the price lower after an initial upward movement.
2. Bearish Engulfing: A bearish engulfing pattern occurs when a larger red candle completely engulfs the previous smaller green candle. This formation suggests a shift from bullish to bearish sentiment, indicating potential downward price movement.
3. Dark Cloud Cover: The dark cloud cover pattern consists of a small green candle followed by a larger red candle that opens above the previous candle’s high and closes below its midpoint. This formation indicates a potential reversal from an uptrend to a downtrend.
4. Three Black Crows: The three black crows pattern is a bearish reversal pattern that consists of three consecutive red candles with each candle closing lower than the previous one. This formation suggests a strong downtrend and a potential continuation of bearish sentiment.
5. Bearish Harami: A bearish harami pattern occurs when a small green candle is followed by a larger red candle that is completely contained within the body of the previous candle. This formation indicates a potential trend reversal from bullish to bearish.
These are just a few examples of bearish candlestick patterns that traders can look for in the market. It’s important to note that the reliability of these patterns increases when they occur after an uptrend or at key resistance levels.
When identifying bearish candlestick patterns, it’s crucial to consider other technical indicators, support and resistance levels, and market fundamentals to confirm the potential bearish sentiment. Additionally, risk management and proper position sizing should always be taken into account when trading based on candlestick patterns.
By recognizing and understanding these bearish candlestick patterns, traders can gain insights into potential bearish price movements and make more informed trading decisions.
Common Mistakes to Avoid When Reading Candlesticks
Reading candlestick charts can be a powerful tool to understand market trends and make informed trading decisions. However, there are common mistakes that traders should avoid when interpreting candlestick patterns to ensure accurate analysis and avoid costly errors. Let’s explore some of these pitfalls:
1. Ignoring the Context: One of the biggest mistakes traders make is not considering the broader market context when analyzing candlestick patterns. Candlestick patterns should be evaluated in conjunction with other technical indicators, support and resistance levels, and overall market trends to avoid making decisions solely based on individual candlestick formations.
2. Overreliance on Candlestick Patterns: While candlestick patterns can be highly informative, relying solely on them for decision-making can be risky. It’s essential to utilize multiple tools and indicators to confirm the signals provided by candlesticks and reduce the likelihood of false signals.
3. Not Differentiating Between Timeframes: Each timeframe in a candlestick chart provides different information about price movements. Failing to consider the timeframe can lead to misinterpretation or missing out on crucial details. It’s important to align your trading strategy with the appropriate timeframe for accurate analysis.
4. Ignoring Market Fundamentals: Candlestick patterns alone may not capture the full picture of market dynamics. Ignoring fundamental analysis, such as news events or economic indicators, can lead to misreading candlestick patterns. It’s crucial to consider both technical and fundamental aspects of the market for a comprehensive analysis.
5. Disregarding Risk Management: Proper risk management is vital in trading. Neglecting risk management principles and placing excessive reliance on candlestick patterns alone can result in significant losses. Traders should always set stop-loss orders and manage position sizes to protect themselves from adverse market movements.
6. Failure to Backtest Strategies: Developing and utilizing a trading strategy based on candlestick patterns without proper backtesting can be a costly mistake. Traders should backtest their strategies using historical data to evaluate their effectiveness and make necessary adjustments before implementing them in live trading.
Avoiding these common mistakes when reading candlestick patterns can help traders improve their decision-making process and increase the accuracy of their trades. By combining candlestick analysis with a holistic approach to market analysis and proper risk management, traders can enhance their chances of success in the digital currency market.
Tips for Reading Candlesticks Effectively
While reading candlestick charts may seem complex at first, with practice and knowledge, it becomes easier to interpret these valuable tools for trading decisions. Here are some effective tips to improve your candlestick reading skills:
1. Study Candlestick Patterns: Familiarize yourself with different candlestick patterns and their meanings. Learn to identify common patterns such as doji, hammer, engulfing, and shooting star. Understanding these patterns will help you recognize potential reversals or continuation signals in the market.
2. Consider Candlestick Size and Volume: Pay attention to the size of the candlesticks. Longer bodies indicate stronger buying or selling pressure. Additionally, consider volume alongside candlestick patterns to confirm the strength of a move. Higher volume during a specific candlestick can validate the significance of the pattern.
3. Combine with Technical Indicators: Utilize technical indicators such as moving averages, stochastic oscillators, or relative strength index (RSI) alongside candlestick analysis. The combination of these tools can provide a more comprehensive view of market trends and confirm potential trade setups.
4. Identify Support and Resistance Levels: Use candlestick patterns to identify key support and resistance levels in the market. These levels can help determine potential entry and exit points and add another layer of confirmation to your trading decisions.
5. Consider Multiple Timeframes: Analyze candlestick patterns across multiple timeframes. Higher timeframes can help identify long-term trends, while shorter timeframes provide more detailed information for shorter-term trades. Combining multiple timeframes can provide a well-rounded analysis of the market.
6. Practice with Historical Data: Backtesting candlestick patterns using historical data can help validate their effectiveness and build confidence in your trading strategy. Use charting platforms or trading simulators to practice analyzing different timeframes and patterns without risking real money.
7. Stay Informed: Keep up to date with market news and events that may impact the digital currency market. External factors can influence price movements, and staying informed will help you make better-informed decisions when interpreting candlestick patterns.
8. Maintain Risk Management: Always ensure proper risk management by setting stop-loss orders and monitoring position sizes. Candlestick patterns are not infallible, and losses can occur. By implementing risk management techniques, you can limit potential losses and protect your trading capital.
By following these tips and consistently practicing your analysis skills, you can improve your ability to read and interpret candlestick patterns effectively. Remember to always trade with caution and make decisions based on a comprehensive analysis of the market.
Conclusion
Candlestick charts provide a powerful visual representation of price movements in the digital currency market. By understanding how to read and interpret candlestick patterns, traders can gain valuable insights into market trends, potential reversals, and optimal entry and exit points for their trades.
Throughout this guide, we have explored the basics of candlestick representation, including the components of candlesticks and their meanings. We have also delved into the interpretation of various candlestick patterns, both bullish and bearish, and highlighted common mistakes to avoid when reading candlesticks.
Effective candlestick analysis requires a comprehensive approach that considers other technical indicators, market fundamentals, and support and resistance levels. By combining candlestick patterns with other tools and strategies, traders can enhance their decision-making process and increase their chances of success in the digital currency market.
Remember, reading candlesticks is a skill that develops over time through practice, observation, and ongoing education. Continuously refine your understanding of candlestick patterns, study price action, and stay up to date with market trends and news.
By following the tips provided in this guide and dedicating time to hone your candlestick reading skills, you can gain a competitive edge in the digital currency market and make more informed trading decisions.