Introduction
Data normalization is a crucial step in machine learning that involves transforming and organizing data to a standard scale. It plays a fundamental role in improving the accuracy and efficiency of machine learning algorithms by ensuring that all features are treated equally and prevent any bias or dominance by a particular attribute. In this article, we will explore the concept of data normalization in machine learning, its importance, and various methods to achieve it.
Machine learning algorithms rely heavily on data to make predictions and derive meaningful insights. However, the input data can come from different sources, have varying ranges, or follow diverse distributions. This heterogeneity can create challenges and lead to biased results. By normalizing the data, we can bring it to a common scale and distribution, making it easier for the algorithms to process and analyze the information effectively.
Data normalization aims to eliminate the dependency of machine learning models on specific input data characteristics. It ensures that all features contribute to the learning process equally, preventing any attribute from overpowering the model’s decision-making process based on its scale or distribution. By normalizing the data, we can avoid skewed outcomes and achieve a more accurate and reliable machine learning model.
Furthermore, data normalization facilitates comparison between different features. If the features have different scales or ranges, it may be challenging to assess their relative importance or make meaningful comparisons. By bringing the data to a standard scale, normalization allows us to identify patterns, correlations, and dependencies more accurately.
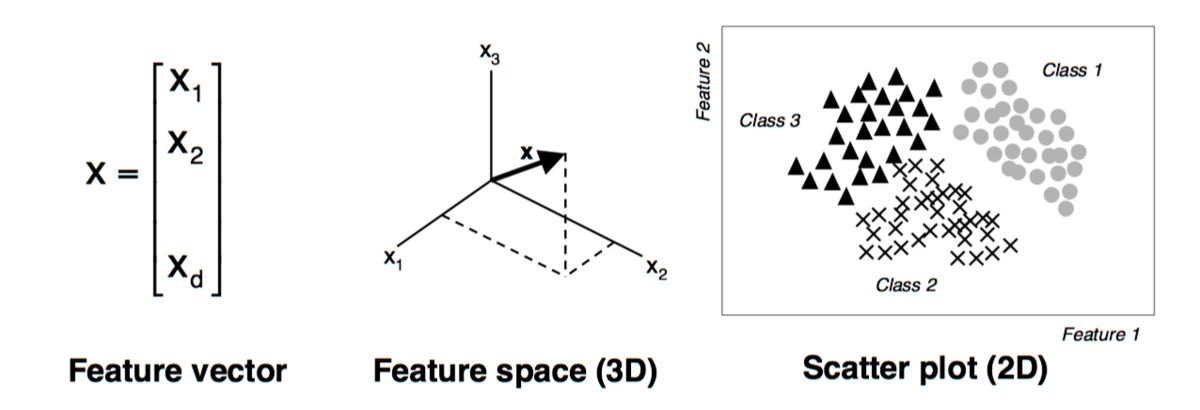
Another benefit of data normalization is its impact on the convergence speed of machine learning algorithms. When the input data is normalized, the algorithms are more likely to converge quickly, as they can effectively navigate through the feature space without getting stuck due to variable magnitudes or distributions.
In the following sections, we will explore various methods and techniques used for data normalization in machine learning. Each method has its own advantages and is suitable for different scenarios. Understanding these normalization techniques will equip you with the knowledge to choose the most appropriate method for your specific machine learning tasks.
What Is Data Normalization?
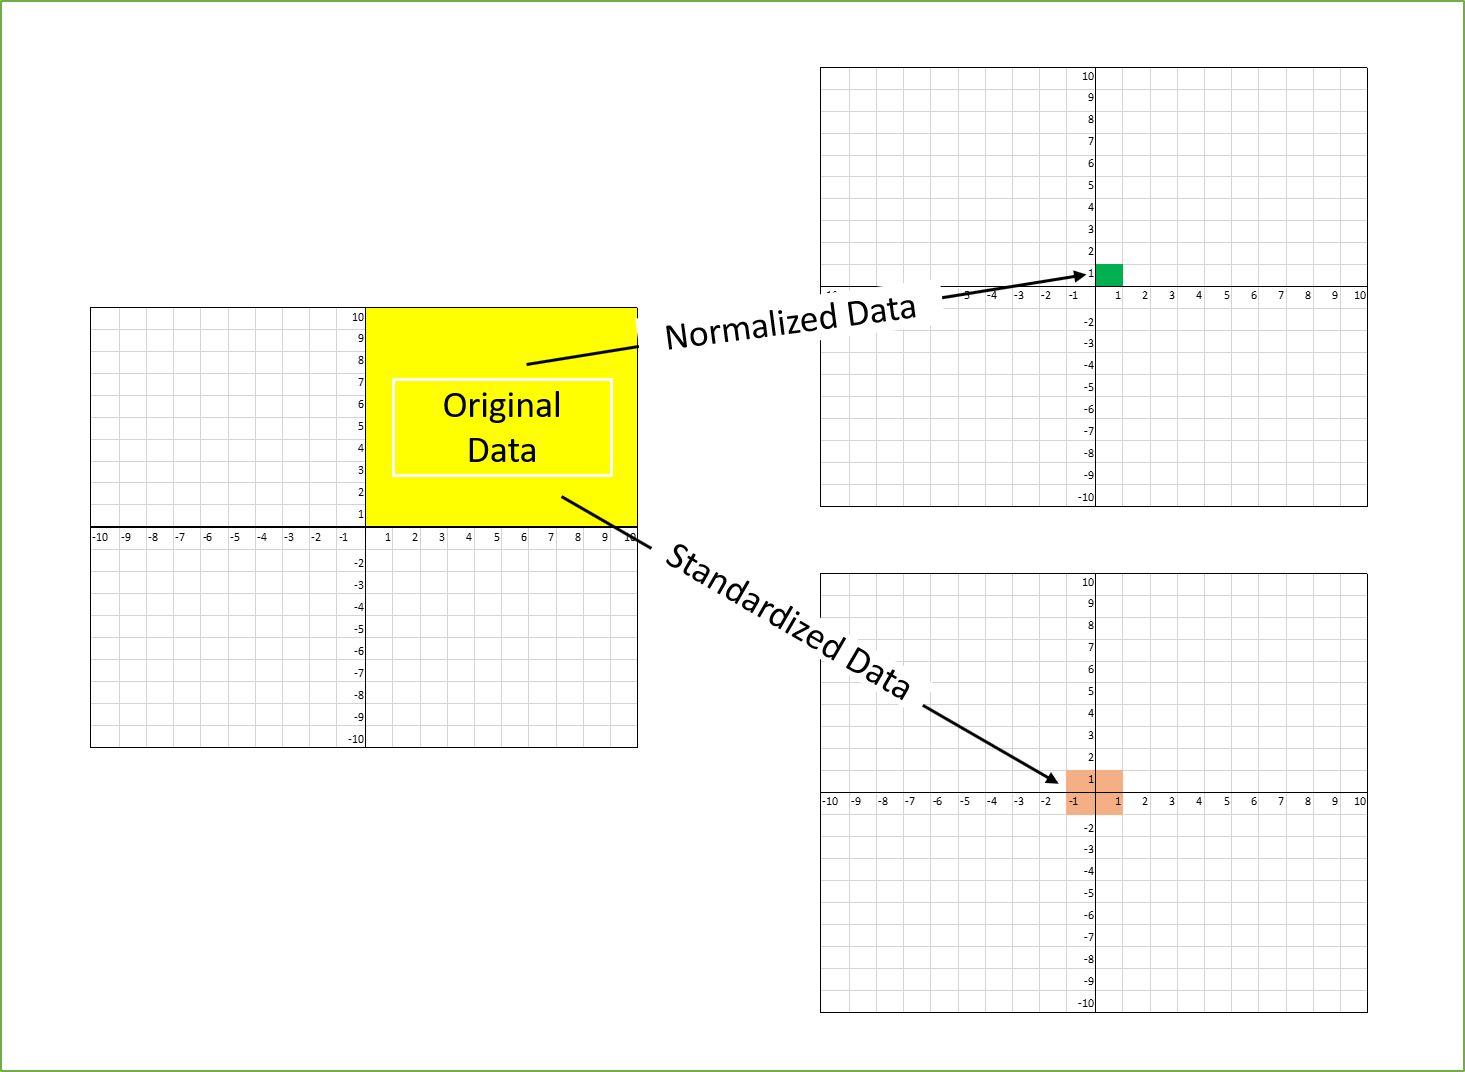
Data normalization is the process of transforming and restructuring data to adhere to a standardized format or scale. In the context of machine learning, data normalization ensures that the input features are on a similar scale, have a similar distribution, and do not contain any outliers that can negatively impact the performance of the machine learning algorithm.
Normalization is necessary because the input data used by machine learning algorithms can often vary significantly in terms of scale and distribution. For example, one feature may have values ranging from 0 to 100, while another feature might have values ranging from 0 to 1000. When these features are not normalized, the algorithm may give more weight to the feature with larger values, potentially leading to biased results.
To overcome this issue, data normalization techniques are applied to ensure that all features share a common scale and distribution. This allows the machine learning algorithm to treat each feature equally during the learning process, preventing any single feature from dominating the model’s predictive power.
There are various methods of data normalization, each with its own advantages and use cases. The most common normalization techniques include Min-Max Scaling, Z-Score Scaling (Standardization), Robust Scaling, and Log Transformation or Box-Cox Transformation. These techniques transform the values of the input features in different ways, bringing them to a standardized range or distribution.
Data normalization not only helps in achieving a fair comparison between different features but also ensures that the machine learning algorithm works efficiently and effectively. By bringing all features to a similar scale, the algorithm can navigate through the feature space without encountering issues related to variable magnitudes or distributions. This leads to faster convergence and improved accuracy of the model.
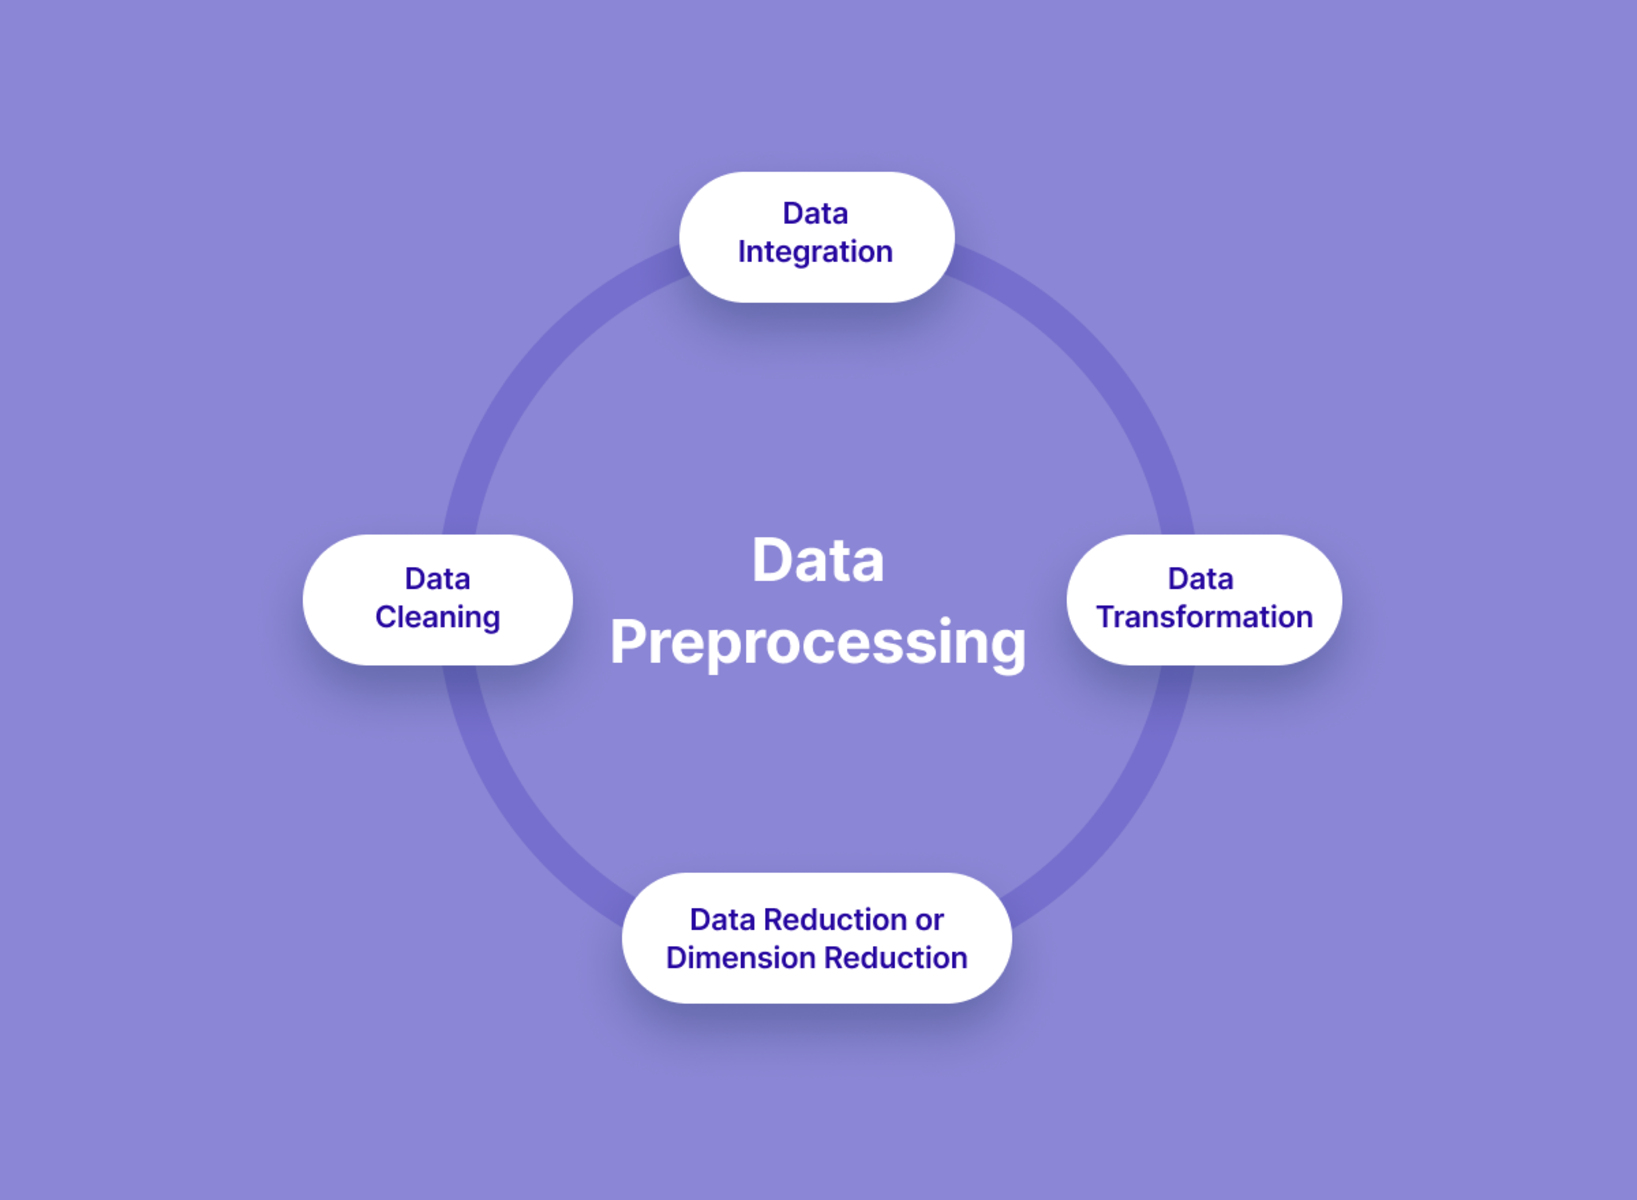
Overall, data normalization is an essential step in the data preprocessing phase of machine learning. It normalizes the data, eliminates bias, enhances the efficiency of the algorithm, and allows for fair comparisons between features. By applying appropriate data normalization techniques, machine learning models can deliver more accurate predictions and insights, contributing to better decision-making and improved performance in various domains like healthcare, finance, and marketing.
Why is Data Normalization Important in Machine Learning?
Data normalization plays a vital role in machine learning for several reasons. Let’s explore the significance of data normalization in machine learning:
1. Eliminating Bias: Data normalization ensures that all features in the dataset are equally represented and do not introduce any biases. By bringing the features to a common scale, normalization prevents any single feature from dominating the learning process and influencing the model disproportionately based on its magnitude or distribution.
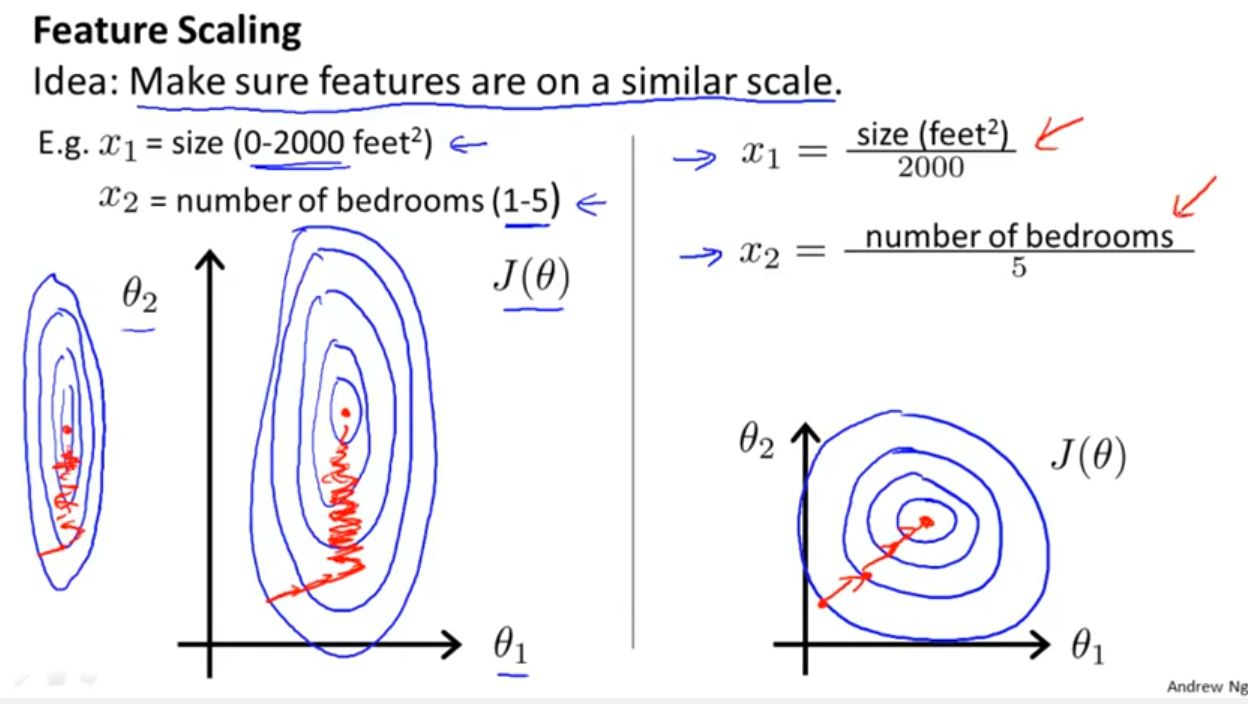
2. Improved Model Performance: Normalizing the input data helps machine learning algorithms converge faster and achieve better performance. When the features are on similar scales, the gradient descent optimization algorithm can update the model’s parameters more efficiently, leading to faster convergence and improved accuracy.
3. Facilitating Fair Comparisons: In machine learning, it is essential to compare the relative importance of different features. Data normalization allows for fair comparisons between features by eliminating the influence of different scales. Being able to accurately assess the contributions of each feature aids in understanding feature importance and selecting relevant variables for model training.
4. Handling Outliers: Outliers can significantly impact the performance of machine learning algorithms. Data normalization techniques, such as the robust scaling method, can help mitigate the impact of outliers by reducing the magnitude of extreme values, making the algorithm more robust to their influence.
5. Enhanced Interpretability: Normalizing data can make the interpretation of model coefficients or feature importance easier. By bringing the features to a common scale, it becomes straightforward to compare the impact of different variables on the model’s predictions.
6. Compatibility with Distance-based Algorithms: Many machine learning algorithms, such as clustering and K-nearest neighbors, rely on measuring the similarity or distance between data points. Data normalization ensures that the distance-based algorithms are not skewed by features with larger scales, allowing for accurate distance calculations.
7. Generalizability: Normalizing data helps in creating models that generalize well to unseen data. When models are trained on normalized data, they become less sensitive to variations in the input data, enabling them to make accurate predictions on new data that might have different scales or distributions.
Overall, data normalization is crucial in machine learning as it enables fair comparisons between features, improves model performance, mitigates the impact of outliers, enhances interpretability, ensures compatibility with distance-based algorithms, and promotes generalizability. By normalizing the data, machine learning models can produce reliable and accurate predictions, leading to better decision-making and insights.
Different Methods of Data Normalization
There are several methods available to normalize data in machine learning. Each method has its own strengths and is suitable for different scenarios. Let’s explore some of the commonly used data normalization techniques:
1. Min-Max Scaling: This normalization technique, also known as feature scaling, rescales the data to a fixed range, typically between 0 and 1. It works by subtracting the minimum value of the feature and dividing it by the difference between the maximum and minimum values. Min-Max scaling is useful when the distribution of the data is known to be uniformly distributed.
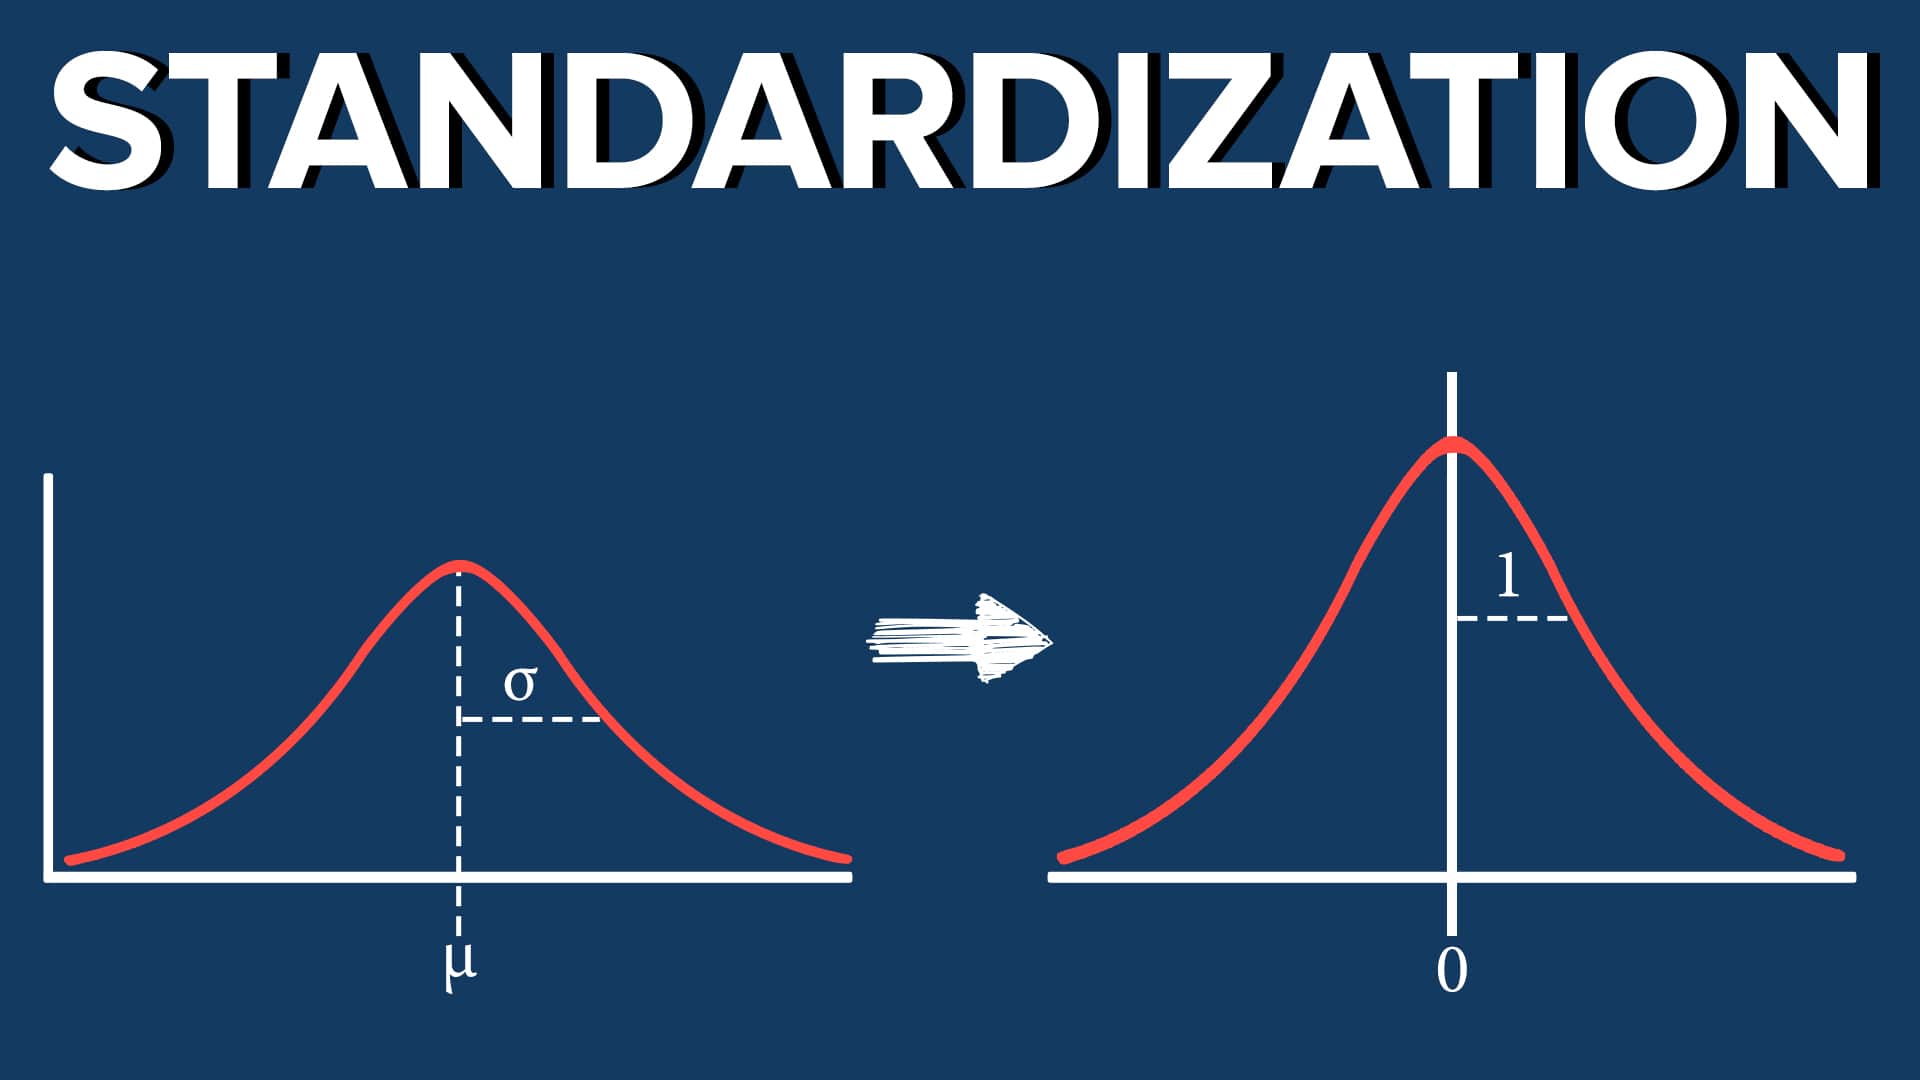
2. Z-Score Scaling (Standardization): Z-Score scaling transforms the data to have a mean of 0 and a standard deviation of 1. It subtracts the mean of the feature and divides it by the standard deviation. This method is effective when the data follows a normal distribution and can handle outliers well.
3. Robust Scaling: Robust scaling uses the interquartile range (IQR) to scale the data. It subtracts the median and divides it by the IQR, which is the range between the first quartile and the third quartile. Robust scaling is ideal when the data contains outliers or is not normally distributed.
4. Log Transformation or Box-Cox Transformation: These transformations are useful when the data is skewed or has a non-normal distribution. Log transformation applies the natural logarithm to the data, while the Box-Cox transformation allows for different power transformations to normalize the data.
Each normalization method has different effects on the data, and the choice of which method to use depends on the characteristics of the dataset and the goals of the machine learning task. It is essential to consider factors such as the distribution of the data, the presence of outliers, and the requirements of the specific machine learning algorithm.
Moreover, it is crucial to note that normalization should be applied separately to the training and testing sets, using parameters obtained from the training set. This ensures that the model is not exposed to any information from the testing set during the normalization process, preventing any information leakage.
Data normalization is a critical step in the data preprocessing pipeline for machine learning. It ensures that all features are on a similar scale, eliminates biases, and improves the performance and accuracy of machine learning models. Understanding different normalization techniques is essential for practitioners to choose the most appropriate method based on the specific characteristics of their datasets and machine learning tasks.
Min-Max Scaling
Min-Max scaling, also known as feature scaling, is a data normalization technique used to transform the data to a fixed range, typically between 0 and 1. It is a linear transformation method that preserves the relative ordering of the data points. Min-Max scaling involves subtracting the minimum value of the feature and dividing it by the difference between the maximum and minimum values.
This normalization technique is particularly useful when the distribution of the data is known to be uniformly distributed. It brings all features to a common scale, ensuring that none of them have a dominant influence on the machine learning algorithm simply due to differences in their magnitudes.
The formula for Min-Max scaling is as follows:
Scaled Value = (Value – Minimum) / (Maximum – Minimum)
Where:
- Value: The original value of the feature
- Minimum: The minimum value of the feature
- Maximum: The maximum value of the feature
After applying Min-Max scaling, the transformed values will fall between 0 and 1. If the minimum value of the feature is 0 and the maximum value is 100, for example, a value of 50 would be scaled to 0.5.
This method is helpful when the absolute values of the features are not critical, but rather their relative positions or proportions. It allows for fair comparisons between features and helps the machine learning algorithm to converge efficiently.
It is important to note that Min-Max scaling is sensitive to outliers. If the data contains outliers, they can disproportionately affect the scaled values and potentially distort the model’s performance. In such cases, other normalization techniques like Robust Scaling may be more appropriate.
Min-Max scaling should be applied separately to the training and testing sets. The parameters for scaling, such as the minimum and maximum values, should be obtained from the training set to prevent information leakage and ensure the model’s ability to generalize to unseen data.
In summary, Min-Max scaling is a common method of data normalization that brings the features to a fixed range between 0 and 1. It is useful when the data follows a uniform distribution and ensures fair comparisons between features. However, the presence of outliers should be carefully considered, and other normalization techniques may be more suitable in such cases.
Z-Score Scaling (Standardization)
Z-Score scaling, also known as standardization, is a popular data normalization technique in machine learning. It transforms the data to have a mean of 0 and a standard deviation of 1. This technique is useful when the data follows a normal distribution and can handle outliers effectively.
To apply Z-Score scaling, we calculate the z-score for each data point by subtracting the mean of the feature and dividing it by the standard deviation. The formula for Z-Score scaling is as follows:
Z-Score = (Value – Mean) / Standard Deviation
Where:
- Value: The original value of the feature
- Mean: The mean value of the feature
- Standard Deviation: The standard deviation of the feature
This normalization technique standardizes the data by transforming it into units of standard deviations from the mean. After Z-Score scaling, the transformed values will have a mean of 0 and a standard deviation of 1.
The primary advantage of Z-Score scaling is that it allows for fair comparisons between features, regardless of their original scales. It ensures that all features are on a similar scale, preventing one feature from dominating the learning process due to higher magnitudes.
Z-Score scaling is also robust to outliers since it utilizes the mean and standard deviation, which are influenced by extreme values. By removing the mean and dividing by the standard deviation, the impact of outliers is minimized, making the technique suitable when the data contains outliers or is not normally distributed.
It is important to note that Z-Score scaling assumes that the data follows a normal distribution. If the data is highly skewed or does not satisfy the normality assumption, other normalization techniques like Robust Scaling or Log Transformation may be more appropriate.
Similar to Min-Max scaling, Z-Score scaling should be applied separately to the training and testing sets. The mean and standard deviation used for scaling should be computed from the training set to ensure fairness and prevent information leakage.
In summary, Z-Score scaling is a widely used data normalization technique that standardizes the data to have a mean of 0 and a standard deviation of 1. It enables fair comparisons between features and is robust to outliers. However, it assumes a normal distribution of the data and may not be suitable for highly skewed or non-normal distributions.
Robust Scaling
Robust scaling, also known as robust standardization, is a data normalization technique that is resistant to the influence of outliers. Unlike other normalization methods that rely on the mean and standard deviation, robust scaling uses the interquartile range (IQR) to scale the data. This makes it suitable for datasets that contain outliers or have non-normal distributions.
To apply robust scaling, we subtract the median from each data point and divide it by the IQR. The IQR is defined as the range between the first quartile (Q1) and the third quartile (Q3) of the data. The formula for robust scaling is as follows:
Robust Scaling = (Value – Median) / IQR
Where:
- Value: The original value of the feature
- Median: The median value of the feature
- IQR: The interquartile range of the feature (Q3 – Q1)
Robust scaling is effective in normalizing data that contains outliers or has a skewed distribution. It reduces the impact of extreme values by using the median instead of the mean and the IQR instead of the standard deviation. By doing so, the technique is less influenced by outliers and provides a robust measure of centrality and spread for the data.
One advantage of robust scaling is its ability to handle data with non-normal distributions. It does not assume any specific distribution and can be used with skewed and heavy-tailed data. This makes it useful when the data deviates significantly from normality.
Although robust scaling is robust to outliers, it does not preserve the exact shape of the original distribution. It compresses the values towards a narrower range, making the distribution more spread out. If preserving the original distribution is important for a particular analysis, other normalization techniques like Z-Score scaling or log transformation may be more appropriate.
Similar to other normalization methods, robust scaling should be applied separately to the training and testing sets. The median and IQR used for scaling should be calculated from the training set to ensure consistency and prevent data leakage.
In summary, robust scaling is a data normalization technique that uses the median and interquartile range to bring the data to a standardized range. It is effective in handling outliers and non-normal distributions. However, it compresses the values and may alter the shape of the original distribution. Robust scaling is particularly useful when dealing with datasets containing outliers or skewed data.
Log Transformation or Box-Cox Transformation
While Min-Max scaling and Z-Score scaling are appropriate for data with certain characteristics, there are situations where the data is skewed or does not follow a normal distribution. In such cases, log transformation or Box-Cox transformation can be applied as data normalization techniques.
Log Transformation: Log transformation is commonly used when the data is positively skewed or has a long tail. It involves applying the natural logarithm to the data, which compresses larger values more than smaller ones. Log transformation helps to reduce the impact of extreme values and makes the data more symmetrical, beneficial for linear regression models and other analyses that assume normality.
Box-Cox Transformation: The Box-Cox transformation is a more flexible method that can handle various types of data distributions. It transforms the data using a power transformation that can be adjusted to achieve the best approximation to a normal distribution. The optimal power parameter for the transformation is determined through iterative calculations, maximizing the log-likelihood of the data under different power transformations. The resulting transformed data is then more symmetric and suitable for analyses that assume normality.
Both log transformation and Box-Cox transformation can normalize skewed data and make it more suitable for machine learning algorithms that rely on assumptions of normality. These techniques help to overcome the limitations of scale and distribution of the data, allowing for more accurate modeling and analysis.
It is important to note that log transformation and Box-Cox transformation may not be appropriate for data that includes zero or negative values. In such cases, alternative methods specific to the data distribution, such as Yeo-Johnson transformation for the Box-Cox transformation, may be used to handle the non-positive values.
Application of log transformation or Box-Cox transformation requires careful consideration of the data characteristics and the specific requirements of the analysis. It is recommended to examine the data thoroughly, assess the distribution, and evaluate the impact of the transformation on the data before applying it to any machine learning model.
Like other normalization techniques, log transformation or Box-Cox transformation should be performed separately on the training and testing sets to avoid information leakage and ensure the model’s ability to generalize to unseen data.
In summary, log transformation and Box-Cox transformation are normalization techniques used to handle skewed or non-normal distributions in data. They can make the data more symmetrical and suitable for machine learning models that rely on assumptions of normality. However, the suitability of these transformations depends on the data characteristics and the specific analysis requirements.
Factors to Consider When Choosing a Normalization Method
When selecting a data normalization method for a machine learning task, it is important to consider several factors. Each normalization technique has its own strengths and is suitable for different types of data and analysis. Here are some key factors to consider when choosing a normalization method:
1. Data Distribution: Assess the distribution of the data. If the data follows a normal distribution, Z-Score scaling or Box-Cox transformation may be appropriate. For skewed or non-normal distributions, log transformation or Robust scaling may be more suitable.
2. Presence of Outliers: Consider the presence of outliers in the data. If the data contains extreme values, techniques such as Robust scaling, log transformation, or Box-Cox transformation may be effective in handling outliers and minimizing their impact on the normalization process.
3. Nature of the Features: Understand the characteristics and significance of the features in the dataset. If all features are equally important, Min-Max scaling or Z-Score scaling can be used to ensure fair comparisons. If some features are more crucial than others, other normalization methods that handle outliers or skewed distributions may be appropriate.
4. Specific Algorithm Requirements: Consider the specific requirements of the machine learning algorithm being used. Some algorithms, such as K-nearest neighbors or clustering, heavily rely on distance calculations. In such cases, normalization methods like Z-Score scaling or robust scaling that preserve relative distances may be preferable.
5. Interpretability: Evaluate the interpretability of the normalized data. Some normalization methods, such as Z-Score scaling or log transformation, may produce transformed values that are easily interpretable, allowing for a better understanding of the impact of each normalized feature on model predictions.
6. Data Variability: Consider the variability and range of values in the dataset. If the data has a wide range or different scales across features, methods like Min-Max scaling or Z-Score scaling can help bring the data to a standard scale, making it easier to compare feature contributions.
7. Data Consistency: Ensure consistency in the normalization process. Normalize the training and testing sets separately using the parameters obtained from the training set. This prevents information leakage and ensures proper model evaluation on unseen data.
By considering these factors, you can choose the most appropriate normalization method for your specific dataset and machine learning task. It may also be beneficial to experiment with different techniques to determine which one yields the best results for your particular scenario.
Conclusion
Data normalization is a crucial step in the machine learning pipeline that transforms and standardizes data to a common scale or distribution. It plays a significant role in improving the performance, accuracy, and reliability of machine learning models. By ensuring that all features are treated equally and eliminating biases originating from differences in scale or distribution, data normalization allows for fair comparisons, efficient convergence, and robustness to outliers.
In this article, we explored different methods of data normalization, including Min-Max scaling, Z-Score scaling, Robust scaling, and log transformation or Box-Cox transformation. Each method has its own advantages and is suitable for different types of data characteristics and analysis requirements. The choice of normalization technique depends on factors such as the data distribution, the presence of outliers, the interpretability of the transformed values, and the specific algorithm’s needs.
It is important to note that normalization methods should be applied separately to the training and testing sets to ensure proper model evaluation and avoid information leakage. Consistency in the normalization process is key to maintaining the integrity and generalizability of the machine learning model.
By selecting and applying the appropriate normalization technique, practitioners can enhance the performance and accuracy of their machine learning models. By bringing the input features to a common scale or distribution, data normalization facilitates fair comparisons, robust analysis, and better decision-making in various domains and applications.
It is essential to understand the characteristics of the data, evaluate the requirements of the machine learning algorithms being used, and consider the specific goals and constraints of the analysis to make an informed choice regarding the normalization method.
Overall, data normalization is a powerful tool that helps overcome the challenges posed by differing scales, distributions, and outliers in the input data. It ensures that machine learning models can effectively process and analyze the data, resulting in more accurate predictions and valuable insights.