Introduction
Welcome to the exciting world of machine learning! As you embark on your journey to explore the intricacies of this fascinating field, you will undoubtedly encounter a plethora of technical terms and concepts. One such term that holds significant importance is Mean Squared Error (MSE). Understanding what MSE is and its role in machine learning is crucial for developing accurate and reliable models.
MSE serves as an evaluation metric that quantifies the quality of a machine learning model’s predictions. It measures the average squared difference between the predicted and actual values in a data set. By using MSE, data scientists and analysts can assess the performance and effectiveness of their models, making it an invaluable tool for model evaluation.
To grasp the significance of MSE in machine learning, it is important to understand its definition and the formula used to calculate it. By examining the interpretation of MSE, and exploring its advantages and disadvantages, we can gain a comprehensive understanding of this evaluation metric and its applications.
In this article, we will delve into the intricacies of MSE, its uses, and explore alternative evaluation metrics that can be used in conjunction with or as a substitute for MSE.
But first, let’s start by formally defining MSE in the context of machine learning.
Definition of MSE
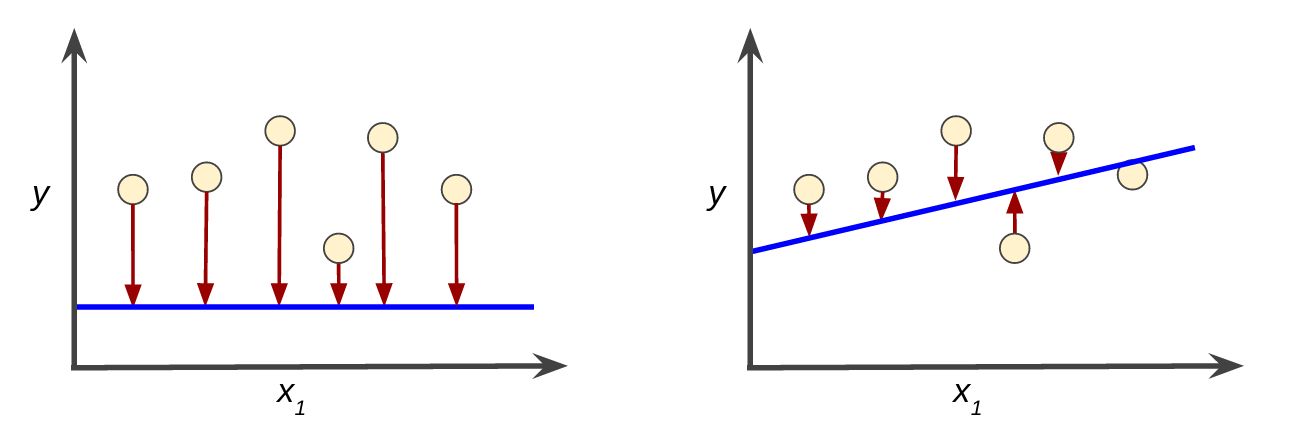
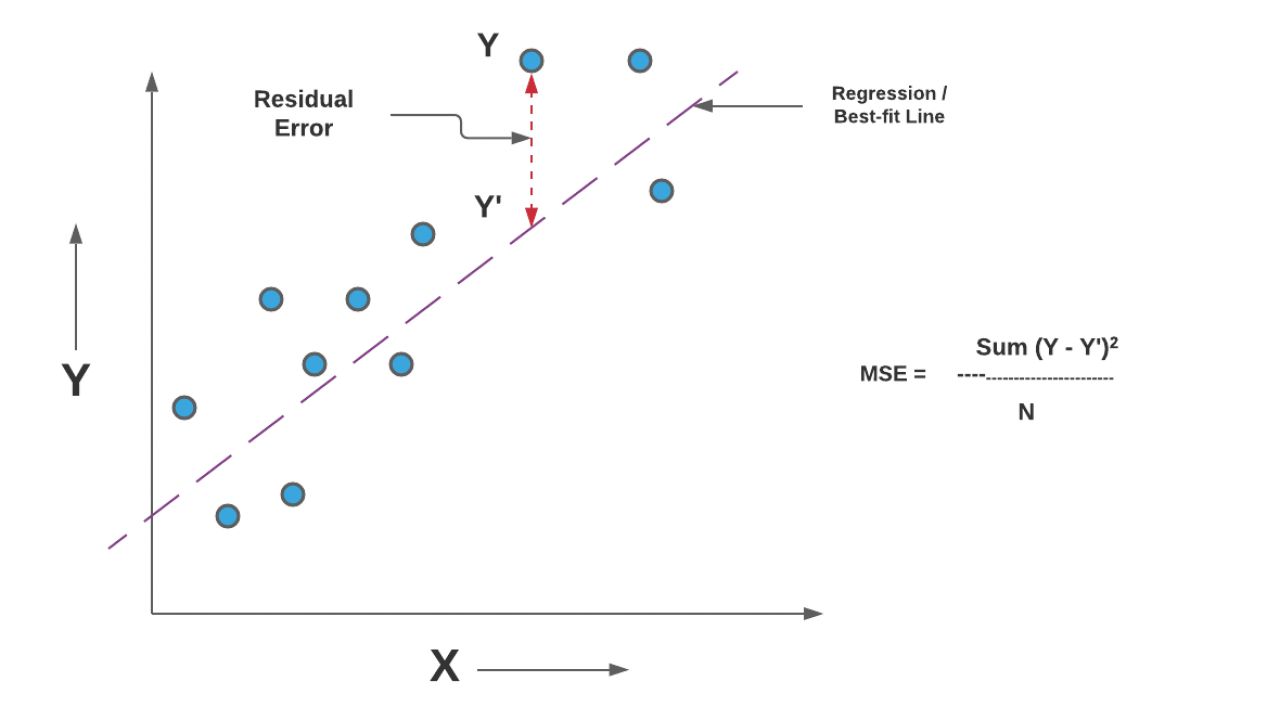
Mean Squared Error (MSE) is a statistical measure used to assess the quality of a machine learning model by quantifying the average squared difference between the predicted values and the actual values in a dataset. It is widely employed in various regression problems and serves as a common evaluation metric in machine learning algorithms.
To calculate MSE, the differences between the predicted and actual values are squared, and then an average is taken over the entire dataset. This ensures that both positive and negative errors contribute to the overall evaluation, and that larger errors have a greater impact due to the squaring operation.
MSE is particularly beneficial in scenarios where the magnitude of errors should be considered more heavily, such as in financial predictions or scientific experiments. By squaring the errors, MSE places a higher weight on outliers and large deviations, highlighting their impact on the overall performance of the model.
The calculated MSE value represents the mean of the squared errors and is always a positive number. A lower MSE indicates that the model’s predictions are closer to the actual values, whereas a higher MSE value implies a larger discrepancy between the predicted and actual values.
It is important to note that MSE is sensitive to outliers since their squared values can significantly influence the overall metric. Therefore, it is crucial to consider the nature of the data and the potential presence of outliers while interpreting the MSE values.
Now that we have a clear definition of MSE, let’s dive into the formula used to calculate it.
Formula of MSE
The formula to calculate Mean Squared Error (MSE) involves three main steps: calculating the squared difference between predicted and actual values, summing these squared differences, and then dividing the sum by the total number of observations in the dataset.
Mathematically, the formula for MSE can be represented as follows:
$$MSE = \frac{1}{n} \sum_{i=1}^{n} (Y_i – \hat{Y}_i)^2$$
Where:
- MSE: Mean Squared Error
- n: Total number of observations in the dataset
- Yi: Actual value of the i-th observation
- Ŷi: Predicted value of the i-th observation
Let’s break down the formula to understand each component:
- (Yi – Ŷi): This represents the difference between the actual value and the predicted value for each observation. It tells us how far off the model’s prediction is from the true value.
- (Yi – Ŷi)^2: The squared difference helps eliminate the impact of positive and negative errors canceling each other out when averaging the errors. Squaring the differences ensures that all errors contribute positively to the overall evaluation.
- \sum_{i=1}^{n}: This symbol indicates the sum of all the squared differences across all observations. It sums up all the individual errors for each data point.
- \frac{1}{n}: Finally, dividing the sum by the total number of observations (n) calculates the average of the squared errors, giving us the mean squared error value.
By using this formula, we can obtain a single number that represents the average squared difference between the predicted and actual values, providing a quantifiable measure of how well the model performs.
Now that we have explored the formula for calculating MSE, let’s move on to understanding how to interpret MSE values.
Interpretation of MSE
Mean Squared Error (MSE) is a valuable metric for evaluating the performance of machine learning models, but understanding how to interpret the MSE values is equally important. The interpretation of MSE depends on the specific problem and the scale of the target variable being predicted.
A lower MSE value indicates that the model’s predictions are closer to the actual values in the dataset. It implies that the model has a smaller average squared difference between the predicted and actual values, making it more accurate.
However, it is essential to consider the scale of the target variable. If the target variable has a small range or is standardized, a lower MSE value may not provide much insight into the model’s performance. In such cases, it is helpful to interpret the MSE relative to the range or standard deviation of the target variable.
For example, let’s say we are predicting housing prices, and the MSE value is 10,000. Without any context, this number may not provide meaningful information. But if we know that the range of housing prices in the dataset is between $100,000 and $1,000,000, we can interpret the MSE as a relatively small error in comparison. Conversely, if the target variable’s range is small, such as predicting the height of a person, where the range may be only a few inches, an MSE of 10 may indicate a substantial error.
Another important consideration when interpreting MSE is to compare it with other models or benchmark values. If you have alternative models or previous results to compare against, you can assess the relative performance. If your model’s MSE is significantly lower than other models or below a predetermined threshold, it indicates better predictive capability.
Keep in mind that while MSE provides a quantifiable measure of error, it does not reveal the direction of the errors. A model with a low MSE value might still have biased predictions, consistently overestimating or underestimating the target variable. Therefore, it is crucial to examine additional evaluation metrics and conduct a thorough analysis of the model’s performance.
Now that we have explored the interpretation of MSE values, let’s examine the advantages of using MSE as an evaluation metric.
Advantages of using MSE
Mean Squared Error (MSE) offers several advantages as an evaluation metric in machine learning:
1. Sensitivity to large errors: MSE squares the differences between predicted and actual values, which gives more weight to larger errors. This sensitivity helps in identifying significant discrepancies and outliers, allowing for a more thorough analysis of a model’s performance.
2. Differentiable and smooth: MSE is a differentiable function, making it suitable for optimization algorithms that rely on gradient-based techniques. Its smooth nature allows for a more stable and reliable optimization process.
3. Widely used and understood: MSE is one of the most commonly used evaluation metrics in machine learning. Its widespread adoption has led to a general understanding of its meaning and interpretation among practitioners and researchers, making it easier to communicate and compare model performance.
4. Compatible with mathematical properties: The squared errors in MSE adhere to various mathematical properties, such as symmetry and non-negativity, which enable simpler mathematical calculations and analyses.
5. Well-suited for regression problems: MSE is particularly effective in evaluating regression models, where the prediction of continuous values is the primary objective. It provides a quantifiable measure of accuracy and helps in comparing competing regression models.
6. Availability in popular libraries and frameworks: Many popular machine learning libraries and frameworks, such as scikit-learn in Python, provide built-in functions to calculate MSE. This makes it easily accessible and convenient to use in model evaluation pipelines.
Despite its advantages, MSE does have some limitations and considerations to keep in mind. In the next section, we will explore the disadvantages of using MSE as an evaluation metric.
Disadvantages of using MSE
While Mean Squared Error (MSE) has its advantages, it is important to also consider its disadvantages as an evaluation metric:
1. Sensitivity to outliers: MSE squares the errors, which amplifies the impact of outliers on the overall metric. This sensitivity to outliers can lead to skewed results and an inaccurate representation of the model’s performance in the presence of extreme values. Alternative metrics may be more robust in handling outliers.
2. Lack of interpretability: MSE measures the average squared difference between predictions and actual values, but it does not provide direct insight into the meaning of the error. The lack of interpretability makes it challenging to communicate the significance of the error to a non-technical audience.
3. Biased towards larger errors: By squaring the errors, MSE places a greater emphasis on larger errors, potentially overshadowing the importance of smaller errors. In some cases, smaller errors may be more critical, and a metric that considers both large and small errors equally might be more appropriate.
4. Unaffected by error direction: MSE only considers the magnitude of errors and does not take into account the direction of the errors. As a result, a model with both positive and negative errors that cancel each other out could have the same MSE as a model with consistent errors in the same direction.
5. Overemphasis on specific data points: MSE treats all data points equally and does not assign different weights to different observations. This means that the impact of specific data points on the overall metric may be disproportionate, potentially leading to biased evaluations.
6. Inappropriate for classification problems: MSE is primarily suited for regression problems, where the objective is to predict continuous values. It is not suitable for evaluating classification models, as it does not capture the accuracy or precision of class predictions.
Considering these disadvantages, it is crucial to carefully evaluate the appropriateness of using MSE as an evaluation metric in specific scenarios. Fortunately, there are alternative evaluation metrics available that can address some of these limitations.
In the following section, we will discuss when to consider using MSE and explore alternative metrics to supplement or replace MSE in machine learning model evaluation.
When to use MSE
Mean Squared Error (MSE) is a valuable evaluation metric in machine learning, and there are specific scenarios where it is particularly useful:
1. Regression problems: MSE is well-suited for regression tasks, where the focus is on predicting continuous values. It provides a quantitative measure of how well the model’s predictions align with the actual values in the dataset.
2. Importance of large errors: When large errors have a significant impact on the overall performance evaluation, MSE is a suitable choice. For instance, in financial forecasting or scientific experiments, accurately capturing large errors can be crucial.
3. Comparing models: MSE allows for straightforward comparison of multiple models. By calculating the MSE values for different models, you can identify which model performs better in terms of minimizing the average squared difference between predictions and actual values.
4. Optimization with gradient-based algorithms: MSE is a differentiable and smooth objective function, which makes it compatible with optimization algorithms that rely on gradient-based techniques. This makes MSE a preferred choice in model training and optimization pipelines.
5. Availability in libraries: Many popular machine learning libraries and frameworks provide built-in functions for calculating MSE. This availability makes it convenient to use MSE as an evaluation metric within the existing tooling and software ecosystems.
Overall, if your problem involves predicting continuous values, and you want to emphasize the impact of large errors, MSE can be a suitable evaluation metric to consider.
However, it is essential to evaluate the specific characteristics and requirements of your problem before relying solely on MSE. There are alternative metrics available that address some of the limitations of MSE, as discussed in the next section.
Alternatives to MSE
Although Mean Squared Error (MSE) is widely used as an evaluation metric, there are alternative metrics available that can complement or replace MSE based on the specific requirements of your machine learning problem:
1. Mean Absolute Error (MAE): MAE measures the average absolute difference between the predicted and actual values. Unlike MSE, MAE does not square the errors, making it less sensitive to outliers. MAE provides a direct measurement of the average magnitude of errors and is more interpretable than MSE.
2. Root Mean Squared Error (RMSE): RMSE is the square root of MSE and is often used as a more interpretable alternative to MSE. RMSE shares the advantages and drawbacks of MSE but provides results in the same unit as the original target variable, making it easier to relate to the problem domain.
3. R-squared (Coefficient of Determination): R-squared measures the proportion of the variance in the dependent variable that is predictable from the independent variables. It indicates how well the model fits the data and ranges from 0 to 1. A higher R-squared value indicates a better fit, while a low value suggests that the model does not capture the variability in the data adequately.
4. Mean Absolute Percentage Error (MAPE): MAPE calculates the average percentage difference between the predicted and actual values. It is particularly useful when you want to evaluate the performance of a model in terms of relative errors. MAPE provides insight into the average size of the errors relative to the actual values.
5. Cohen’s Kappa: Cohen’s Kappa is a metric commonly used for evaluating the performance of classification models. It measures the agreement between the predicted and actual labels, taking into account the possibility of agreement occurring by chance. Cohen’s Kappa is especially valuable when working with imbalanced datasets.
These alternative metrics offer different perspectives on model performance and cater to specific needs and considerations. Depending on your problem domain and the nature of the predictions you are making, using one or a combination of these metrics can provide a more comprehensive evaluation of your machine learning models.
Now that we have explored alternative metrics, let’s summarize the main points of this article.
Conclusion
Mean Squared Error (MSE) is a fundamental evaluation metric in machine learning that measures the average squared difference between predicted and actual values. It provides a quantitative measure of the performance of regression models and is widely used and understood in the field.
MSE offers advantages such as sensitivity to large errors, compatibility with mathematical properties, and availability in popular libraries. However, it also has limitations, including sensitivity to outliers, lack of interpretability, and an emphasis on larger errors.
Understanding the appropriate use of MSE is crucial. It is well-suited for regression problems and scenarios where large errors must be considered. When interpreting MSE values, it is essential to consider the scale of the target variable and compare results with other models or benchmarks.
Alternative metrics to consider include Mean Absolute Error (MAE), Root Mean Squared Error (RMSE), R-squared, Mean Absolute Percentage Error (MAPE), and Cohen’s Kappa. These metrics provide different perspectives on model performance and can be used to complement or replace MSE based on specific requirements.
Remember, no single evaluation metric is universally applicable. The choice of metric should depend on the nature of the problem, the goals of the project, and the characteristics of the data. It is essential to select the most appropriate metric or combination of metrics to accurately evaluate and compare machine learning models.
By understanding MSE and its alternatives, you are equipped with a better understanding of evaluation metrics in machine learning. This knowledge can help guide you in developing accurate and reliable machine learning models and making informed decisions throughout your data science journey.