Introduction
Running reports in QuickBooks is an essential task for businesses of all sizes. As a powerful accounting software, QuickBooks offers a wide range of reporting options that allow you to gain valuable insights into your financial data. Whether you need to analyze your profit and loss statement, track inventory, monitor expenses, or create custom reports based on specific criteria, QuickBooks has you covered.
In this article, we will guide you through the step-by-step process of running a report in QuickBooks. We will explore the various customization options available, such as selecting the report type, specifying date ranges, applying filters, sorting data, customizing columns, and more. By the end of this article, you will have a clear understanding of how to generate, customize, and export reports in QuickBooks to help you make informed business decisions.
Running reports in QuickBooks is not only a valuable tool for tracking your financial performance, but it can also assist in identifying trends, identifying areas for improvement, and validating your business strategy. With the ability to customize reports to meet your specific needs, you can analyze your data in a way that is meaningful to your business goals.
Before we dive into the details, it’s important to note that QuickBooks offers a wide range of pre-built reports categorized under various sections such as sales, expenses, customers, vendors, and more. These ready-to-use reports provide a great starting point for analyzing your financial data and are easily accessible from the reports menu.
Now, let’s explore how to run a report in QuickBooks and unleash the power of data analysis for your business.
Accessing the Reports Menu
To begin running a report in QuickBooks, you first need to access the Reports menu. Here’s how:
- Launch QuickBooks and log in to your company file.
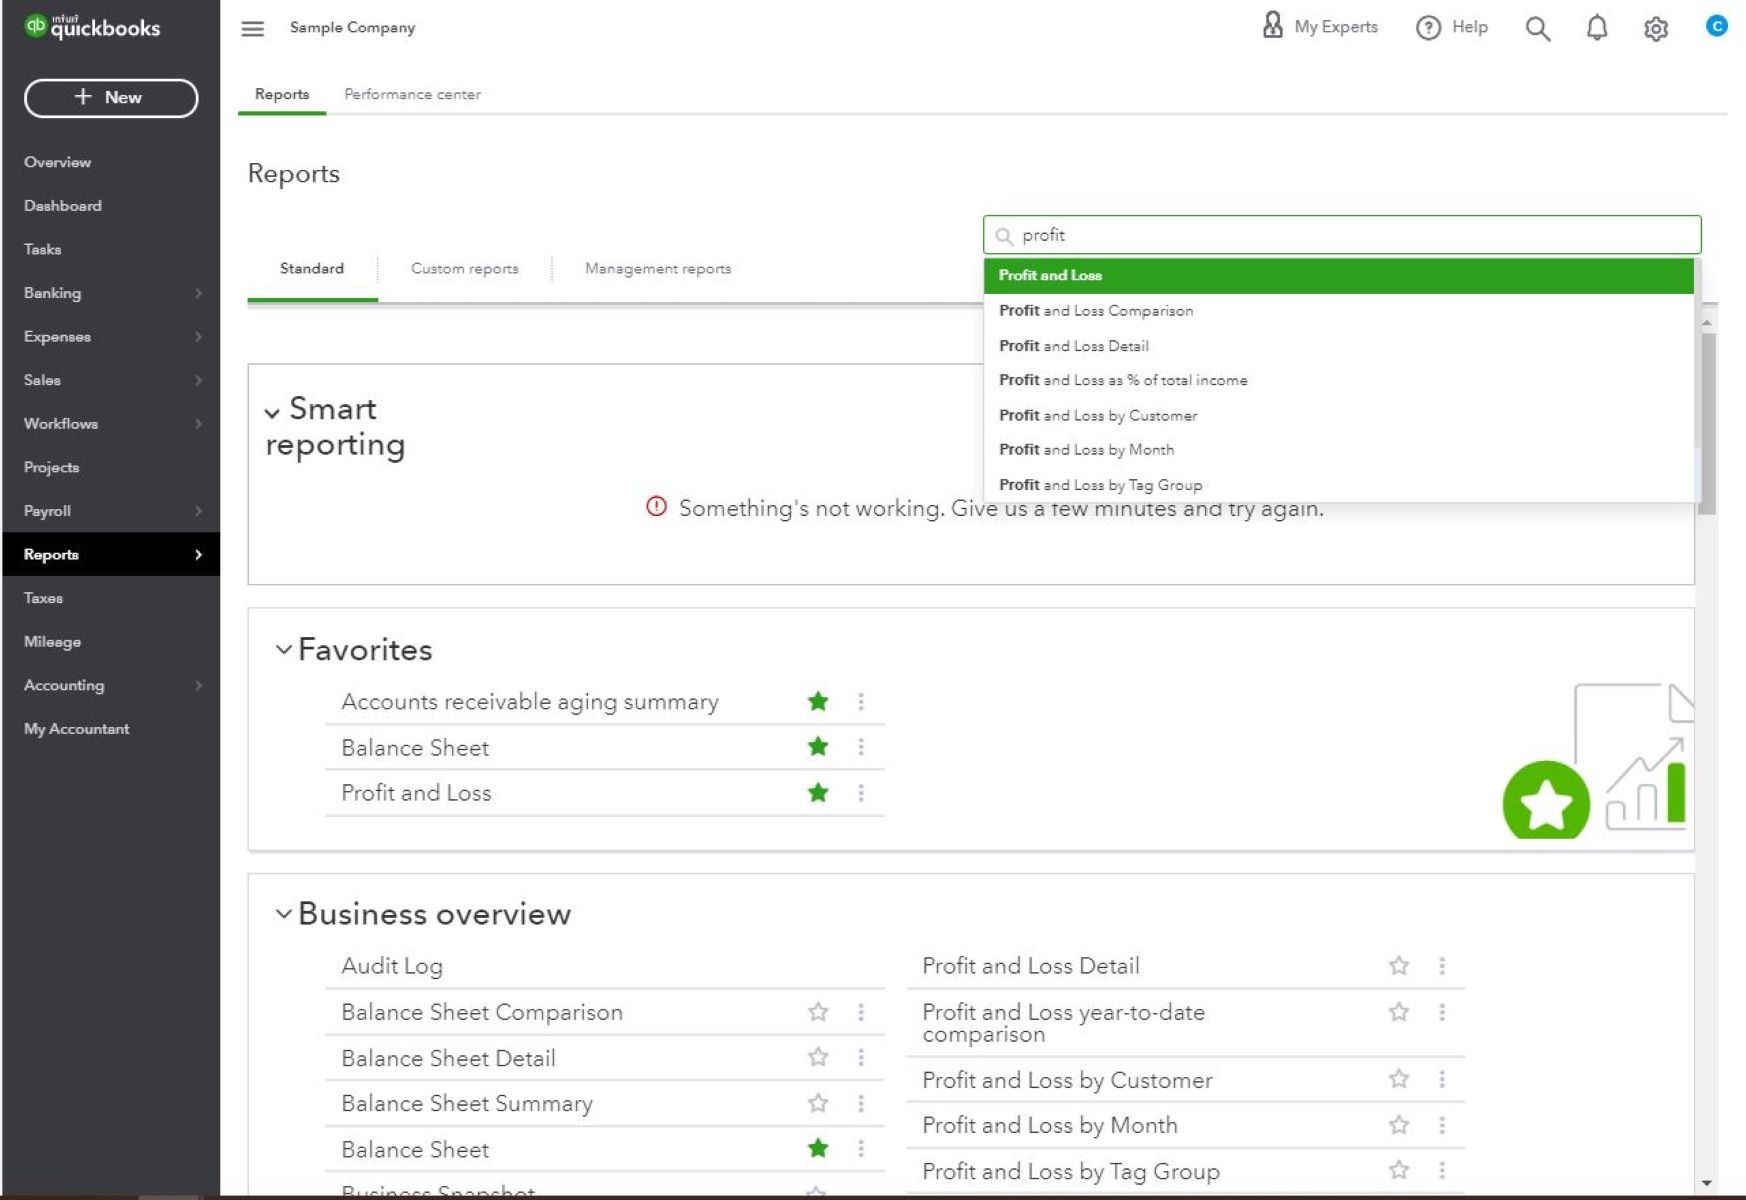
- Once you’re on the homepage, navigate to the top menu and locate the “Reports” tab. Click on it to reveal the drop-down menu.
- You will see a list of report categories such as Sales, Expenses, Customers, Vendors, and more. Click on the category that best matches the report you wish to run.
- A submenu will appear, displaying a list of specific reports within the selected category. Choose the report that fits your needs and click on it.
Alternatively, you can use the search bar located on the top-right corner of the Reports menu to quickly find a specific report. Simply type in the name or keywords related to the report you’re looking for, and QuickBooks will display a list of matching options.
Accessing the Reports menu gives you a wide array of pre-built reports to choose from. These reports are designed to provide insightful and comprehensive information related to different aspects of your business. However, if you require more customized or specific reports, QuickBooks also allows you to create custom reports by selecting the appropriate report templates and adjusting the settings according to your preferences.
Now that you know how to access the Reports menu in QuickBooks, let’s move on to the next section where we will explore the different report types available and how to choose the most relevant one for your needs.
Choosing the Report Type
Once you have accessed the Reports menu in QuickBooks, it’s time to select the most appropriate report type for your needs. QuickBooks offers a wide range of report categories, each containing specific types of reports that cater to different aspects of your business. Here’s how you can choose the right report type:
- Review the available report categories: When you click on the Reports tab, you’ll see a list of categories such as Sales, Expenses, Customers, Vendors, Banking, and more. Take a moment to understand the purpose of each category and identify which one aligns with the information you’re seeking.
- Select the category that matches your needs: Once you have identified the relevant category, click on it to reveal the subcategories and specific reports within it.
- Explore the report options: Within each subcategory, you’ll find different types of reports that provide varying levels of detail and analysis. Take your time to browse through the options and read their descriptions to determine which report is the best fit for your requirements.
- Consider the key metrics and data points: Think about the specific information you need to gather from the report. Consider the key metrics, data points, and filters that are available in each report option. This will help you choose a report that provides the necessary insights.
- Take note of customization options: Some reports offer additional customization options that allow you to tailor the report to your specific needs. These options may include selecting specific date ranges, applying filters, or sorting and grouping data. Consider whether these customization features are important for your analysis.
By carefully considering the available report categories, exploring the report options within each category, and focusing on the key metrics and customization options, you can choose the report type that will provide you with the most relevant and valuable information.
Once you have selected the appropriate report type, it’s time to customize the report settings to refine the data and generate the insights you’re seeking. In the next section, we will delve into the customization options available in QuickBooks reports.
Customizing the Report
After choosing the report type in QuickBooks, you have the option to customize the report settings to tailor the data to your specific requirements. Customizing the report allows you to refine the information presented, apply filters, sort data, and adjust other settings that will provide you with the most valuable insights. Here’s how you can customize a report in QuickBooks:
- Select the customization options: Once you have chosen a report, look for the customization options available. Depending on the report type, you may find options to customize the date range, filter the data, adjust the columns displayed, and more.
- Specify the date range: One of the most common customization options is to select the desired date range for the report. QuickBooks offers predefined options like “Today,” “This Week,” “This Month,” or you can choose a custom range by selecting “Custom.” This allows you to focus on specific time periods for your analysis.
- Apply filters to the data: Filters help narrow down the data based on certain criteria. For example, you can filter the report to show transactions from specific customers, certain expense accounts, or certain products/services. By applying filters, you can create reports that are tailored to your specific needs.
- Sort and group the data: Depending on the report, you may have the option to sort the data by different columns such as date, customer, or amount. You can also group the data based on specific criteria, such as grouping transactions by month or by item. Sorting and grouping the data can provide a clearer picture of the trends and patterns within the report.
- Customize the columns displayed: QuickBooks allows you to customize the columns displayed in the report. You can add or remove columns to focus on the specific data points that are most relevant to your analysis. This flexibility helps create reports that highlight the information you need.
By utilizing the customization options in QuickBooks reports, you can create tailored reports that provide the insights you’re looking for. These options allow you to refine the data, apply filters, sort and group information, and customize the columns displayed. This level of customization ensures that the report presents the most relevant information for your analysis.
Now that you understand how to customize a report in QuickBooks, let’s move on to the next section where we will explore how to select the date range for your report to focus on specific time periods.
Selecting the Date Range
When running a report in QuickBooks, selecting the appropriate date range is crucial to obtaining accurate and relevant data. QuickBooks offers various options for specifying the date range, allowing you to focus on specific time periods for your analysis. Here’s how you can select the date range for your report:
- While customizing the report, look for the date range options. This is usually located in the upper portion of the customization window.
- QuickBooks provides predefined date range options such as “Today,” “This Week,” “This Month,” “This Fiscal Quarter,” “This Fiscal Year,” and more. These options are useful if you want to focus on recent data or specific time periods aligned with your business operations.
- If you need a custom date range, select the “Custom” option. This allows you to specify a start and end date for the report manually.
- When selecting a custom range, be mindful of the timeframe that best reflects the data you want to analyze. For example, if you want to evaluate monthly sales performance, set the start and end dates to cover a specific month or range of months.
- Some reports also offer the option to compare date ranges. This allows you to compare data from different time periods, such as comparing this month’s sales to the same month last year. Utilizing this feature can provide valuable insights into your business’s performance and growth over time.
By selecting the appropriate date range for your report, you can focus on the specific time period that aligns with your analysis goals. Whether you need to evaluate recent performance or compare data over different periods, QuickBooks provides the flexibility to customize the date range accordingly.
Now that you understand how to select the date range for your report, we will move on to the next section where we will explore how to specify filters to narrow down the data presented in the report.
Specifying Filters
When running a report in QuickBooks, specifying filters allows you to narrow down the data presented based on specific criteria. Filters help you focus on the transactions, customers, vendors, or accounts that are most relevant to your analysis. Here’s how you can specify filters to refine the data in your report:
- While customizing the report, look for the filter options. This is usually located in the customization window.
- Click on the filter options to reveal a list of available filter criteria. The available criteria may vary depending on the selected report type.
- Select the filter criteria that you want to apply to your report. For example, if you want to analyze sales from a specific customer, choose the appropriate customer filter and select the desired customer from the list.
- You can apply multiple filters to narrow down the data further. For example, you can filter by transaction type, date, account, class, and other relevant criteria to focus on specific subsets of data.
- If applicable, specify the filter parameters. Depending on the chosen filter criteria, you may need to specify additional parameters such as date ranges or transaction amounts.
Using filters allows you to drill down into specific subsets of data, making your reports more targeted and insightful. Whether you need to analyze transactions from a particular customer, track expenses related to a specific account, or evaluate sales within a specific date range, applying filters helps you focus on the data that matters most to your analysis.
In addition to applying filters, some reports also offer the option to save your customized report settings as a template. This allows you to quickly generate the report with the same filters applied in the future, saving you time and effort.
Now that you understand how to specify filters in QuickBooks reports, let’s move on to the next section where we will explore how to sort and group the data to gain further insights.
Sorting and Grouping Data
In QuickBooks, sorting and grouping the data in your reports allows you to organize and analyze the information in a meaningful way. By specifying how the data is sorted and grouped, you can gain deeper insights and identify trends within your financial data. Here’s how you can sort and group data in QuickBooks:
- While customizing the report, look for the sorting and grouping options. This is typically located in the customization window.
- Click on the sorting and grouping options to reveal a list of available columns that you can use to sort and group the data.
- Select the column you want to sort the data by. This can be a column such as date, customer, vendor, account, item, or any other relevant data point.
- Choose the sort order for the selected column. You can sort in ascending (from smallest to largest) or descending (from largest to smallest) order.
- If you want to group the data, select the column you want to group by. This can be a different column from the one you used for sorting. For example, you can sort the data by date and then group it by customer to see the transactions for each customer within specific time periods.
- Preview the report to ensure that the sorting and grouping settings are applied correctly. Make any necessary adjustments to ensure the data is presented in the desired format.
Sorting and grouping the data in your reports makes it easier to identify patterns, compare information, and analyze trends. Whether you want to see transactions chronologically, group expenses by category, or analyze sales by customer, the sorting and grouping options in QuickBooks help you organize the data for clearer insights.
It’s important to note that not all reports in QuickBooks have sorting and grouping options. The availability of these features depends on the report type you choose. Take advantage of these options when available to make the most of your reports and gain a deeper understanding of your financial data.
Now that you understand how to sort and group data in QuickBooks, let’s move on to the next section where we will explore how to customize the columns displayed in your report.
Customizing the Columns
In QuickBooks, customizing the columns in your report allows you to tailor the information displayed to suit your specific needs. By selecting the columns you want to include or exclude, you can focus on the data points that are most relevant to your analysis. Here’s how you can customize the columns in QuickBooks reports:
- While customizing the report, look for the column customization options. This is typically located in the customization window.
- Click on the column customization options to reveal a list of available columns for the selected report.
- Select the columns you want to include in your report. You can choose from various data points such as date, transaction type, customer, vendor, amount, and more.
- If there are columns you want to exclude, deselect them to remove them from the report.
- Arrange the columns in the desired order by dragging and dropping them within the customization window.
- Preview the report to ensure that the selected columns are displayed correctly. Make any necessary adjustments to ensure the report presents the data in the desired format.
Customizing the columns in your report allows you to focus on the specific information that matters most to your analysis. By including relevant data points and excluding unnecessary ones, you can easily identify trends, compare data, and make informed business decisions.
In addition to customizing the columns, QuickBooks also offers the option to add and remove subtotal rows in certain reports. This allows you to further summarize the data and analyze subtotals based on specific criteria.
Remember that not all reports in QuickBooks offer column customization options. The availability of these features depends on the report type you choose. Take advantage of column customization when available to create reports that highlight the data points that are most meaningful to your analysis.
Now that you know how to customize the columns in QuickBooks reports, let’s move on to the next section where we will explore how to save and memorize reports for future use.
Saving and Memorizing Reports
QuickBooks provides the option to save and memorize reports, allowing you to easily access and reuse them in the future. Saving reports helps you save time by eliminating the need to recreate or re-customize reports each time you need them. Here’s how you can save and memorize reports in QuickBooks:
- Once you have customized a report to your desired settings, navigate to the top menu and click the “Save customization” button. This will open a pop-up window where you can enter a name for the saved report.
- Provide a descriptive name for the report that reflects its purpose or content. This will make it easy for you to identify and locate the report later on.
- Choose the appropriate options for saving the report. QuickBooks allows you to save the report for your personal use only or opt to share it with others who have access to your QuickBooks company file.
- Click “Save” to save the customized report. You can then access it from the Reports menu under the “Saved” section.
- If you frequently use a particular report and want it to automatically update with the latest data, you can memorize the report. To do this, open the saved report from the Reports menu, customize it as needed, and then click the “Memorize” button. Set the frequency and other options to determine how the report updates.
- To access your memorized reports, go to the Reports menu and select the “Memorized Reports” section. You will find a list of all your memorized reports.
By saving and memorizing reports in QuickBooks, you can easily access and reuse them whenever you need to analyze the same data or share specific reports with others. This feature saves you time and ensures consistency in your reporting process.
Remember to regularly review your saved and memorized reports to ensure they remain relevant to your changing business needs. If necessary, update the settings, filters, or columns to reflect any changes in your reporting requirements.
With the ability to save and memorize reports in QuickBooks, you can streamline your reporting process and focus on analyzing the data that matters most to your business.
Now that you know how to save and memorize reports, let’s move on to the final section where we will explore how to export and print reports in QuickBooks.
Exporting and Printing Reports
In QuickBooks, you have the option to export and print reports so that you can share or archive them outside of the software. Exporting reports allows you to save them in various file formats, while printing reports provides you with physical copies that can be easily referenced or shared with others. Here’s how you can export and print reports in QuickBooks:
- Once you have generated and customized a report, navigate to the top menu and locate the “Export” button. Click on it to reveal a drop-down menu with export options.
- Select the desired export format from the available options, such as PDF, Excel, or CSV. Choose the format that best suits your needs or the format required by the recipient of the report.
- After selecting the export format, QuickBooks will generate and download the report file. The file will be saved to your computer or device based on your browser settings.
- You can now access the exported report file on your computer or device. Open it using the appropriate software or application to view, edit, or share the report as needed.
- If you prefer to have a physical copy of the report, you can print it directly from QuickBooks. Click on the “Print” button, which is typically located near the export button in the top menu.
- QuickBooks will open a print preview window, allowing you to review the report layout before printing. Adjust any necessary settings, such as the number of copies or the printer selection.
- Once you’re satisfied with the print preview, click the “Print” button to initiate the printing process. Ensure that your printer is properly connected and paper is loaded.
Exporting and printing reports in QuickBooks provides you with the flexibility to save, share, and analyze your financial data in the format that works best for you and your business needs.
When exporting reports, it’s important to choose the appropriate format based on how you intend to use the report. For example, if you need to share the report electronically, PDF or Excel formats may be more suitable. On the other hand, if you need to import the report data into another software or system, a CSV format could be more compatible.
Printing reports allows you to have physical copies that can be easily referenced or shared offline. This can be particularly useful for meetings, presentations, or when hard copies are required for record-keeping purposes.
Now that you know how to export and print reports in QuickBooks, you have the tools to conveniently share, analyze, and archive your financial data.
Conclusion
Running reports in QuickBooks is a powerful tool for gaining insights into your business’s financial performance. From analyzing sales and expenses to tracking inventory and monitoring customer behavior, QuickBooks offers a wide range of pre-built reports and customization options to cater to your specific needs.
In this article, we explored the step-by-step process of running reports in QuickBooks, starting from accessing the Reports menu and choosing the appropriate report type. We discussed the importance of customizing reports by selecting the date range, specifying filters, sorting and grouping data, and customizing the columns displayed. We also learned how to save and memorize reports for future use, as well as how to export and print them for sharing or archiving purposes.
By following these techniques, you can generate reports that provide valuable insights into your business operations, financial health, and growth opportunities. Reports in QuickBooks allow you to make data-driven decisions, identify areas for improvement, and monitor your progress towards your goals.
Remember to regularly review and update your reports to ensure they remain relevant and aligned with your changing business needs. As your business evolves, your reporting requirements might change as well, and QuickBooks offers the flexibility to adapt to those changes.
Make the most of QuickBooks’ reporting capabilities and take advantage of the extensive customization options available. By leveraging the power of data analysis, you can optimize your business processes, identify opportunities for growth, and make informed decisions that drive your business forward.
Now, armed with the knowledge of running reports in QuickBooks, it’s time to dive in and explore the valuable insights waiting to be discovered within your financial data.