Introduction
Welcome to our guide on how to create a dynamic scaling graph in PHP. Graphs are a powerful tool for visualizing data, and they can be incredibly useful in various applications. Whether you want to display sales trends, analyze website traffic, or showcase any other data-driven insights, being able to create graphs dynamically using PHP can be a valuable skill.
A graph, in the context of data visualization, is a visual representation of data points or values. It consists of two primary axes, typically known as the x-axis and y-axis, that represent different variables or categories. Each data point is then plotted on the graph, enabling viewers to observe patterns, trends, or relationships between variables.
So why would you want to create a graph in PHP? PHP is a versatile and widely-used programming language that is particularly well-suited for web development. By leveraging PHP, you can dynamically generate graphs based on real-time or user-specific data, providing a more interactive and personalized experience for your users.
In this tutorial, we will walk you through the process of setting up your environment for graph creation, generating the necessary data for the graph, building the graph using PHP, and adding dynamic scaling features to enhance its functionality.
To get started, please ensure that you have a working knowledge of PHP and HTML, as well as a development environment set up on your computer. This could be a local server or an online hosting platform. We recommend using a text editor such as Sublime Text, Notepad++, or Visual Studio Code to write and edit your code.
Now, let’s dive into the steps required to create a dynamic scaling graph in PHP. By the end of this tutorial, you’ll have the skills to generate visually appealing and interactive graphs that can display your data in an insightful and engaging way.
What is a graph?
A graph is a powerful visual representation of data that allows us to understand complex relationships, trends, and patterns. It is an essential tool in data analysis and communication, providing a clear and concise way to present information.
In the context of data visualization, a graph consists of two main components: nodes (also known as vertices) and edges. Nodes represent individual data points or entities, while edges represent the connections or relationships between the nodes.
There are several types of graphs, each with its unique characteristics and use cases. The most common types include:
- Bar Graphs: Bar graphs display data using rectangular bars of different lengths. They are commonly used to compare and contrast data categories.
- Line Graphs: Line graphs use points connected by lines to show the change or trends in data over time. They are ideal for illustrating continuous data.
- Pie Charts: Pie charts divide data into sectors of a circle, representing the proportion of each category. They are effective for showing percentages or proportions.
- Scatter Plots: Scatter plots plot individual data points on a Cartesian coordinate system. They are used to identify relationships or correlations between variables.
- Area Charts: Area charts display data on a two-dimensional plot, with the area between the line and the x-axis filled. They are suitable for portraying data over time.
Graphs can be created and manipulated using various programming languages and libraries. In this tutorial, we will focus on creating graphs using PHP. PHP provides a versatile and powerful platform for dynamically generating graphs, allowing you to customize and adapt them to your specific needs.
Graphs offer several benefits in data analysis. They make it easier to identify trends, outliers, and patterns in data. By visualizing data with graphs, you can communicate complex information in a more accessible and engaging way, enabling better decision-making and understanding of the data.
Now that we have a clear understanding of what a graph is and its importance in data visualization, let’s move on to setting up our PHP environment and start creating our own dynamic scaling graphs.
Why create a graph in PHP?
PHP is a versatile and popular programming language, well-suited for web development. Creating dynamic graphs in PHP can bring numerous benefits to your application and data visualization process.
Here are some compelling reasons why you should consider creating graphs using PHP:
- Real-time data representation: PHP allows you to fetch data from databases, APIs, or other sources and dynamically generate graphs based on that data. This means you can provide real-time updates and visualizations to your users, making your application more engaging and informative.
- Customizability: With PHP, you have full control over the design and styling of your graphs. You can customize the colors, fonts, labels, and other visual elements to match your application’s branding or design guidelines.
- Interactivity: PHP enables you to create interactive graphs that respond to user input or interactions. You can implement features such as zooming, filtering, and tooltip displays, allowing users to explore and analyze the data in a more dynamic and intuitive way.
- Data-driven insights: By creating graphs in PHP, you can visually represent complex data sets and uncover valuable insights. Graphs can reveal trends, correlations, and outliers that might not be immediately apparent from raw data. These insights can aid in decision-making, planning, and problem-solving processes.
- User engagement: Graphs have a natural visual appeal and are easier to comprehend than raw data. By presenting data in a graphical format, you can capture and maintain your users’ attention, enhancing their overall experience and understanding of the information being conveyed.
- Compatibility: PHP is compatible with various industry-standard graphing libraries and frameworks, such as Chart.js, D3.js, and Google Charts. These libraries provide a wide range of graph types and features, making it easier to create sophisticated and visually appealing graphs without starting from scratch.
Whether you are developing a dashboard, analytics tool, or any application that requires data visualization, incorporating dynamic graphs using PHP can significantly enhance the user experience, improve data comprehension, and provide valuable insights.
Now that we understand the advantages of creating graphs in PHP, let’s move on to setting up our development environment and start building our own dynamic scaling graph.
Setting up the environment
Before we can start creating dynamic scaling graphs in PHP, we need to set up our development environment. Here are the steps to get started:
- Install PHP: If you don’t have PHP installed on your computer, you’ll need to download and install it. PHP is available for various operating systems, including Windows, macOS, and Linux. Visit the official PHP website (php.net) to download the latest version and follow the installation instructions specific to your operating system.
- Text Editor or Integrated Development Environment (IDE): Choose a text editor or IDE that suits your preferences for coding. Popular options include Sublime Text, Atom, Visual Studio Code, or PHP-focused IDEs like PhpStorm and NetBeans. Install your preferred text editor or IDE on your computer.
- Web Server: To run PHP code, you’ll need a web server. You can either install a local development server like XAMPP or WAMP, which includes Apache, MySQL, and PHP, or use a virtual machine like Vagrant or a cloud-based solution like AWS or DigitalOcean. Configure your web server to use PHP.
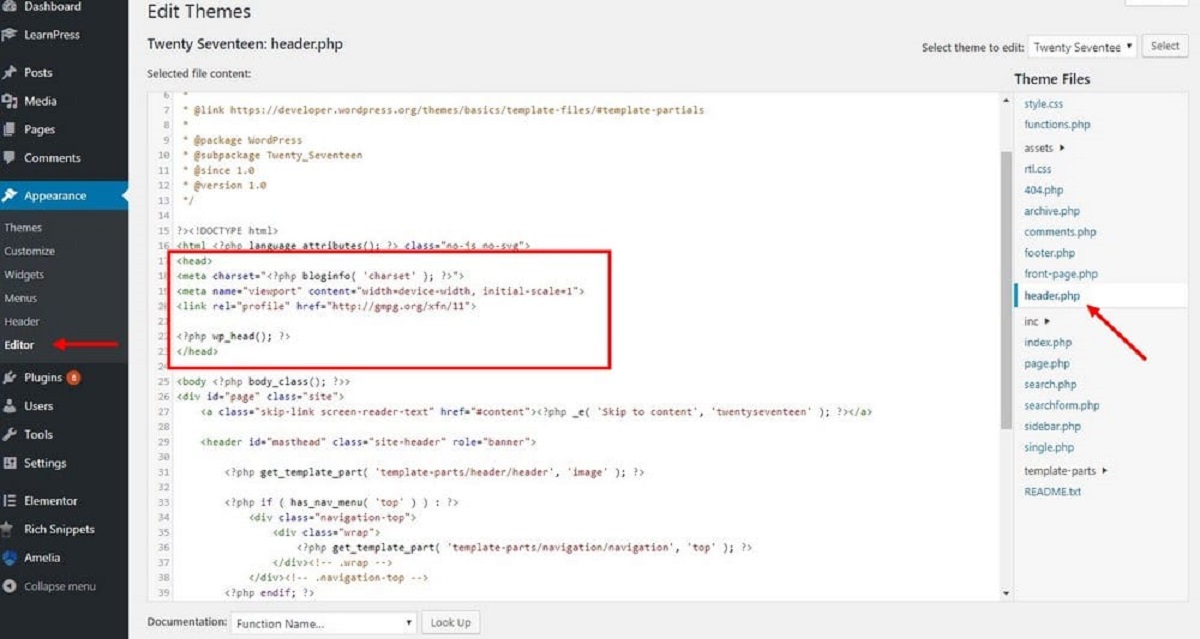
- Create a PHP file: Create a new file with a “.php” extension in your text editor or IDE. This file will contain the PHP code for generating the graph.
Once you have set up your development environment, you are ready to start creating dynamic scaling graphs using PHP. In the next section, we will cover how to generate the data required for the graph.
Remember to save your PHP file in the appropriate directory for your web server to access it. Test the setup by running a simple PHP script that outputs “Hello, World!” to ensure that PHP is functioning correctly on your server.
Throughout this tutorial, we will be using PHP and HTML to create our dynamic scaling graph. Basic knowledge of both PHP and HTML is expected. Understanding concepts like variables, loops, arrays, and HTML tags will be helpful as we dive into graph creation using PHP.
Now that we have our environment configured, let’s move on to generating the data that will be used to build our dynamic scaling graph.
Creating the data for the graph
Before we can build our dynamic scaling graph in PHP, we need to generate the data that will be plotted on the graph. The data you choose to represent will depend on your specific application or use case. Here’s how you can create the necessary data for the graph:
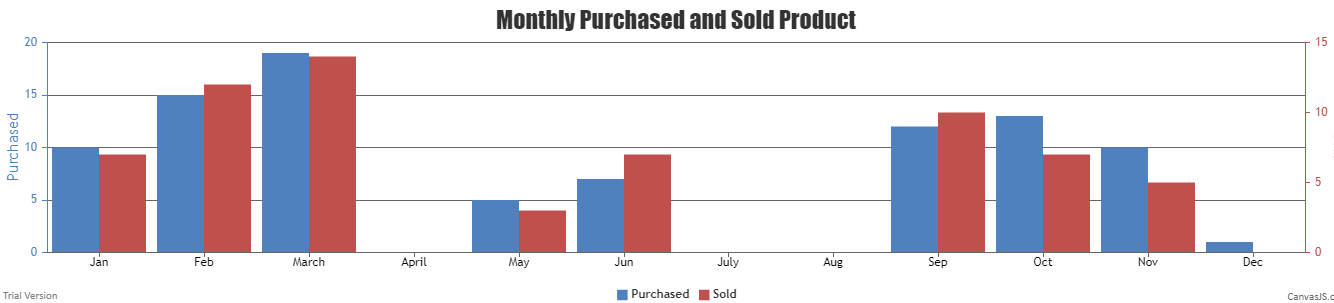
- Identify the variables: Determine the variables that you want to represent on the graph. For example, if you are plotting sales data over a period of time, your variables might include time intervals (such as days, weeks, or months) on the x-axis and sales figures on the y-axis.
- Collect and format the data: Gather the raw data that corresponds to the chosen variables. Depending on your data source, this could involve querying a database, parsing a CSV file, or making API requests. Ensure that the data is properly formatted and organized.
- Organize the data: Arrange the data into arrays or objects that can be easily handled and manipulated in PHP. For example, you might create an array with timestamps for the x-axis and an array with corresponding sales values for the y-axis. Make sure the data is in the correct order and matches the intended graph representation.
- Clean and validate the data: It’s important to clean and validate the data to ensure its accuracy and consistency. Remove any duplicate or irrelevant data points, handle missing values appropriately, and validate the data against any predetermined criteria or boundaries.
Once you have created and organized the data, you are ready to move on to building the graph using PHP. In the next section, we will explore how to utilize PHP to generate the graphical representation of the data.
Remember that the specific steps and techniques for creating the data may vary depending on the nature of your application and the data source you are working with. Take some time to preprocess and prepare your data before moving forward.
Now that we have the necessary data for our graph, let’s dive into building the graph using PHP in the next section.
Building the graph using PHP
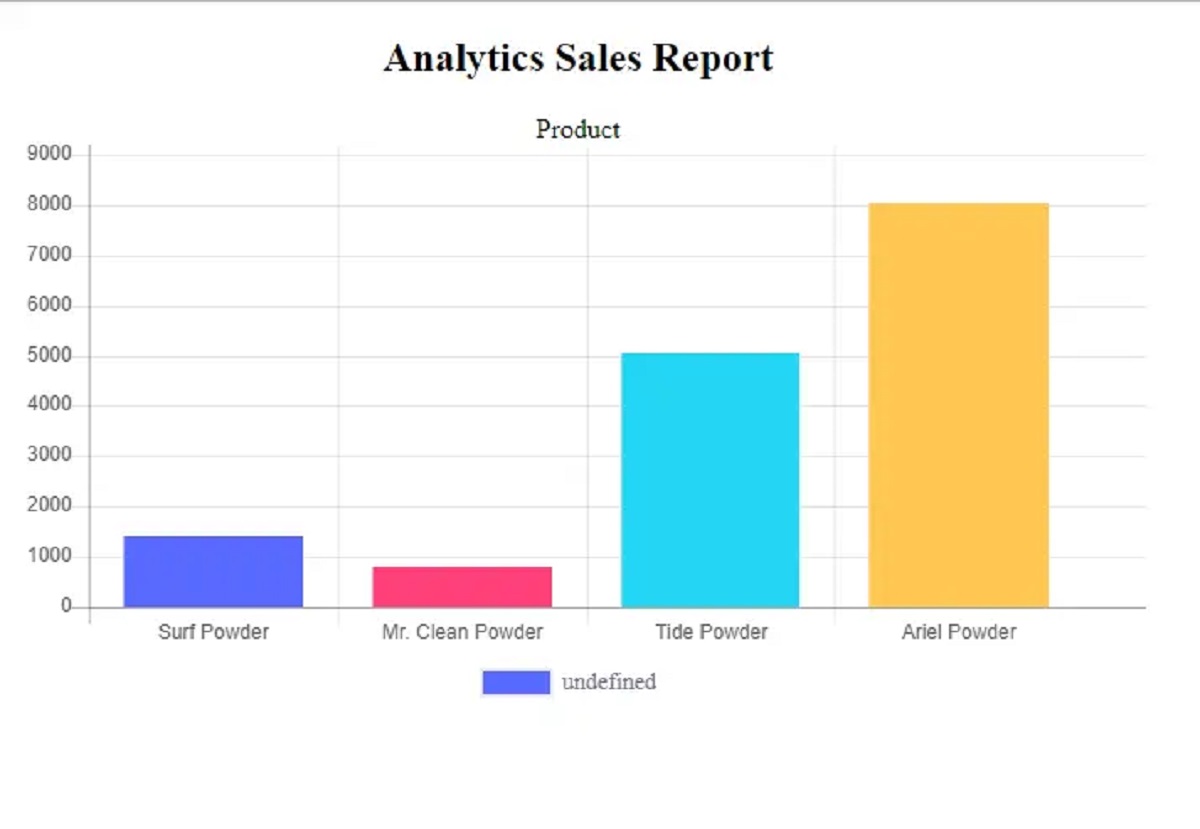
Now that we have the data ready for our graph, it’s time to build the actual graph using PHP. There are several PHP libraries and frameworks available that can assist in creating graphs, such as Chart.js, D3.js, and Google Charts. In this tutorial, we will focus on using Chart.js, a popular and easy-to-use JavaScript library for creating interactive and responsive charts.
Here are the steps to build the graph using PHP:
- Include the Chart.js library: Download the Chart.js library from the official website (chartjs.org) and include it in your project. You can either link to the hosted Chart.js file using a script tag or download the library and save it locally.
- Create a canvas element: In your PHP file, create a canvas element. This element will serve as the container for the chart.
- Write PHP code: Write PHP code to generate the JavaScript code that will create the chart. This code will dynamically generate the necessary labels, datasets, and options based on the data you have prepared.
- Generate the chart: Use the generated JavaScript code to create the chart using Chart.js. You can access the canvas element using its ID or any other targeting method and pass in the appropriate data and options.
- Render the chart: Finally, render the chart on the webpage by loading the PHP file containing the JavaScript code. Make sure to properly link the necessary assets, such as the Chart.js library and any CSS files required for styling.
By following these steps, you will be able to dynamically generate a graph using PHP and visualize your data in a graphical format. Remember to customize the chart’s appearance, labels, colors, and other options to suit your specific requirements and design preferences.
It’s worth noting that the exact implementation details may vary depending on the specific graph library or framework you choose to work with. Familiarize yourself with the documentation and resources provided by your chosen library to ensure a smooth implementation.
Now that we have learned how to build the basic structure of a graph using PHP, let’s explore how to add dynamic scaling to the graph in the next section.
Adding dynamic scaling to the graph
Dynamic scaling is an important feature that allows graph axes to adjust based on the values of the data being displayed. This ensures that the graph remains visually appealing and readable, even when the data ranges change dynamically. By adding dynamic scaling to your PHP-generated graph, you can provide a more user-friendly and informative experience. Here’s how to implement dynamic scaling:
- Analyze the data: Begin by analyzing the data you have and determining the range and scale for each axis. Identify the minimum and maximum values of your data points for both the x-axis and y-axis.
- Calculate the axis limits: Use PHP to calculate the axis limits dynamically based on the data. Determine suitable increments and intervals to divide the axes and ensure that the graph effectively represents the data. You can employ mathematical functions and operations to calculate these limits.
- Update the graph options: Modify the options of your graph in PHP to incorporate the calculated axis limits. This may involve updating properties such as the scale’s minimum and maximum values, tick settings, and label formatting to reflect the dynamic scaling requirements.
- Rebuild and render the graph: Update the JavaScript code that generates the chart with the newly adjusted options, taking into account the dynamic scaling changes. Rebuild the chart using the updated data and options, and render it on the webpage as before.
By incorporating dynamic scaling into your PHP-generated graph, you ensure that the chart adjusts intelligently as the data changes over time. This allows the graph to maintain readability and visual appeal, regardless of the data range or fluctuations.
Keep in mind that the process of implementing dynamic scaling may differ depending on the graphing library or framework you are using. Consult the library’s documentation or resources to understand how to update the graph options and redraw the chart with the new dynamic scaling settings.
Now that you have learned how to add dynamic scaling to your PHP-generated graph, you have the tools to create visually appealing and data-driven graphs that adapt dynamically to changing data ranges.
Conclusion
In this guide, we have explored how to create a dynamic scaling graph in PHP. We learned about the importance of graphs in visualizing data and how PHP can serve as a powerful tool for generating interactive and personalized graphs.
We started by understanding the concept of graphs and the different types commonly used in data visualization. We then delved into why creating graphs in PHP is advantageous, such as real-time data representation, customizability, interactivity, data-driven insights, and increased user engagement.
Next, we discussed the process of setting up the development environment, which involves installing PHP, choosing a text editor or IDE, and configuring a web server. We also touched upon creating a PHP file and verifying PHP functionality through a “Hello, World!” script.
Subsequently, we explored the steps to generate the necessary data for the graph, including identifying variables, collecting and formatting data, organizing the data, and cleaning and validating it. Properly preparing the data ensures accuracy and consistency in the resulting graph.
We then moved on to building the graph using PHP, focusing on using the Chart.js library. The steps involved including the library, creating a canvas element as the chart’s container, writing PHP code to generate JavaScript code, and finally rendering the chart on the webpage.
Lastly, we discussed the importance of dynamic scaling in graphs and provided guidance on implementing this feature in PHP. By analyzing the data, calculating axis limits, updating the graph options, and rebuilding and rendering the graph, we can create dynamically adaptive graphs that remain visually pleasing and informative.
By following this guide, you now have the knowledge and skills to create dynamic scaling graphs in PHP. Whether you are building a data analytics dashboard, sales reporting tool, or any application requiring data visualization, incorporating dynamic scaling graphs can greatly enhance user experience, improve data comprehension, and provide valuable insights.
Remember to continually explore new graphing libraries, frameworks, and techniques to expand your capabilities in creating visually compelling and informative graphs using PHP. Happy graphing!