Introduction
Debugging JavaScript is an essential skill for web developers, as it allows them to identify and fix issues in their code. Fortunately, modern web browsers come equipped with powerful developer tools that make the debugging process more efficient and effective. In this article, we will explore how to debug JavaScript in Firefox using its robust set of developer tools.
Firefox Developer Tools provide a comprehensive suite of features designed to streamline the debugging process. Whether you're a seasoned developer or just starting out, understanding how to leverage these tools can significantly enhance your productivity and proficiency in JavaScript debugging.
By familiarizing yourself with the Firefox Developer Tools, you can gain insights into your code's behavior, identify errors, and optimize performance. This article will guide you through the various functionalities of the Firefox Developer Tools, empowering you to debug JavaScript with confidence and precision.
Let's delve into the intricacies of using Firefox Developer Tools to debug JavaScript, from setting breakpoints and inspecting variables to utilizing the console and monitoring network activity. Whether you're troubleshooting errors or fine-tuning your code, these tools offer a wealth of capabilities to streamline the debugging process and elevate your development workflow.
Using the Firefox Developer Tools
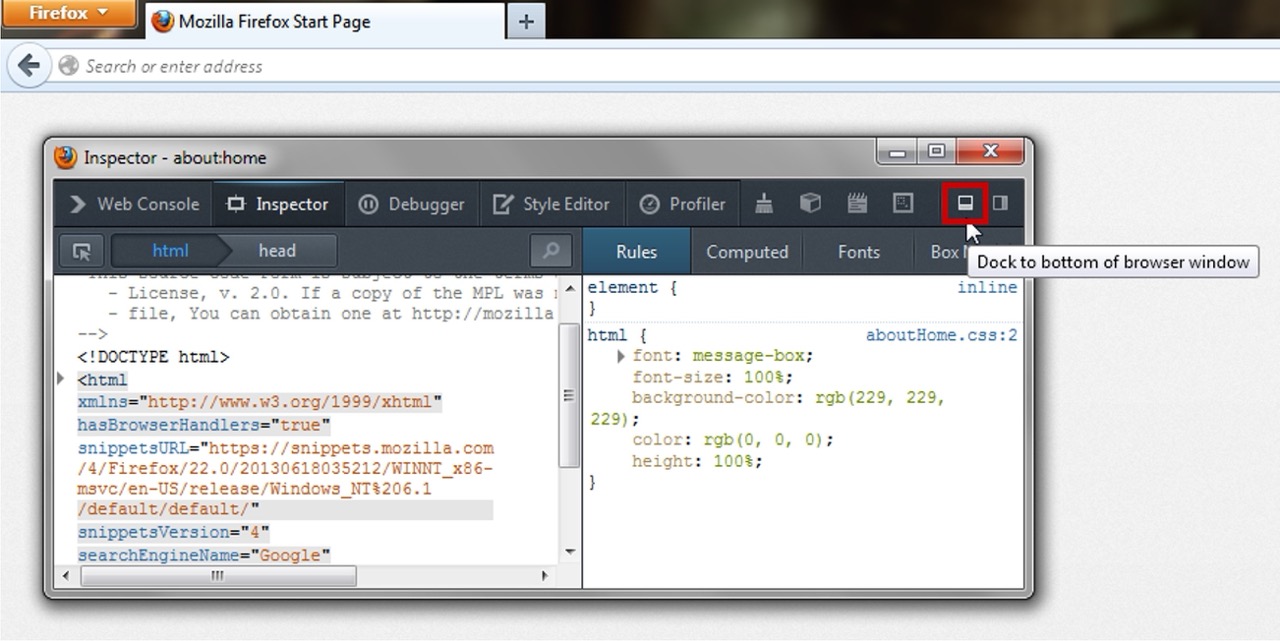
The Firefox Developer Tools encompass a diverse array of functionalities tailored to facilitate seamless JavaScript debugging. Accessing these tools is straightforward: simply right-click on a web page, select "Inspect Element," and navigate to the "Debugger" tab. This grants you access to a suite of features designed to streamline the debugging process and empower developers to gain comprehensive insights into their JavaScript code.
One of the standout features of the Firefox Developer Tools is the intuitive user interface, which provides a user-friendly environment for debugging JavaScript. The interface is thoughtfully designed, offering a cohesive layout that enables developers to navigate through different panels with ease. This ensures that developers can efficiently access and utilize the various debugging features without unnecessary complexity.
The debugger interface provides a clear overview of the JavaScript code, allowing developers to set breakpoints, inspect variables, and monitor code execution. This level of visibility into the code's behavior is invaluable for identifying and resolving issues efficiently. Additionally, the interface offers seamless integration with other developer tools, enabling developers to switch between panels and leverage complementary features to gain a holistic understanding of their codebase.
Furthermore, the Firefox Developer Tools offer robust support for source maps, enabling developers to debug minified or transpiled JavaScript code with ease. This feature is particularly beneficial for debugging complex web applications, as it allows developers to trace issues back to the original source code, even when it has undergone extensive transformations.
In addition to its debugging capabilities, the Firefox Developer Tools provide comprehensive documentation and resources, empowering developers to leverage the full potential of the tools. This includes detailed guides, tutorials, and interactive demos that facilitate a deeper understanding of the debugging process and the various features available within the developer tools.
Overall, the Firefox Developer Tools stand as a testament to Mozilla's commitment to empowering developers with robust, user-friendly debugging capabilities. By providing a seamless and comprehensive environment for JavaScript debugging, these tools play a pivotal role in enhancing the efficiency and effectiveness of the development workflow, ultimately contributing to the creation of more robust and reliable web applications.
Setting Breakpoints
Setting breakpoints is a fundamental aspect of JavaScript debugging, and the Firefox Developer Tools offer a seamless and intuitive approach to this critical process. By strategically placing breakpoints within your code, you can pause its execution at specific points, allowing you to inspect the state of variables, track the flow of execution, and identify potential issues.
To set a breakpoint in Firefox Developer Tools, simply navigate to the "Debugger" tab and locate the line of code where you want to pause execution. Click on the line number to set a breakpoint, indicated by a blue marker. Once the breakpoint is set, the code will pause its execution when it reaches that specific line, providing you with an opportunity to analyze the code's behavior and pinpoint any anomalies.
Moreover, Firefox Developer Tools offer the flexibility to set conditional breakpoints, which further enhances the precision of the debugging process. Conditional breakpoints allow you to specify a condition that triggers the pause in code execution, enabling you to halt the program flow only when certain criteria are met. This advanced feature is particularly valuable when debugging complex logic or iterating through loops, as it empowers you to focus on specific scenarios that require closer scrutiny.
In addition to line-based breakpoints, Firefox Developer Tools support the setting of DOM breakpoints, enabling you to pause code execution when specific DOM events occur. This functionality is instrumental in debugging event-driven JavaScript code, as it grants you the ability to intercept and analyze the handling of DOM events, providing crucial insights into the interaction between your code and the web page's elements.
Furthermore, the Firefox Developer Tools offer a seamless experience for managing breakpoints, allowing you to enable, disable, and remove breakpoints with ease. This level of control ensures that you can adapt the debugging process to suit your specific needs, enabling you to fine-tune the breakpoints based on the evolving requirements of your debugging session.
By leveraging the powerful breakpoint capabilities of the Firefox Developer Tools, developers can gain a comprehensive understanding of their JavaScript code's behavior, identify potential issues, and streamline the debugging process with precision and efficiency. Whether you're troubleshooting complex logic, analyzing event-driven interactions, or tracking the flow of execution, setting breakpoints in Firefox Developer Tools empowers you to debug JavaScript code with confidence and clarity.
Inspecting Variables
Inspecting variables is a crucial aspect of JavaScript debugging, as it allows developers to gain valuable insights into the state of their code at specific points during execution. The Firefox Developer Tools provide a comprehensive set of features for inspecting variables, empowering developers to analyze and understand the values held by different variables within their JavaScript code.
When debugging JavaScript in Firefox, the "Debugger" tab within the Developer Tools offers a dedicated interface for inspecting variables. Upon pausing the code execution at a breakpoint, developers can navigate to the "Scope" panel, which provides a detailed overview of the variables within the current execution context. This panel presents a clear and organized display of local, closure, and global variables, enabling developers to examine their values and understand how they contribute to the code's behavior.
Furthermore, the Firefox Developer Tools offer seamless integration with the source code, allowing developers to hover over variables within the code to view their current values. This interactive feature provides a convenient way to inspect variables directly within the context of the code, facilitating a deeper understanding of how the variables are utilized and manipulated throughout the execution flow.
In addition to viewing variable values, the Firefox Developer Tools enable developers to modify variable values during debugging sessions. This dynamic capability empowers developers to experiment with different values, test alternative scenarios, and observe the impact on code behavior in real-time. By offering the flexibility to modify variable values, the Firefox Developer Tools facilitate an interactive and iterative approach to debugging, empowering developers to fine-tune their code with precision.
Moreover, the "Watch" panel within the Firefox Developer Tools allows developers to specify specific variables they want to monitor continuously. By adding variables to the watch list, developers can keep a close eye on their values as the code execution progresses, gaining valuable insights into how the variables evolve and influence the overall behavior of the code.
By leveraging the robust capabilities of the Firefox Developer Tools for inspecting variables, developers can gain a comprehensive understanding of their JavaScript code's internal state. Whether analyzing the values of local variables, examining the impact of global variables, or monitoring the evolution of closure variables, the ability to inspect variables with precision and depth empowers developers to debug JavaScript code with clarity and confidence.
Using the Console
The console is a versatile and indispensable tool within the Firefox Developer Tools, offering a wealth of capabilities that empower developers to interact with and debug JavaScript code efficiently. As a fundamental component of the developer toolkit, the console provides a dynamic environment for executing JavaScript expressions, logging messages, and diagnosing issues within the codebase.
One of the primary functions of the console is to facilitate the execution of JavaScript expressions in real-time. By entering JavaScript expressions directly into the console, developers can instantly evaluate their code, test hypotheses, and experiment with different logic without the need to modify the source code. This interactive capability enables developers to gain immediate insights into the behavior of their code, empowering them to iterate and refine their JavaScript logic with precision.
Furthermore, the console serves as a powerful platform for logging messages, errors, and warnings generated during code execution. Developers can leverage console.log() to output custom messages, variable values, and diagnostic information, providing a comprehensive view of the code's internal state. Additionally, the console offers support for console.error() and console.warn(), enabling developers to highlight and address critical issues and potential pitfalls within their JavaScript code.
In addition to logging messages, the console provides seamless integration with the debugger, allowing developers to interact with breakpoints and step through code execution directly from the console interface. This level of integration streamlines the debugging process, enabling developers to navigate through the code, inspect variables, and analyze the flow of execution with ease, all within the context of the console environment.
Moreover, the console offers advanced features such as autocomplete and syntax highlighting, enhancing the developer experience and facilitating efficient interaction with JavaScript code. These features contribute to a seamless and intuitive workflow, enabling developers to write, test, and execute JavaScript expressions with clarity and precision.
By leveraging the multifaceted capabilities of the console within the Firefox Developer Tools, developers can streamline the debugging process, gain valuable insights into their JavaScript code, and interact with their codebase in a dynamic and iterative manner. Whether evaluating expressions, logging diagnostic information, or integrating with the debugger, the console stands as a cornerstone of JavaScript debugging, empowering developers to optimize their code with confidence and efficiency.
Network Monitoring
Network monitoring is a pivotal aspect of JavaScript debugging, providing developers with invaluable insights into the interactions between their code and the network resources it relies upon. The Firefox Developer Tools offer a robust suite of features for network monitoring, empowering developers to analyze network requests, track resource loading times, and diagnose potential performance bottlenecks within their web applications.
When leveraging network monitoring in Firefox Developer Tools, developers gain access to a comprehensive overview of network activity, including HTTP requests, responses, and associated timing metrics. The "Network" panel within the Developer Tools presents a detailed log of network requests initiated by the web page, enabling developers to scrutinize the sequence of requests, their respective payloads, and the overall impact on page loading and rendering.
One of the standout features of network monitoring in Firefox Developer Tools is the ability to inspect individual network requests, providing developers with a granular view of request and response headers, parameters, and payload data. This level of detail empowers developers to diagnose issues related to network communication, identify potential errors, and optimize the efficiency of data exchange between the web application and external resources.
Furthermore, the network monitoring capabilities of Firefox Developer Tools extend to performance analysis, offering insights into resource loading times, caching behavior, and overall page loading performance. By examining the timing metrics associated with network requests, developers can pinpoint potential bottlenecks, optimize resource loading strategies, and enhance the overall responsiveness of their web applications.
In addition to request-level analysis, the network panel in Firefox Developer Tools provides support for filtering and sorting network requests based on various criteria, such as request type, domain, and response status. This functionality enables developers to focus on specific subsets of network activity, facilitating targeted analysis and troubleshooting of network-related issues within their web applications.
Moreover, the network panel offers seamless integration with other developer tools, allowing developers to correlate network activity with JavaScript execution, rendering performance, and overall page behavior. This holistic approach to debugging empowers developers to gain a comprehensive understanding of the interplay between network activity and code execution, facilitating the identification and resolution of complex issues that span multiple layers of the web application.
By harnessing the powerful network monitoring capabilities of Firefox Developer Tools, developers can optimize the performance, reliability, and responsiveness of their web applications. Whether diagnosing network-related errors, optimizing resource loading, or analyzing page loading performance, network monitoring stands as a cornerstone of JavaScript debugging, empowering developers to create web applications that deliver a seamless and efficient user experience.
Debugging Errors and Exceptions
Debugging errors and exceptions is a critical aspect of JavaScript development, as it enables developers to identify, diagnose, and resolve issues that may impede the functionality and performance of their web applications. The Firefox Developer Tools offer a comprehensive suite of features tailored to streamline the process of debugging errors and exceptions, empowering developers to gain insights into the root causes of issues and implement targeted solutions with precision.
When encountering errors and exceptions within JavaScript code, the Firefox Developer Tools provide a robust set of capabilities for capturing and analyzing runtime errors. The "Console" panel within the Developer Tools serves as a central hub for logging error messages, warnings, and exceptions, enabling developers to gain visibility into the specific nature of encountered issues. By leveraging console.error() and console.warn(), developers can pinpoint the exact location and context of errors, facilitating a focused approach to debugging and resolution.
Furthermore, the Firefox Developer Tools offer seamless integration with the debugger, enabling developers to navigate through the code execution flow when errors and exceptions occur. By setting breakpoints at critical junctures within the code, developers can pause execution at the precise moment when errors manifest, allowing for in-depth inspection of variable states, function calls, and stack traces. This level of visibility into the runtime behavior of the code empowers developers to trace the origins of errors and exceptions, facilitating a systematic approach to debugging and resolution.
In addition to runtime error capture and analysis, the Firefox Developer Tools provide support for handling JavaScript exceptions. When an exception is thrown within the code, developers can leverage the "Debugger" panel to pause execution and inspect the call stack, enabling them to trace the sequence of function calls leading up to the exception. This granular view of the code's execution path empowers developers to understand the context in which exceptions arise, facilitating targeted debugging and resolution strategies.
Moreover, the Firefox Developer Tools offer comprehensive documentation and resources for understanding common error patterns, best practices for exception handling, and strategies for mitigating potential issues within JavaScript code. By equipping developers with the knowledge and insights necessary to navigate and address errors and exceptions effectively, these resources contribute to a more informed and empowered approach to JavaScript debugging.
By leveraging the robust capabilities of the Firefox Developer Tools for debugging errors and exceptions, developers can gain a comprehensive understanding of their JavaScript code's behavior, identify potential issues, and implement targeted solutions with confidence and precision. Whether diagnosing runtime errors, tracing exception origins, or leveraging documentation for informed debugging strategies, the Firefox Developer Tools empower developers to create robust and reliable web applications that deliver a seamless user experience.


