Introduction
Firebug is a powerful and versatile web development tool that has been a game-changer for developers and designers alike. This browser extension, initially developed for the Firefox browser, has revolutionized the way websites are built and debugged. With its intuitive interface and robust features, Firebug has become an indispensable asset for anyone involved in web development.
From inspecting and editing HTML and CSS to debugging JavaScript and analyzing network traffic, Firebug offers a comprehensive suite of tools that streamline the development process. Its user-friendly interface and real-time editing capabilities make it a favorite among web developers seeking to optimize their workflow and enhance the quality of their code.
In this article, we will delve into the various aspects of using Firebug for Firefox, exploring its installation process and highlighting its key features. Whether you are a seasoned developer or just starting out, understanding how to leverage Firebug effectively can significantly boost your productivity and elevate the quality of your web projects.
So, let's embark on this journey to uncover the potential of Firebug and learn how to harness its capabilities to streamline web development, troubleshoot issues, and optimize the performance of websites. Whether you're a front-end developer, a designer, or a curious enthusiast, Firebug has something to offer, and we're here to guide you through the process of making the most of this indispensable tool.
Installing Firebug
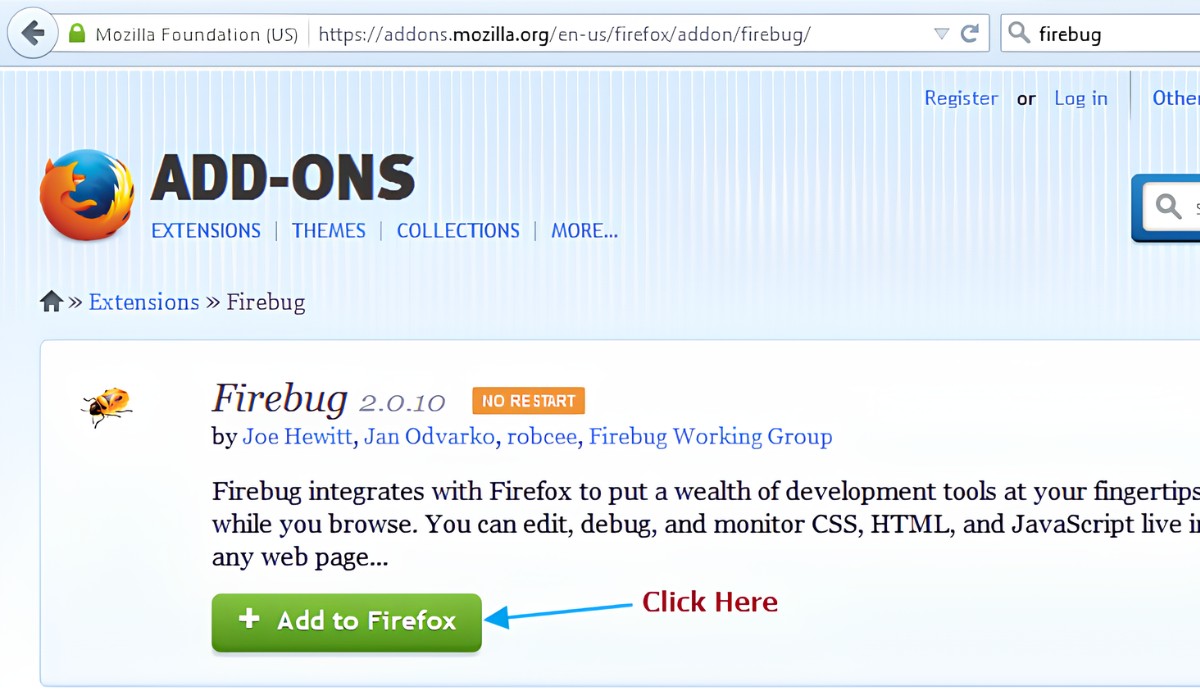
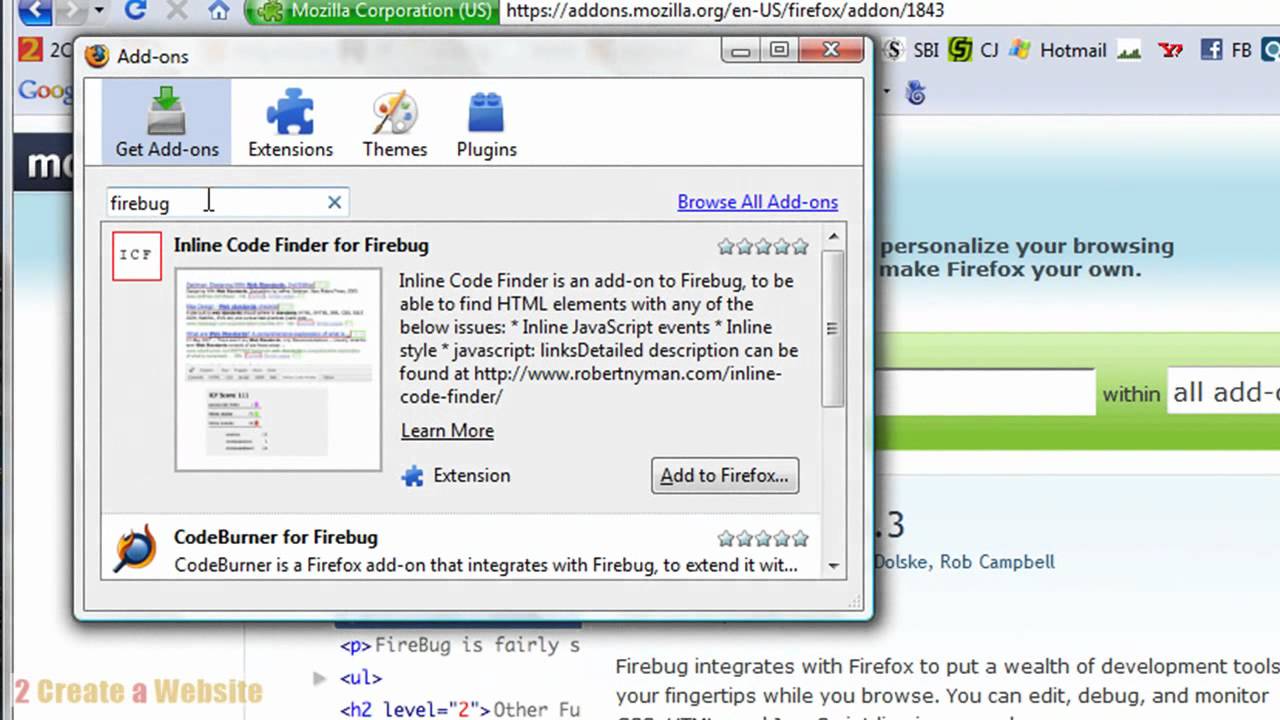
Installing Firebug is a straightforward process that can be completed in just a few simple steps. To begin, open your Firefox browser and navigate to the official Firebug website or the Firefox Add-ons page. Once there, search for "Firebug" in the extensions or add-ons section. You should see the Firebug extension listed among the search results.
Click on the "Add to Firefox" button next to the Firebug extension. A confirmation dialog will appear, prompting you to confirm the installation. Click "Add" to initiate the installation process. Firefox will then download and install the Firebug extension, after which you will be prompted to restart the browser to complete the installation.
After restarting Firefox, you can verify that Firebug has been successfully installed by looking for its icon in the browser's toolbar. The Firebug icon typically resembles a bug or a small insect, making it easily recognizable. Once you spot the Firebug icon, you can rest assured that the extension has been successfully installed and is ready for use.
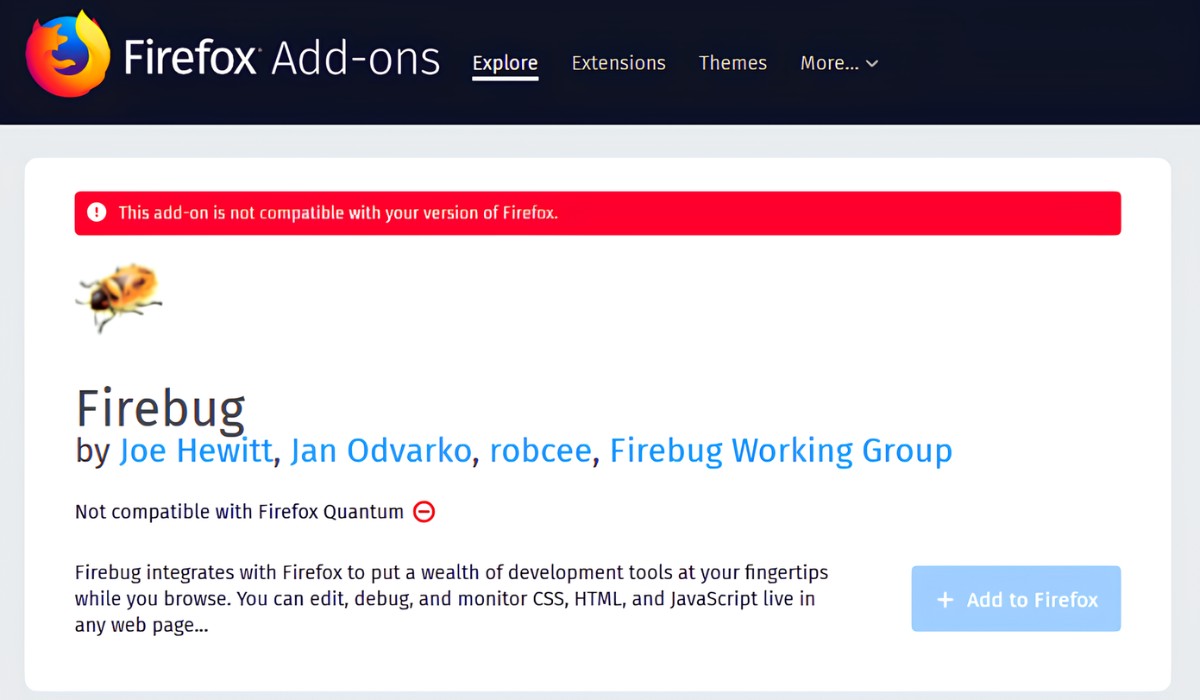
It's important to note that while Firebug was once a standalone extension, it has now been integrated into Firefox Developer Tools. This means that newer versions of Firefox come with built-in developer tools that incorporate the functionality of Firebug. As a result, you may not need to install Firebug separately if you are using an up-to-date version of Firefox.
In summary, installing Firebug for Firefox is a simple process that involves searching for the extension, adding it to your browser, and then verifying its successful installation. With Firebug at your disposal, you can dive into the world of web development with a powerful set of tools and features that will enhance your productivity and efficiency.
Using Firebug for Inspecting Elements
One of the fundamental tasks in web development is inspecting and analyzing the elements of a web page. This process involves examining the HTML structure, CSS styles, and layout of individual elements to understand how they contribute to the overall design and functionality of the website. Firebug excels in this area, providing a robust set of tools for inspecting and manipulating elements with ease.
Upon opening a web page in Firefox, you can activate Firebug by clicking on its icon in the browser's toolbar. This action will launch the Firebug panel, typically located at the bottom or right-hand side of the browser window. Within the Firebug panel, you will find a range of tabs, including HTML, CSS, Layout, and more, each offering specific functionalities for inspecting and modifying elements.
The HTML tab allows you to explore the underlying structure of the web page, displaying the hierarchy of elements in a tree-like format. By expanding and collapsing nodes, you can navigate through the document object model (DOM) and pinpoint the specific elements you wish to inspect. Clicking on an element within the HTML tab will highlight it on the web page, making it easy to identify and focus on individual components.
In addition to inspecting the HTML structure, Firebug provides a dedicated CSS tab that enables you to view and modify the styles applied to each element. This feature is invaluable for understanding how CSS rules impact the appearance and layout of elements on the page. By toggling CSS properties on and off, adjusting values, and experimenting with different styles, you can observe real-time changes to the appearance of the web page, empowering you to fine-tune the design and layout with precision.
Furthermore, the Layout tab in Firebug offers insights into the positioning and dimensions of elements, allowing you to visualize the box model, margins, padding, and borders. This functionality is particularly useful for troubleshooting layout issues and ensuring that elements are positioned and sized as intended.
As you delve deeper into the process of inspecting elements with Firebug, you will discover its seamless integration with the Firefox browser, providing a dynamic and interactive environment for analyzing and manipulating web page elements. Whether you are fine-tuning the styling of a specific component, identifying the source of a layout issue, or simply exploring the structure of a web page, Firebug equips you with the tools needed to inspect elements with precision and efficiency.
In summary, Firebug's capabilities for inspecting elements empower web developers and designers to gain a comprehensive understanding of the structure, styling, and layout of web pages, facilitating the optimization and refinement of website designs with unparalleled ease and effectiveness.
Using Firebug for Debugging JavaScript
Debugging JavaScript is an essential aspect of web development, as it allows developers to identify and resolve errors, optimize code performance, and ensure the smooth functionality of interactive elements on web pages. Firebug offers a robust set of tools specifically designed for debugging JavaScript, providing developers with a seamless and efficient environment for diagnosing and addressing issues within their code.
Upon activating Firebug within the Firefox browser, developers can access the JavaScript debugging capabilities by navigating to the "Script" tab within the Firebug panel. This tab presents a comprehensive view of the JavaScript files associated with the web page, allowing developers to inspect, analyze, and debug their code with precision.
One of the key features of Firebug's JavaScript debugging tools is the ability to set breakpoints within the code. By clicking on the line number of a JavaScript file, developers can create breakpoints that pause the execution of the code at specific points. This functionality is invaluable for examining the state of variables, evaluating expressions, and stepping through the code to pinpoint the source of errors.
Furthermore, Firebug provides a dedicated "Console" tab that displays error messages, log outputs, and interactive JavaScript commands. Developers can leverage the console to log messages, execute JavaScript code snippets, and monitor the behavior of their scripts in real time. This real-time feedback mechanism enables developers to gain insights into the execution of their JavaScript code and swiftly address any issues that may arise.
In addition to setting breakpoints and monitoring code execution, Firebug's JavaScript debugging tools offer a range of functionalities for inspecting variables, evaluating expressions, and tracing the flow of program execution. Developers can examine the values of variables at different stages of the code execution, enabling them to identify discrepancies, unexpected behaviors, and logical errors within their JavaScript code.
By harnessing the power of Firebug for debugging JavaScript, developers can streamline the process of identifying and resolving issues within their code, ultimately enhancing the functionality and performance of JavaScript-powered elements on web pages. Whether it's troubleshooting logic errors, optimizing code efficiency, or gaining insights into runtime behaviors, Firebug's JavaScript debugging tools empower developers to elevate the quality and reliability of their JavaScript code with confidence and precision.
Using Firebug for Analyzing Network Traffic
Analyzing network traffic is a critical aspect of web development, as it allows developers to gain insights into the performance, efficiency, and resource utilization of web pages. Firebug offers a comprehensive suite of tools specifically designed for analyzing network traffic, providing developers with the means to monitor and optimize the loading and rendering of web page resources.
Upon activating Firebug within the Firefox browser, developers can access the network analysis capabilities by navigating to the "Net" tab within the Firebug panel. This tab presents a detailed overview of the network activity associated with the loading of the web page, offering valuable information about the requests, responses, and timing of each resource.
One of the key features of Firebug's network analysis tools is the ability to view the timeline of network activity, allowing developers to visualize the sequence of resource requests and responses. This timeline provides a clear depiction of the loading process, enabling developers to identify potential bottlenecks, latency issues, and inefficient resource loading patterns.
Furthermore, Firebug offers insights into the size and load times of individual resources, allowing developers to assess the impact of each resource on the overall page load performance. By examining the details of resource requests, including their size, type, and response times, developers can pinpoint opportunities for optimization, such as compressing images, minifying scripts, or leveraging browser caching.
In addition to monitoring resource loading times, Firebug's network analysis tools provide a comprehensive view of HTTP headers, status codes, and response details for each resource request. This level of visibility enables developers to diagnose issues related to server responses, caching policies, and content delivery, empowering them to fine-tune the configuration of web servers and optimize the delivery of resources to end users.
By harnessing the power of Firebug for analyzing network traffic, developers can gain a deep understanding of the factors influencing the loading and rendering of web page resources. Whether it's identifying opportunities for performance optimization, diagnosing latency issues, or fine-tuning server configurations, Firebug's network analysis tools equip developers with the insights needed to enhance the speed, efficiency, and reliability of web page loading.
In summary, Firebug's network analysis capabilities provide developers with a comprehensive toolkit for monitoring, analyzing, and optimizing the network traffic associated with web page loading, ultimately contributing to the delivery of fast, responsive, and efficient web experiences.
Using Firebug for Editing CSS and HTML
Firebug's prowess extends beyond inspecting and analyzing elements; it also empowers developers and designers to make real-time edits to CSS and HTML, fostering a dynamic and iterative approach to refining the visual and structural aspects of web pages.
Upon activating Firebug within the Firefox browser, developers can access the CSS editing capabilities by navigating to the "CSS" tab within the Firebug panel. This tab provides a comprehensive view of the CSS styles applied to the web page, allowing developers to inspect, modify, and experiment with styles in a live environment. By clicking on individual CSS rules, developers can adjust property values, add new styles, or disable existing rules, observing the immediate impact of these changes on the appearance of the web page.
One of the key features of Firebug's CSS editing tools is the ability to experiment with different styles and instantly visualize the results. By modifying CSS properties, such as colors, dimensions, margins, and positioning, developers can iteratively refine the visual presentation of elements, fine-tuning the design with precision and immediacy. This real-time feedback mechanism empowers developers to explore various design options, evaluate their visual impact, and make informed decisions about the styling of web page elements.
In addition to editing CSS styles, Firebug facilitates real-time edits to the HTML structure of web pages. By navigating to the "HTML" tab within the Firebug panel, developers can inspect the DOM and make on-the-fly modifications to the HTML markup. This functionality is particularly valuable for experimenting with layout changes, adding or removing elements, and testing the impact of structural adjustments on the overall design and functionality of the web page.
Furthermore, Firebug's HTML editing tools enable developers to interactively explore different content arrangements, experiment with new elements, and assess the visual hierarchy of the web page. By seamlessly integrating CSS and HTML editing capabilities, Firebug provides a holistic environment for refining the visual and structural aspects of web pages, fostering a fluid and efficient workflow for developers and designers alike.
By harnessing the power of Firebug for editing CSS and HTML, developers and designers can engage in a dynamic and iterative process of refining the visual presentation and structural layout of web pages. Whether it's fine-tuning the styling of individual elements, experimenting with layout changes, or evaluating the impact of structural modifications, Firebug's CSS and HTML editing tools empower users to iteratively refine and optimize the design and layout of web pages with unparalleled ease and immediacy.