Introduction
Firefox, the popular web browser developed by Mozilla, offers a range of powerful tools and features to enhance the browsing experience for users and developers alike. One such essential feature is the Developer Tools, which provides a suite of utilities for inspecting, debugging, and modifying web pages. Whether you're a web developer, designer, or simply a curious user wanting to explore the inner workings of a website, accessing the Developer Tools in Firefox is a valuable skill to have.
In this article, we'll explore multiple methods for opening the Developer Tools in Firefox, catering to different preferences and situations. From keyboard shortcuts for the efficiency-minded to menu navigation for the visually inclined, and even utilizing the Browser Console for those seeking advanced capabilities, we've got you covered. By the end of this guide, you'll be well-equipped to harness the power of Firefox's Developer Tools, empowering you to analyze and manipulate web content with confidence and ease. Let's dive in and uncover the various ways to access these indispensable tools within Firefox.
Method 1: Using Keyboard Shortcuts
When it comes to efficiency and speed, keyboard shortcuts are a go-to option for many users. Firefox provides a set of intuitive keyboard shortcuts to swiftly access the Developer Tools, allowing for seamless navigation and control without the need to rely on the mouse or trackpad.
To initiate the Developer Tools using keyboard shortcuts, simply press Ctrl + Shift + I on Windows or Linux, or Cmd + Option + I on macOS. This action triggers the opening of the Developer Tools panel, ready for inspection and modification of the current web page.
Furthermore, for users who prefer a more targeted approach, Firefox offers specific keyboard shortcuts to directly access individual Developer Tools components. For instance, pressing Ctrl + Shift + C on Windows or Linux, or Cmd + Option + C on macOS, activates the element inspector, allowing you to pinpoint and analyze specific elements within the web page's structure.
In addition to the element inspector, keyboard shortcuts can swiftly activate other Developer Tools features. For example, pressing Ctrl + Shift + S on Windows or Linux, or Cmd + Option + S on macOS, opens the Style Editor, enabling you to modify and experiment with the CSS styles of the web page in a dedicated interface.
By leveraging these keyboard shortcuts, users can seamlessly transition between different Developer Tools components, enhancing their productivity and workflow efficiency. Whether it's inspecting elements, analyzing network activity, or debugging JavaScript, the accessibility and speed afforded by keyboard shortcuts make the Developer Tools in Firefox a joy to use for both casual users and seasoned developers alike.
In the next section, we'll explore an alternative method for accessing the Developer Tools in Firefox, catering to users who prefer a visual and menu-driven approach.
Method 2: Using the Menu
For users who prefer a visual and menu-driven approach to accessing features, Firefox provides an intuitive method for opening the Developer Tools through the browser's menu system. This method is particularly beneficial for individuals who appreciate clear visual cues and structured navigation within the application.
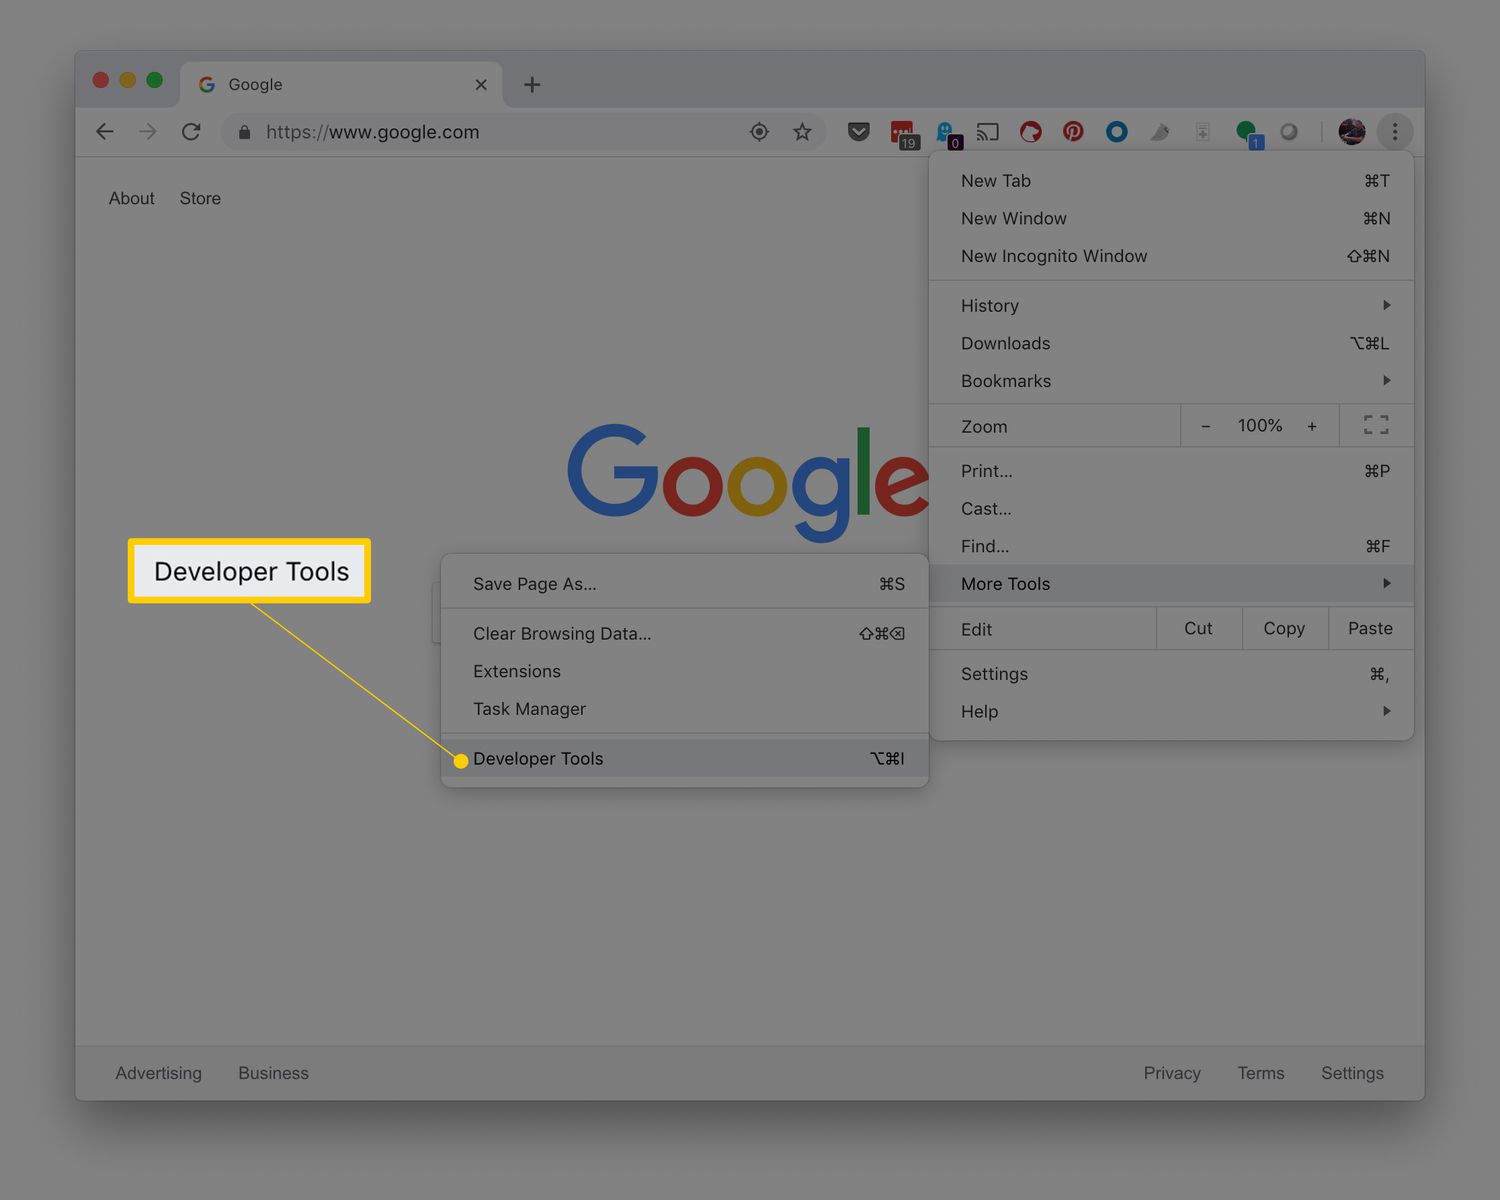
To initiate the Developer Tools using the menu, start by opening the Firefox browser on your desktop or laptop. At the top of the browser window, you'll find the menu bar, which contains various options for customizing and controlling the browser's functionality. Look for the "Menu" button, typically represented by three horizontal lines or dots, and click on it to reveal the dropdown menu.
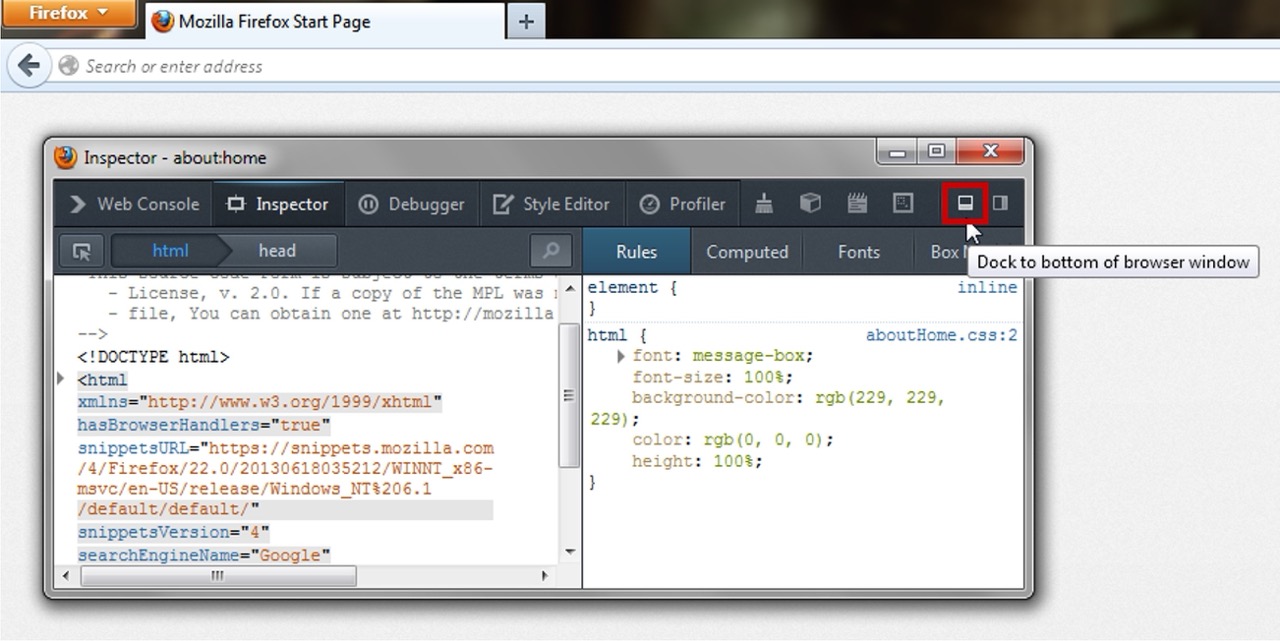
Once the menu is displayed, navigate to the "Web Developer" option. This submenu houses a collection of powerful tools designed to assist users in inspecting, debugging, and optimizing web content. Upon hovering over the "Web Developer" option, a secondary menu will appear, showcasing a range of developer-centric tools and features.
Within the "Web Developer" submenu, you'll find the "Toggle Tools" option, which serves as the gateway to the Developer Tools panel. Clicking on "Toggle Tools" will prompt the browser to open the Developer Tools interface, presenting a comprehensive set of utilities for analyzing and modifying web pages.
Upon accessing the Developer Tools through the menu, users can seamlessly navigate between the various components, such as the Inspector, Console, Debugger, and more, to perform tasks ranging from inspecting and editing HTML and CSS to debugging JavaScript and analyzing network activity.
Furthermore, the menu-driven approach provides a visual representation of the available Developer Tools, making it easy for users to explore and discover the full range of capabilities offered by Firefox. This method is particularly beneficial for individuals who prefer a structured and visually guided interaction with the browser's features.
By utilizing the menu to access the Developer Tools, users can harness the power of Firefox's web development utilities with ease and precision. Whether it's inspecting the structure of a web page, analyzing network requests, or debugging JavaScript code, the menu-driven method offers a user-friendly and visually intuitive pathway to the wealth of developer-centric tools within Firefox.
In the subsequent section, we'll delve into an advanced method for accessing the Developer Tools in Firefox, catering to users seeking additional capabilities and customization options.
Method 3: Using the Browser Console
In addition to the familiar methods of accessing the Developer Tools in Firefox, there exists a powerful and versatile pathway for users seeking advanced capabilities and customization options: the Browser Console. While the Browser Console shares similarities with the main Developer Tools panel, it offers a distinct set of features tailored for users who require deeper insights into web page behavior, performance, and error tracking.
To open the Browser Console in Firefox, users can employ a straightforward keyboard shortcut. By pressing Ctrl + Shift + J on Windows or Linux, or Cmd + Option + J on macOS, the Browser Console is promptly revealed, ready to empower users with a wealth of diagnostic and debugging tools.
The Browser Console serves as a command-line interface, allowing users to interact with the browser environment and the currently loaded web page. It provides a platform for executing JavaScript commands, inspecting network activity, monitoring error messages, and analyzing various aspects of web page performance.
One of the key advantages of the Browser Console is its ability to display detailed error messages and warnings, aiding developers in identifying and resolving issues within their web applications. By leveraging the error logging capabilities of the Browser Console, users can gain valuable insights into JavaScript errors, network requests, and other critical information that may impact the functionality and performance of their web pages.
Furthermore, the Browser Console facilitates real-time interaction with the web page, enabling users to execute JavaScript commands and manipulate the Document Object Model (DOM) directly from the command line. This level of interactivity empowers developers to experiment with code snippets, inspect and modify page elements, and gain a deeper understanding of the underlying structure and behavior of web content.
In addition to its diagnostic and interactive features, the Browser Console offers a range of customization options, allowing users to tailor the display of log messages, filter specific types of messages, and configure advanced settings to suit their debugging and analysis requirements.
By utilizing the Browser Console, users can delve into the inner workings of web pages, gain insights into performance metrics, and diagnose potential issues with precision and efficiency. Whether it's tracking network requests, debugging JavaScript code, or monitoring error messages, the Browser Console in Firefox stands as a versatile and indispensable tool for users seeking advanced capabilities in web development and debugging.
In the subsequent section, we'll summarize the various methods for opening the Developer Tools in Firefox, providing a comprehensive overview of the diverse pathways available to users for accessing these essential web development utilities.
Conclusion
In conclusion, Firefox's Developer Tools stand as a cornerstone of web development and debugging, offering a rich array of utilities and features to empower users in analyzing, modifying, and optimizing web content. Throughout this guide, we've explored multiple methods for opening the Developer Tools in Firefox, catering to diverse user preferences and requirements.
From the efficiency-driven approach of utilizing keyboard shortcuts to the visually guided navigation through the browser's menu system, users have the flexibility to access the Developer Tools in a manner that aligns with their workflow and interaction style. The seamless integration of keyboard shortcuts, coupled with the structured visual cues provided by the menu-driven method, ensures that users can effortlessly harness the power of Firefox's web development utilities.
Furthermore, the advanced capabilities offered by the Browser Console present a compelling pathway for users seeking deeper insights into web page behavior, performance metrics, and error tracking. By leveraging the Browser Console's diagnostic and interactive features, users can gain a comprehensive understanding of the inner workings of web pages, enabling them to diagnose issues, optimize performance, and experiment with code in real time.
Whether it's inspecting and modifying the structure of web content, analyzing network activity, debugging JavaScript code, or gaining insights into performance metrics and error tracking, Firefox's Developer Tools cater to a broad spectrum of user needs and scenarios. The accessibility and versatility of these tools underscore their significance in the realm of web development and debugging.
As users continue to explore and leverage the Developer Tools within Firefox, they are poised to enhance their proficiency in web development, gain deeper insights into the behavior of web pages, and optimize the performance and functionality of their web applications. With a diverse range of methods for accessing the Developer Tools, Firefox empowers users to engage with web content in a dynamic and informed manner, fostering a rich and productive web development experience.
In essence, the Developer Tools in Firefox serve as a catalyst for innovation, exploration, and optimization within the web development landscape, equipping users with the tools and insights needed to create compelling and efficient web experiences. Whether you're a seasoned developer, a budding designer, or simply a curious user, Firefox's Developer Tools invite you to embark on a journey of discovery and empowerment within the realm of web development.