Introduction
The browser console is a powerful tool for web developers and enthusiasts alike. Often overlooked and underestimated, this feature hides beneath layers of user-friendly interfaces, waiting for those who dare to explore its depths. But what exactly is the browser console? How can it benefit you? And why should you take the time to learn its intricacies?
In simple terms, the browser console is a built-in tool in web browsers that allows developers to interact with web pages and applications. It provides a command-line interface where you can execute JavaScript code, debug errors, monitor network activity, and gain insight into the inner workings of a website or web application.
To access the browser console, you don’t need to be an expert coder or possess a deep understanding of web development. Even those with basic HTML and JavaScript knowledge can utilize this indispensable feature. Whether you’re a professional developer, a curious hobbyist, or a website owner looking to optimize performance, the browser console can be a valuable tool at your disposal.
By using the browser console, you can quickly identify and fix issues on your website. It provides a real-time view of the code and how it interacts with the browser, allowing you to debug problems, log data, and test new features or optimizations. It enables you to see error messages, inspect HTML elements, manipulate the page in real-time, and measure performance metrics, just to name a few of its capabilities.
In the world of web development, where every millisecond and every detail counts, the browser console can be a game-changer. It helps you diagnose and troubleshoot issues efficiently, saving countless hours of frustration. With its comprehensive set of tools and features, the browser console empowers you to take control of your website and enhance the user experience.
Throughout this article, we will delve deeper into the browser console, uncovering its hidden potential and exploring the various ways it can benefit developers, designers, and website owners. So, without further ado, let’s open the door to the browser console and embark on this exciting journey of discovery.
What is a Browser Console?
A browser console is a powerful tool that is built into web browsers and serves as a command-line interface for developers. It provides a way to interact with web pages and applications, execute code, debug errors, and monitor network activity. The console gives developers a real-time view of the code and allows them to manipulate the page, inspect HTML elements, and measure performance metrics.
One of the primary functions of the browser console is to execute JavaScript code. This feature provides a sandbox environment where developers can test and experiment with code snippets before implementing them into their projects. It allows you to run JavaScript commands or entire scripts and see the output directly in the console, making it a useful tool for learning and troubleshooting code.
The browser console also plays a crucial role in debugging websites and applications. When an error occurs, the console displays helpful error messages that pinpoint the issue and provide valuable insights into what went wrong. It logs error stacks, line numbers, and other relevant information to assist developers in identifying and resolving the problem quickly. This feature is especially useful for finding syntax errors, logical issues, and compatibility problems with different browsers.
Not only does the browser console handle JavaScript-related tasks, but it also provides access to a wide range of other features. For example, it allows you to inspect and modify the HTML structure of a web page, making it easier to understand and manipulate elements. You can also monitor network requests, including fetching resources, making HTTP requests, and receiving responses. This functionality helps identify slow-loading resources, invalid URLs, or any network-related issues affecting the performance of your web page.
Furthermore, the browser console is a powerful tool for logging data and information. Developers can use console.log() statements to print messages, variable values, or debugging information directly from their code. This feature is particularly valuable for tracking the flow of execution, validating conditions, and understanding the behavior of different functions and variables within the application.
In summary, the browser console is an essential tool for developers, designers, and anyone involved in web development. Its ability to execute code, debug errors, manipulate web pages, and log data makes it a versatile and indispensable companion in the web development workflow. In the following sections, we will explore how to open the browser console, its connection to web development, and the various use cases that highlight its significance in building and maintaining websites and applications.
How to Open the Browser Console
Opening the browser console is a straightforward process that varies slightly depending on the web browser you are using. In this section, we will walk you through the steps for accessing the console in popular web browsers.
Google Chrome: To open the console in Google Chrome, there are a few methods you can use. The simplest way is to right-click anywhere on a web page and select “Inspect” from the context menu. This will open the Developer Tools panel. From there, navigate to the “Console” tab at the top of the panel. Alternatively, you can use the keyboard shortcut by pressing Ctrl+Shift+J (or Cmd+Option+J on Mac).
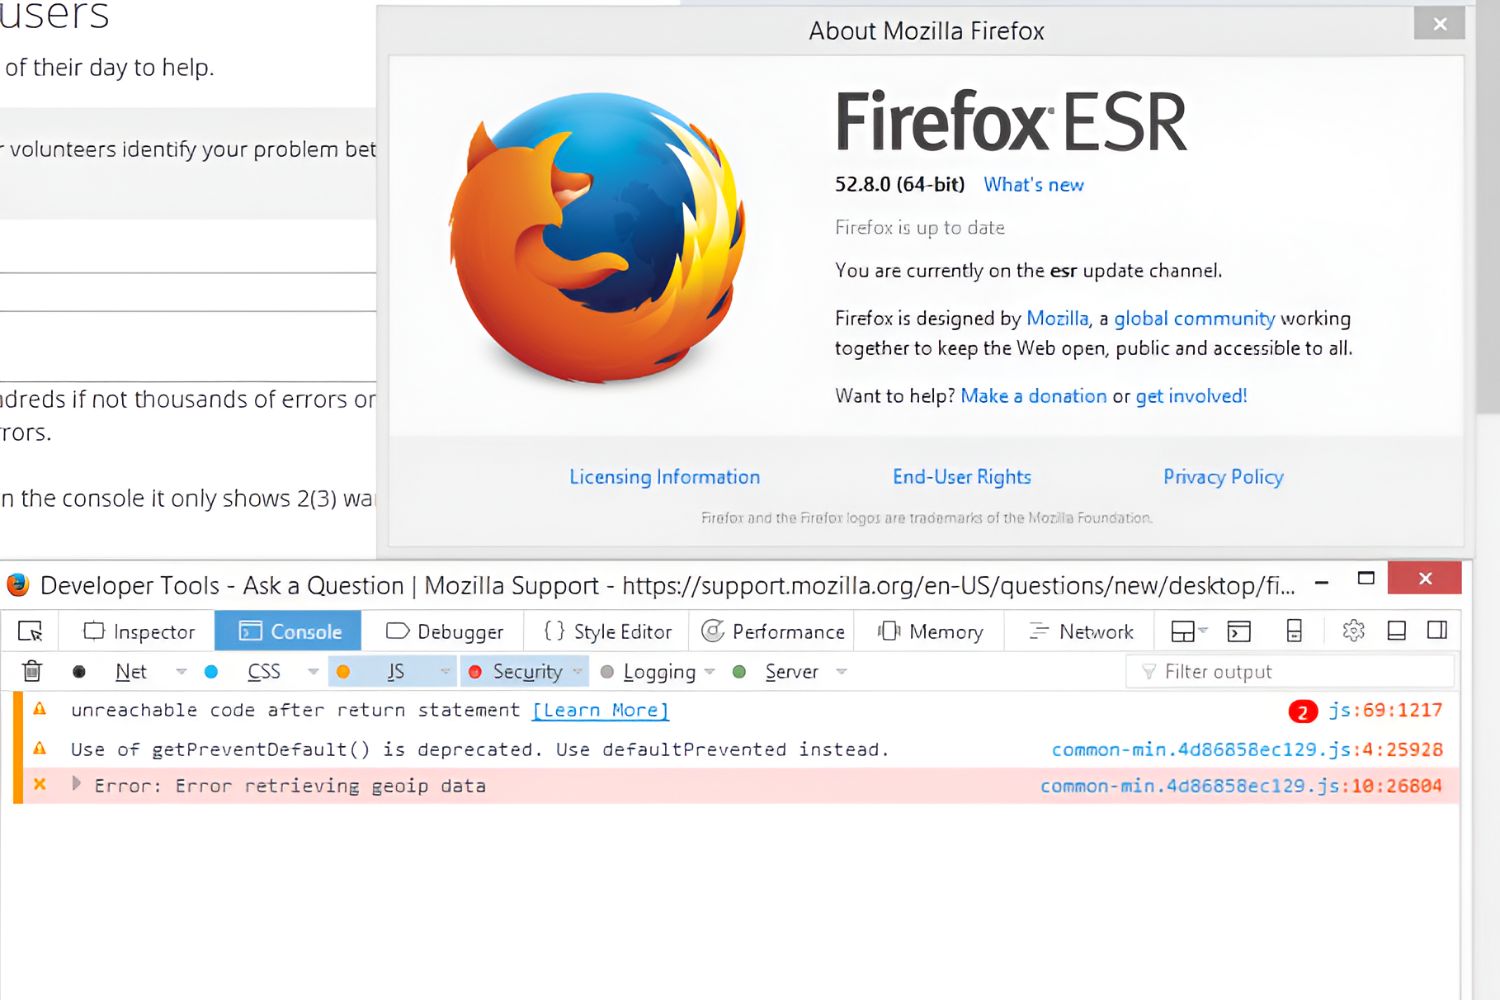
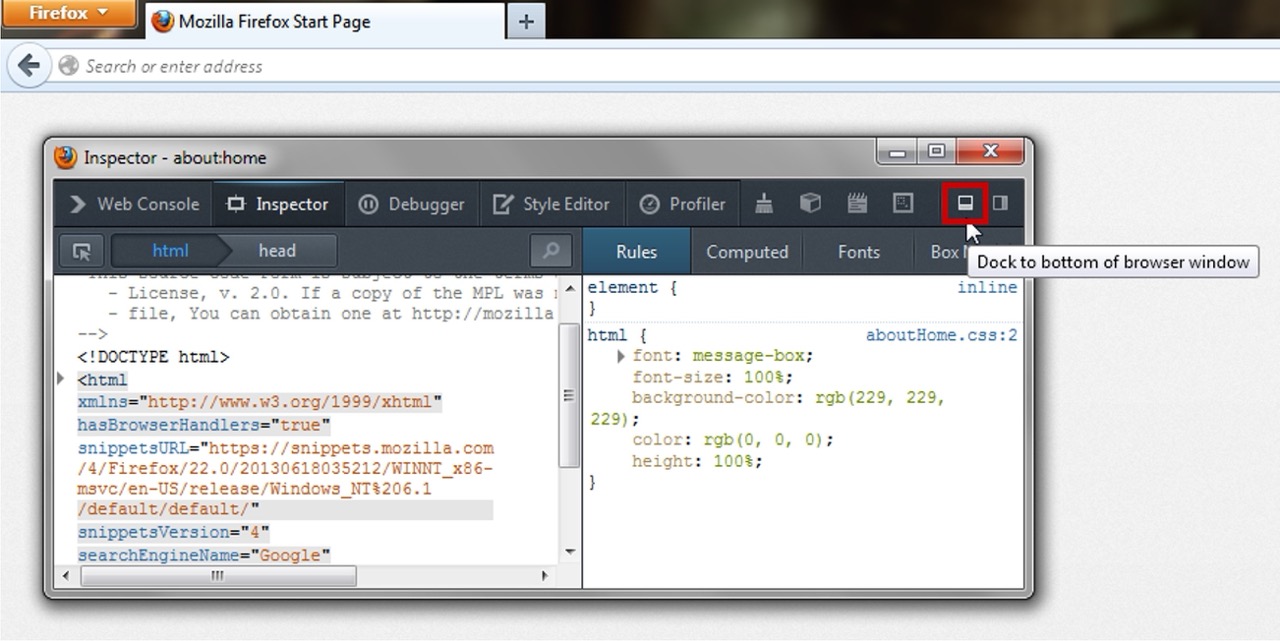
Mozilla Firefox: In Firefox, you can open the console by right-clicking on a web page and selecting “Inspect Element” from the context menu. This will launch the Developer Tools panel. Inside the panel, locate the “Console” tab and click on it to access the browser console. Another method is to use the keyboard shortcut Ctrl+Shift+K (or Cmd+Option+K on Mac) to directly open the console.
Microsoft Edge: In Microsoft Edge, right-click on a web page and choose “Inspect Element” to launch the Developer Tools panel. At the top of the panel, you will find a tab labeled “Console.” Clicking on it will open the browser console. The keyboard shortcut to open the console in Edge is Ctrl+Shift+J (or Cmd+Option+J on Mac).
Safari: To open the console in Safari, you need to enable the developer menu first. Go to Safari preferences by clicking on “Safari” in the menu bar and selecting “Preferences.” In the preferences window, go to the “Advanced” tab and check the box next to “Show Develop menu in the menu bar.” Once you have enabled the developer menu, you can access the console by clicking on “Develop” in the menu bar and selecting “Show Error Console.” Alternatively, you can use the keyboard shortcut Option+Command+C to open the console.
Once you have successfully opened the browser console, it will appear as a separate panel or tab within the developer tools interface. Depending on the browser, you may need to switch to the “Console” tab if it is not the default view. Remember to keep the console panel open while working on web development tasks for easy access to its functionalities.
Now that you know how to access the browser console in different web browsers, let’s move on to the next section to explore how you can use the console for debugging and troubleshooting purposes in your web development projects.
Using the Browser Console for Debugging
The browser console is an invaluable tool for debugging and troubleshooting issues in your web development projects. It provides a real-time view of the code and allows you to inspect, analyze, and manipulate various elements of a web page or application. In this section, we will explore some of the ways you can leverage the power of the browser console for effective debugging.
One of the most common use cases for the browser console is to identify and fix JavaScript errors. When an error occurs in your code, the console will display detailed error messages, including the file name, line number, and a description of the issue. This information helps you pinpoint the exact location of the error and understand what went wrong. By examining the error stack and understanding the context in which the error occurred, you can quickly find and resolve the issue.
In addition to displaying errors, the console allows you to log messages, warnings, and debugging information directly from your code. The console.log() function is particularly useful for this purpose. By strategically placing console.log() statements in your code, you can track the flow of execution, validate conditions, and inspect the values of variables at different points in your program. This logging capability is immensely helpful in understanding the behavior of your code and identifying potential issues.
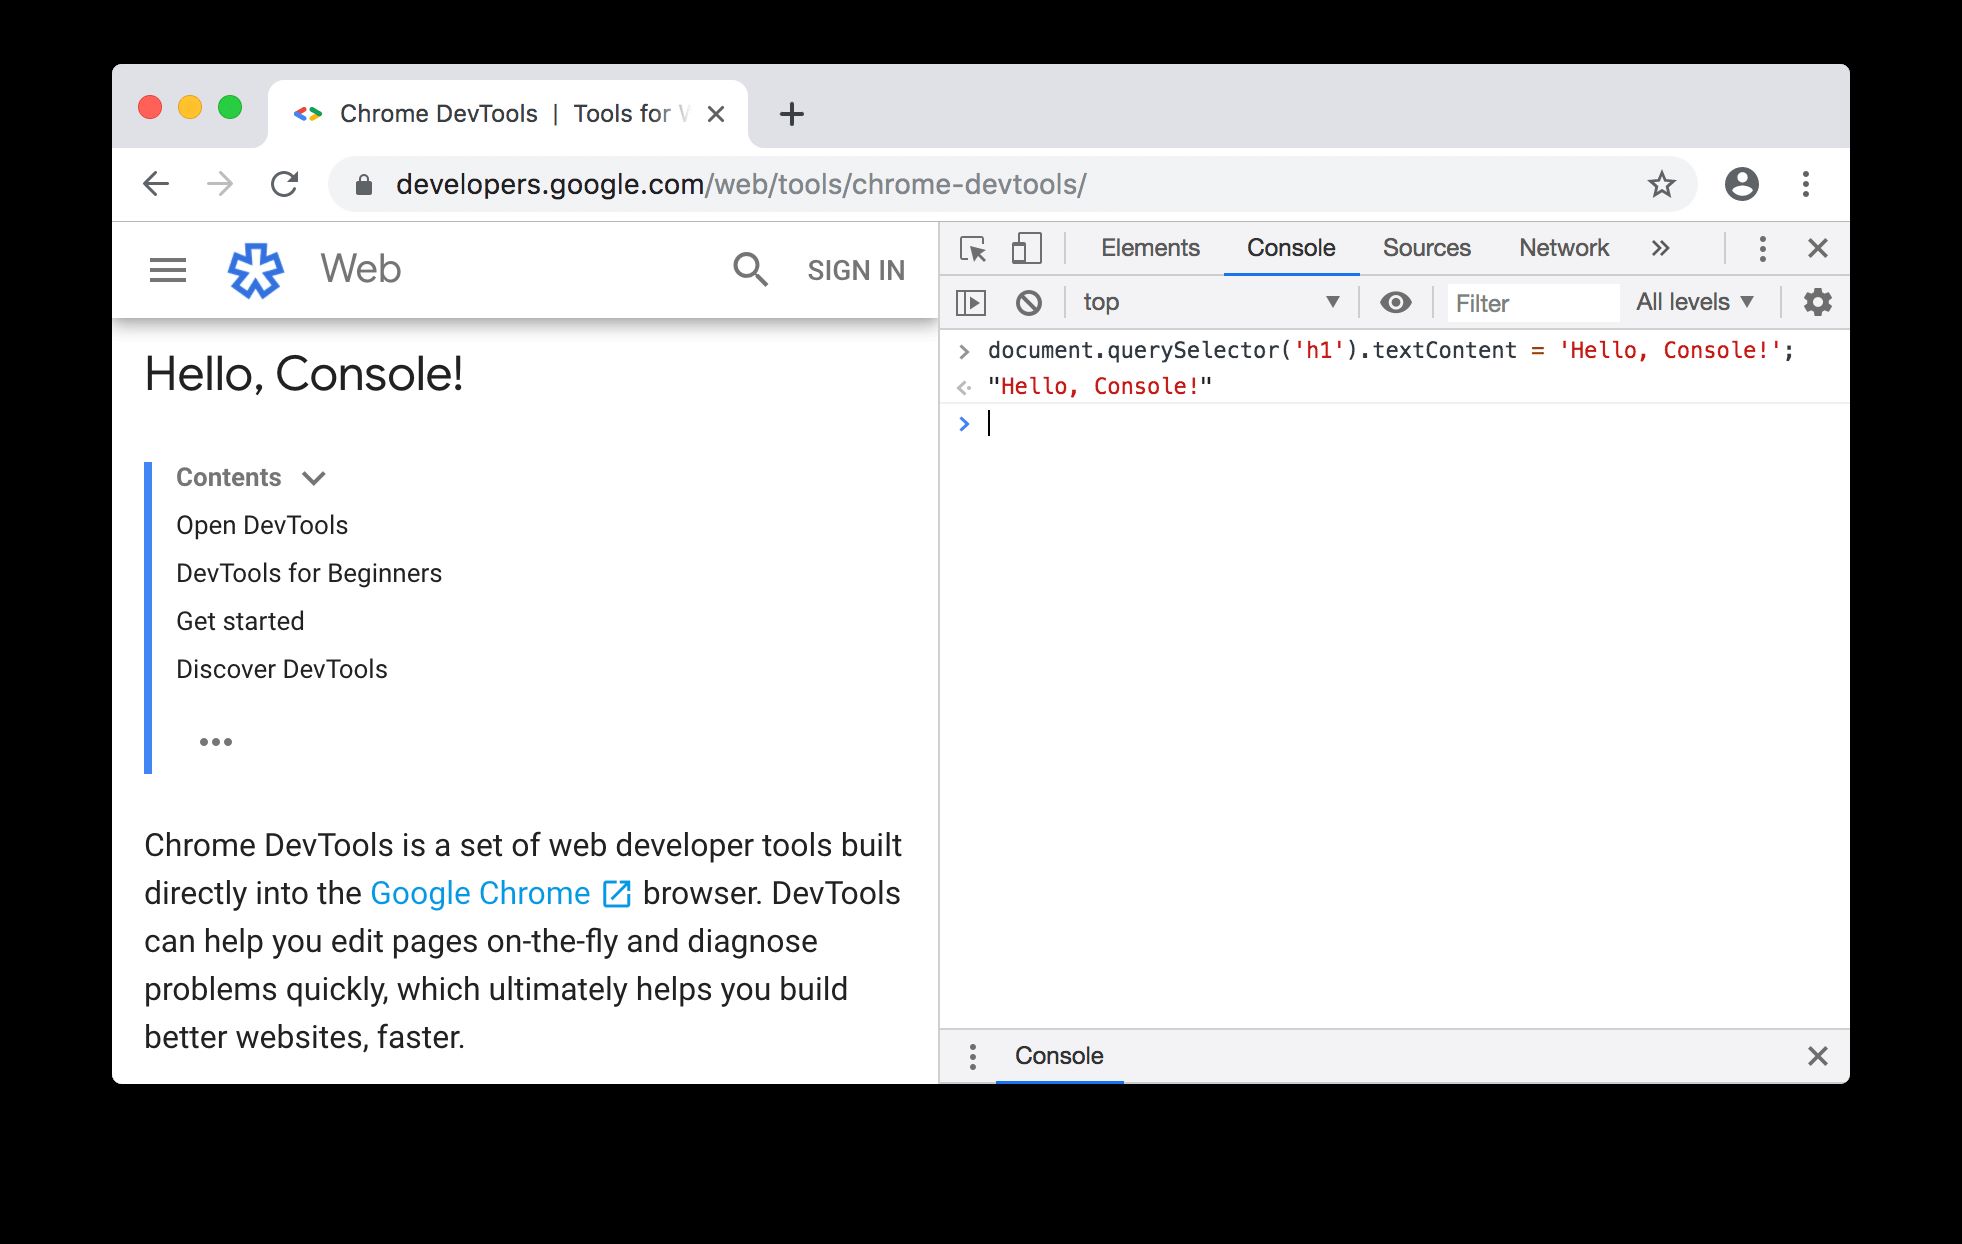
The browser console also allows you to interact with the Document Object Model (DOM) of a web page. With the console, you can access and manipulate HTML elements, CSS styles, and other properties of the page. This functionality is especially beneficial for debugging layout issues, checking the values of specific elements, or experimenting with CSS changes on the fly. You can use functions like document.getElementById(), document.querySelector(), or $() (in jQuery) to select elements and perform actions or retrieve information about them.
Furthermore, the browser console provides a powerful toolset for monitoring network activity and debugging network-related issues. It allows you to inspect network requests, view response headers, track performance metrics, and identify potential bottlenecks in your web application. You can observe the timing of network requests, measure the load time of resources, and analyze the impact of different components on overall page speed. This information is crucial for optimizing performance and delivering a smooth user experience.
Remember, the browser console is not just limited to JavaScript debugging. It can be used for various other tasks, such as testing code snippets, evaluating expressions, or even experimenting with new features. With its vast array of features and its ability to interact with different aspects of a web page, the console is a powerful ally for developers, helping them overcome challenges and achieve desired results.
In the next section, we will explore the connection between the browser console and web development, shedding light on how this tool plays a vital role in the development process and contributes to the success of web projects.
The Connection between the Browser Console and Web Development
The browser console is an integral part of the web development process, providing developers with a powerful set of tools and functionalities. It serves as a direct interface to the browser and allows developers to interact with web pages, execute code, debug errors, and analyze network activity. In this section, we will explore the strong connection between the browser console and web development, highlighting how this tool enhances the development workflow and contributes to the success of web projects.
First and foremost, the browser console is a valuable tool for debugging JavaScript code. With its ability to display error messages, track the execution flow, and inspect variables and objects, the console helps developers identify and fix issues more efficiently. By utilizing the console.log() function to print debugging information, developers can gain insights into the behavior of their code and validate their assumptions.
Moreover, the browser console is instrumental in testing and experimenting with code changes. Web developers can use the console to execute code snippets or modify existing code on the fly, allowing for quick prototyping and validation of concepts. This iterative process helps developers refine their code and ensures its effectiveness before implementation.
The browser console also plays a critical role in optimizing the performance of web applications. By monitoring network activity, inspecting resource load times, and analyzing response headers, developers can identify bottlenecks and optimize the delivery of content. The console provides valuable performance metrics and insights that help developers make informed decisions and enhance the overall user experience.
In addition to these core functionalities, the browser console offers an array of advanced features that aid in the development process. Developers can access the Document Object Model (DOM) of a web page, inspect and modify its structure, and experiment with CSS changes in real-time. This capability allows for rapid prototyping, troubleshooting layout issues, and fine-tuning the visual presentation of a website.
The browser console is also a valuable tool for cross-browser compatibility testing. As web developers strive for consistency across different browsers, the console enables them to identify and address compatibility issues by providing insights into browser-specific errors and discrepancies. By simulating different browser behaviors and monitoring error messages, developers can ensure their web applications function as expected on a variety of platforms.
Overall, the browser console is an indispensable tool for web development. It enables developers to debug, test, and optimize code, while also providing insights into the inner workings of web pages and applications. By leveraging the power of the browser console, developers can streamline their workflow, improve their efficiency, and deliver exceptional web experiences.
In the following sections, we will delve into the common uses of the browser console and explore its advanced features, further highlighting its importance in web development endeavors.
Common Uses of the Browser Console
The browser console offers a multitude of features and functionalities that make it an indispensable tool for web developers. In this section, we will explore some of the common use cases for the browser console, showcasing its versatility and effectiveness in various aspects of web development.
Debugging JavaScript: One of the primary uses of the browser console is to debug JavaScript code. It allows developers to identify and fix errors by displaying detailed error messages and logging relevant information. Developers can track the flow of execution, validate conditions, and inspect the values of variables and objects to understand the behavior of their code and troubleshoot issues effectively.
Testing Code Snippets: The browser console provides a sandbox environment where developers can quickly test and experiment with code snippets. It allows for on-the-fly execution of JavaScript commands or scripts, providing immediate results and feedback. This functionality is particularly useful for trying out new features, prototyping ideas, or verifying the behavior of specific code snippets before integrating them into a larger project.
Inspecting and Manipulating the DOM: The browser console allows developers to interact with the Document Object Model (DOM) of a web page. It enables them to inspect and modify HTML elements, CSS styles, and other properties of the page. This capability is invaluable for troubleshooting layout issues, experimenting with visual changes, or dynamically updating the content of a web page.
Monitoring Network Activity: With the browser console, developers can monitor network requests and analyze the performance of their web applications. It provides insights into request and response headers, load times of resources, and network-related issues. By analyzing this information, developers can identify bottlenecks, optimize resource delivery, and ensure a smooth and efficient user experience.
Logging Data and Information: The console.log() function allows developers to log messages, warnings, and debugging information directly from their code. By strategically placing console.log() statements, developers can track the execution flow, validate conditions, and inspect the values of variables at different points in their program. This logging capability is immensely helpful in understanding code behavior, identifying issues, and verifying the correctness of the code.
Browser Compatibility Testing: The browser console assists in cross-browser compatibility testing by providing insights into browser-specific errors and discrepancies. Developers can simulate different browser behaviors, monitor error messages, and address compatibility issues to ensure their web applications function consistently across various platforms and browsers.
Performance Optimization: The browser console offers valuable performance metrics and insights that help developers optimize the performance of their web applications. By monitoring network activity, load times, and resource sizes, developers can identify areas for improvement, reduce page load times, and enhance the overall user experience.
These are just a few examples of the common uses of the browser console. Its versatility and range of capabilities make it an invaluable tool for developers at every stage of the web development process. Whether it’s debugging code, testing new features, inspecting the DOM, monitoring network activity, logging data, ensuring browser compatibility, or optimizing performance, the browser console is an essential companion for web developers seeking to build robust and efficient web applications.
Advanced Features of the Browser Console
The browser console is equipped with a wide range of advanced features that extend its capabilities beyond basic debugging and troubleshooting. These features empower developers to delve deeper into their web applications, analyze performance, and enhance productivity. In this section, we will explore some of the advanced features of the browser console and their applications in web development.
Code Profiling: The browser console allows developers to profile the performance of their JavaScript code. Profiling helps identify functions or sections of code that consume the most resources and may cause performance bottlenecks. By using console.profile() and console.profileEnd() commands, developers can measure and analyze the execution time and resource consumption of specific code blocks, allowing them to optimize critical sections for improved performance.
Interactive Debugging: The browser console enables interactive debugging by setting breakpoints in the code. Developers can use the debugger; statement in their JavaScript code to pause the execution at specific points and examine the state of variables, step through code lines, and understand the flow of execution. This feature allows for precise and efficient debugging, especially in complex scenarios with conditional statements or loops.
Error Tracking and Reporting: The console provides a powerful tool for error tracking and reporting. Developers can catch and handle JavaScript errors with the window.onerror event and log them to the console or send them to error tracking services. This functionality allows for centralized error monitoring, making it easier to identify and resolve common issues that occur across different web pages or applications.
Remote Debugging: Modern browsers support remote debugging, which enables developers to connect to a remote device or browser instance and debug code remotely. This feature is particularly useful for testing and debugging web applications running on mobile devices or different environments. Developers can inspect and debug code on their development machines while it runs on another device, allowing for efficient debugging without the need for physical access to the device.
Command Line API: The browser console provides an extensive Command Line API that expands its functionality beyond simple JavaScript execution. Developers can use powerful commands and methods to interact with the page, manipulate DOM elements, access web APIs, or perform advanced operations. This API includes functions like $(), $$(), document.querySelector(), document.querySelectorAll(), and many more, enabling developers to perform complex actions with a few lines of code.
Console Styling: The browser console allows developers to style their log messages using CSS syntax. By applying CSS styles to console.log() statements, developers can add color, font formatting, and other visual enhancements to their log output. This feature helps distinguish between different types of log messages, making them easier to identify and follow during debugging sessions.
Command History and Autocompletion: The console provides a command history and autocompletion feature, making it easier to reuse previously executed commands or access available functions and properties. Developers can navigate through previous commands with the arrow keys, reducing the need for repetitive typing. Autocompletion suggests valid commands and syntax based on what has been typed, helping developers write code more quickly and accurately.
These advanced features of the browser console enable developers to take their debugging, performance analysis, and development workflow to the next level. By leveraging these powerful tools, developers can optimize code execution, track and fix errors more efficiently, and enhance their productivity in web development tasks.
Now that we have explored the advanced features of the browser console, let’s wrap up our discussion by summarizing the significant benefits and importance of this versatile tool in the next section.
Conclusion
The browser console is a hidden gem that holds immense value for web developers. With its powerful set of tools and functionalities, it allows developers to interact with web pages, execute code, debug errors, and analyze network activity. The console serves as a command-line interface, providing real-time feedback and insights into the inner workings of websites and web applications.
Throughout this article, we have explored the various aspects of the browser console, from opening it in different web browsers to its connection with web development. We have seen how it can be used for debugging JavaScript, testing code snippets, manipulating the DOM, monitoring network activity, logging data, and optimizing performance. Moreover, we have discussed the advanced features of the console, such as code profiling, interactive debugging, error tracking and reporting, remote debugging, console styling, and command line API.
By incorporating the browser console into their workflow, web developers can streamline their development process, increase productivity, and improve the quality of their web projects. It allows for efficient code debugging, rapid prototyping, layout troubleshooting, performance optimization, and cross-browser compatibility testing. The console’s versatility and advanced features make it an indispensable tool for developers of all levels of expertise.
As you continue your journey in web development, take the time to explore and familiarize yourself with the browser console. Experiment with its functionalities, try out various commands, and incorporate it into your daily development routine. The console holds the key to unraveling the mysteries of your code, uncovering errors, and enhancing the performance of your web applications.
Remember, the browser console is not just a tool for developers; it is a gateway to unlocking the full potential of your web projects. Embrace it, harness its power, and watch as your skills and understanding of web development grow. Whether you are a seasoned professional or just starting, the browser console is an invaluable asset that will propel your web development endeavors to new heights.