




To open console in Firefox, press Ctrl+Shift+K on Windows/Linux or Cmd+Opt+K on macOS. This instantly opens the Web Console for the current page, giving you direct access to errors, logs, and a JavaScript command line.
How to open console in Firefox for a web page
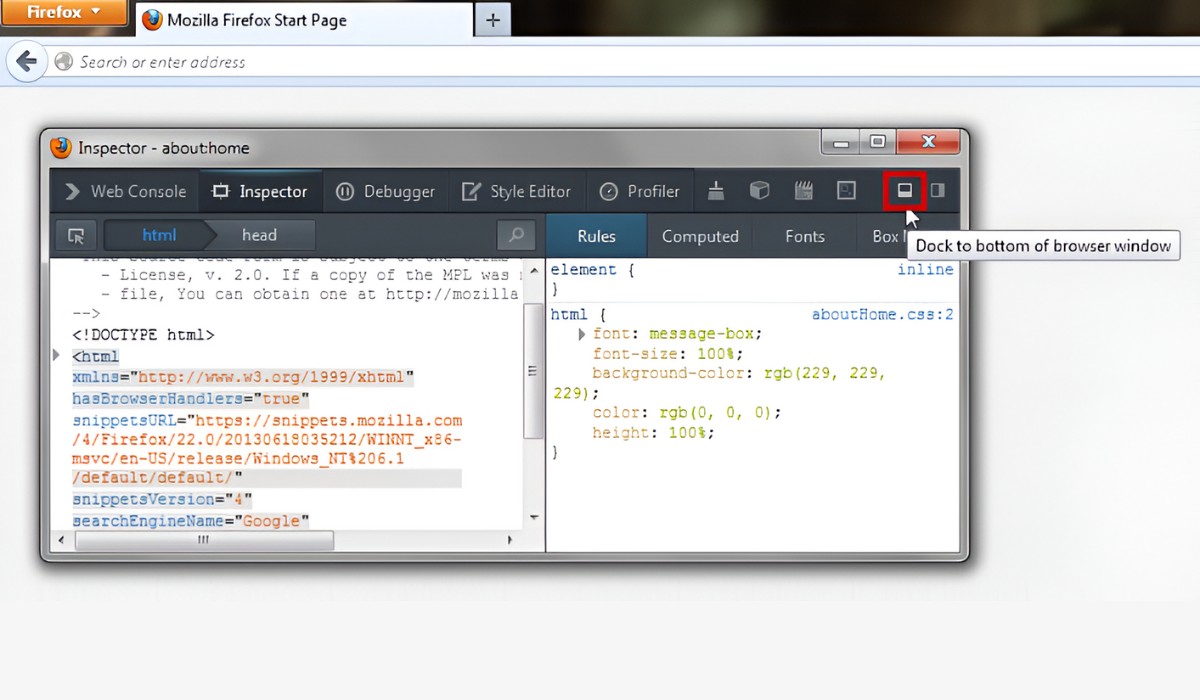
The fastest way to open the Web Console is the keyboard shortcut. On Windows or Linux, press Ctrl+Shift+K. On macOS, press Cmd+Opt+K. The console appears at the bottom of the browser window, ready for you to inspect the current page's activity.
If you prefer using menus, click the Firefox Menu (the hamburger icon in the top-right corner), then select More Tools, followed by Web Developer Tools. In the panel that opens, click the Console tab. This achieves the same result as the shortcut, just with a few extra clicks.
What the Web Console does
The Web Console is your primary tool for debugging a single web page. It logs network requests, JavaScript errors, CSS issues, security warnings, and messages from JavaScript code. This is where you'll see console.log() output, uncaught exceptions, and failed resource loads, all in one place.
Beyond just reading messages, the Web Console lets you interact with the page. You can type JavaScript expressions directly into the command line and execute them in the context of the current page. This is invaluable for testing code snippets, inspecting variables, or manipulating the DOM without leaving your browser.
How to open the Browser Console for all of Firefox
While the Web Console focuses on one page, the Browser Console gives you a browser-wide view. Press Ctrl+Shift+J on Windows/Linux or Cmd+Shift+J on macOS to open it. Alternatively, click the Firefox Menu, select More Tools, then Browser Console.
The Browser Console logs information for the entire browser, encompassing all content tabs, add-ons, and Firefox's own code. This is where you'll see errors from extensions, browser chrome, and cross-tab messages. It's the go-to tool when a problem isn't tied to a single website but affects Firefox as a whole.
Enabling the Browser Console command line
By default, the Browser Console's command line is disabled. This is a safety measure, since executing code here gives you access to the browser's chrome window, allowing interaction with all browser tabs and the user interface. To enable it, type about:config in the address bar and press Enter. Search for devtools.chrome.enabled and set it to true.
Alternatively, open the Developer Tools settings (the gear icon inside any devtools panel) and check the box for "Enable browser chrome and add-on debugging toolboxes". After either change, close and reopen the Browser Console. The command line will now be active, letting you run JavaScript in the browser's global scope.
Opening the full Developer Tools suite
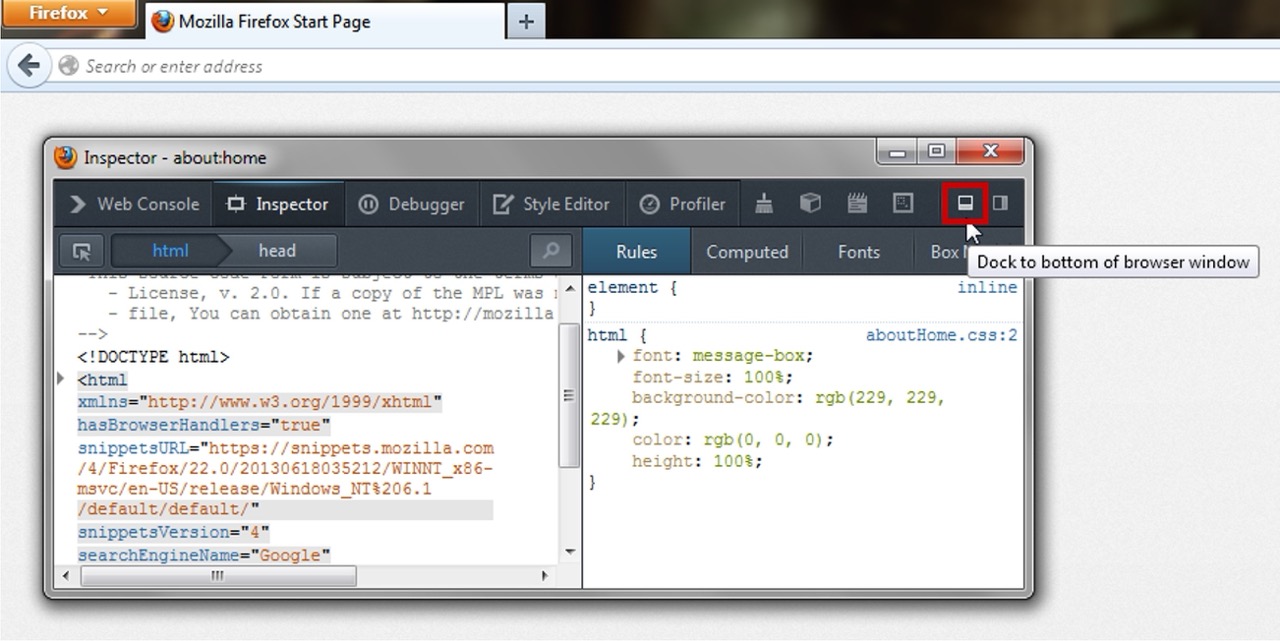
If you need more than just the console, press F12 or Ctrl+Shift+I (Cmd+Opt+I on macOS) to open the entire Developer Tools suite. This includes the Console panel alongside the Inspector, Debugger, Network, Performance, and other specialized tools. The console will be one tab among several, but you can switch to it instantly.
This approach is ideal when you're doing full-stack debugging, performance analysis, or responsive design testing. The Developer Tools suite gives you a unified workspace where the console works hand-in-hand with the element inspector and network monitor, so you can trace a JavaScript error back to its source or check how a CSS change affects the page layout in real time.