Introduction
Debugging JavaScript code is an essential skill for web developers, as it allows them to identify and fix errors in their code. Microsoft Edge browser provides powerful built-in developer tools that enable developers to debug JavaScript efficiently. Whether you're a seasoned developer or just starting with JavaScript, understanding how to leverage these tools can significantly streamline your debugging process.
In this article, we will explore the various features and functionalities of the developer tools in the Edge browser, focusing on how they can be used to debug JavaScript code effectively. By the end of this guide, you will have a comprehensive understanding of the tools available to you and how to utilize them to identify and resolve issues in your JavaScript code.
Debugging JavaScript in the Edge browser involves utilizing a range of tools and techniques, including setting breakpoints, using the console for debugging, inspecting variables and objects, employing the debugger statement, and debugging asynchronous code. Each of these methods plays a crucial role in helping developers pinpoint and rectify errors in their JavaScript applications.
Whether you're troubleshooting a simple script or debugging a complex web application, having a solid grasp of the debugging capabilities offered by the Edge browser can significantly enhance your productivity and efficiency as a developer. With the right knowledge and tools at your disposal, you can tackle JavaScript errors with confidence, ultimately delivering more robust and reliable web experiences for your users.
Now, let's delve into the specifics of using the developer tools in the Edge browser to debug JavaScript code effectively. Whether you're a front-end developer, a full-stack engineer, or a web development enthusiast, mastering these debugging techniques will undoubtedly elevate your JavaScript programming skills and empower you to build more resilient and high-performing web applications.
Using Developer Tools in Edge Browser
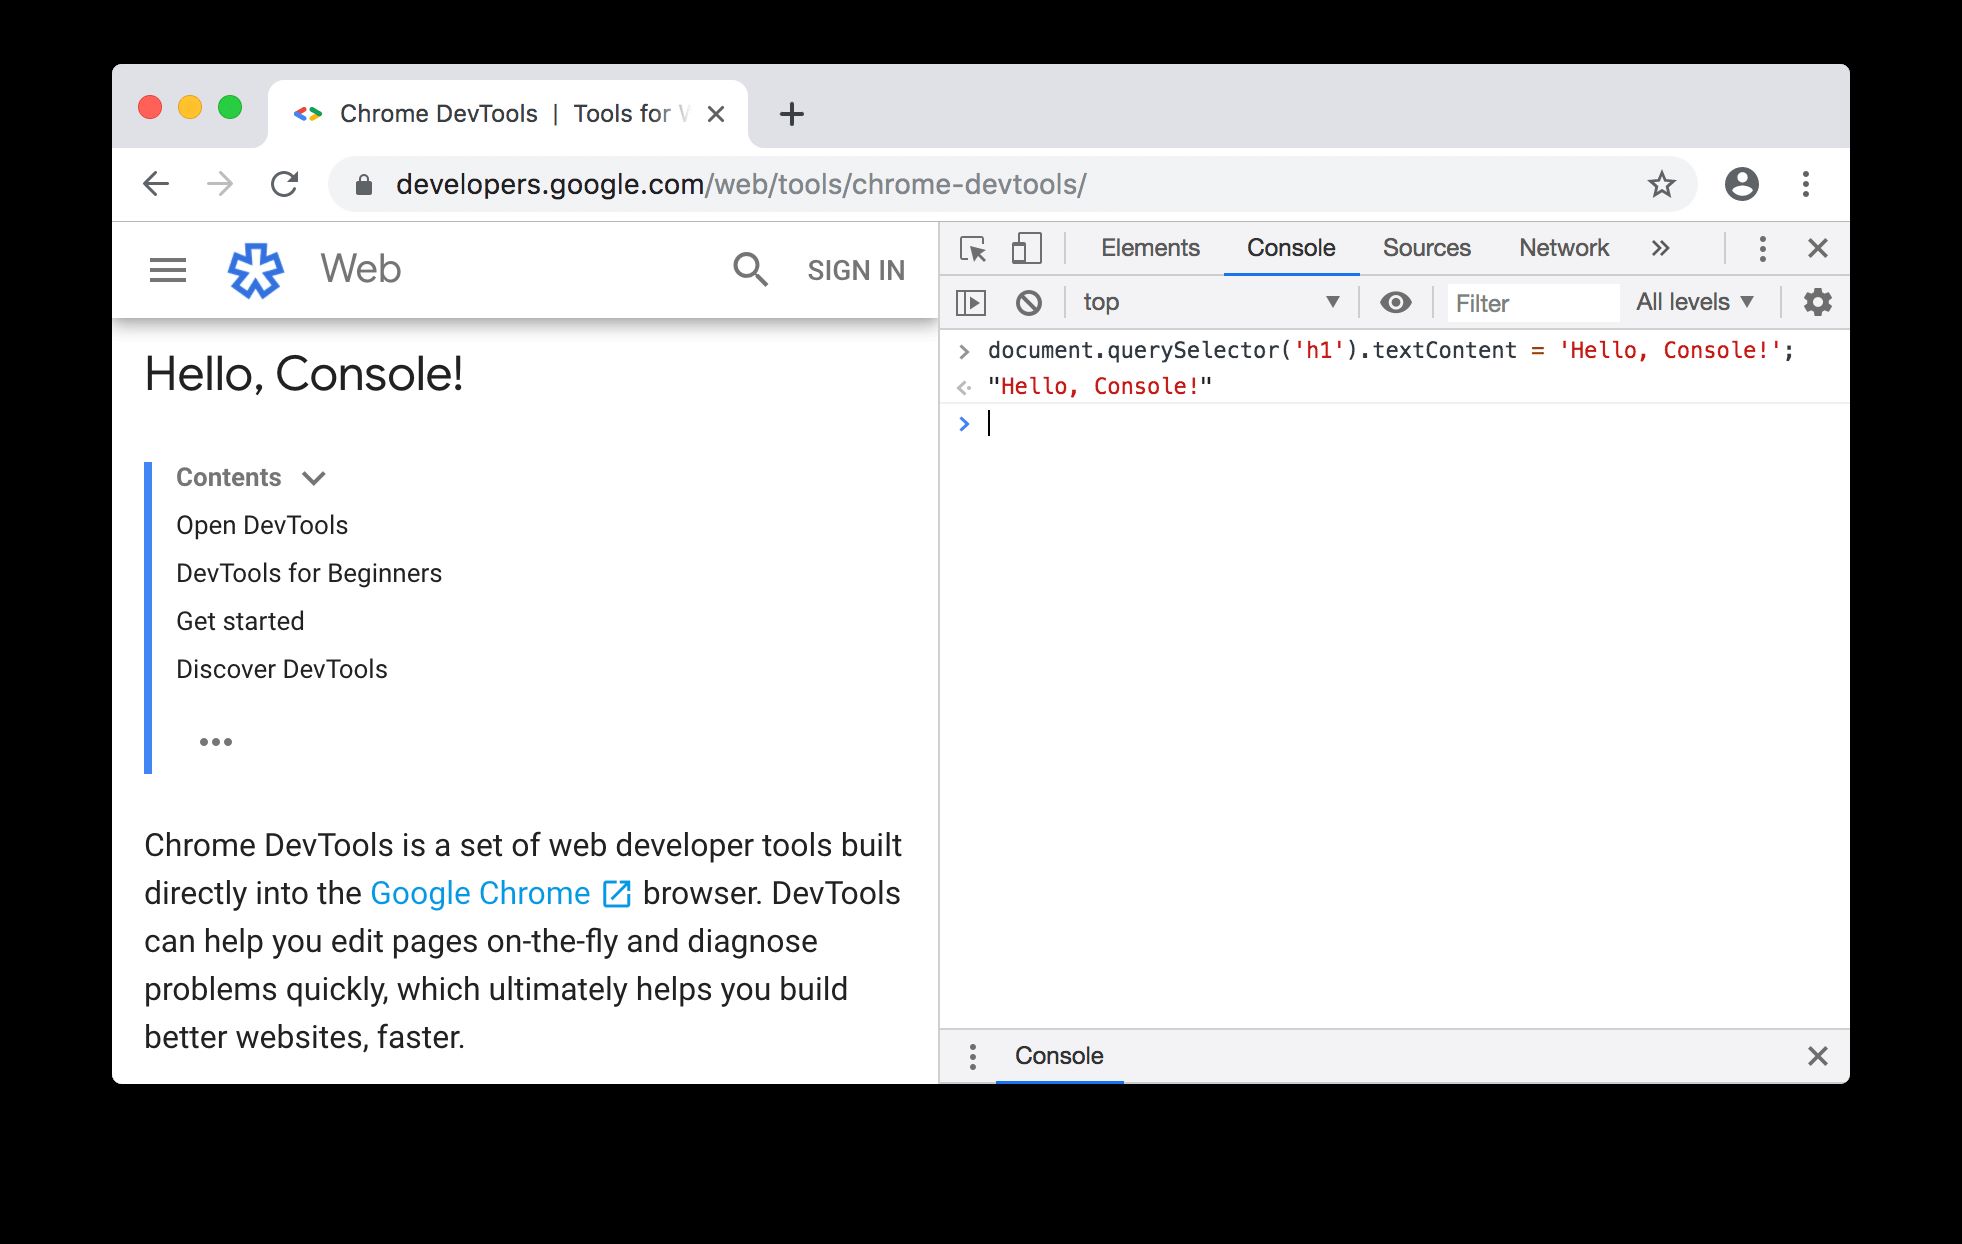
The developer tools in the Edge browser provide a comprehensive set of features designed to facilitate efficient debugging of JavaScript code. To access these tools, simply right-click on the web page and select "Inspect" from the context menu, or press F12 on your keyboard. This action will open the developer tools panel, where you can navigate through the various tabs and functionalities tailored for debugging and inspecting web applications.
Upon opening the developer tools, you will be greeted with a user-friendly interface that comprises several tabs, each serving a distinct purpose. The "Elements" tab allows you to inspect and modify the HTML and CSS of the web page, while the "Console" tab provides a JavaScript console for logging and debugging purposes. Additionally, the "Sources" tab offers a comprehensive view of the JavaScript and other resources associated with the web page, enabling you to set breakpoints, debug, and analyze your JavaScript code effectively.
One of the standout features of the Edge developer tools is the "Debugger" tab, which offers a powerful set of functionalities for stepping through JavaScript code, setting breakpoints, and analyzing runtime behavior. This tab provides a clear overview of the script files associated with the web page, allowing you to navigate through the codebase and identify potential issues.
Furthermore, the "Network" tab in the developer tools enables you to monitor network activity, inspect HTTP requests and responses, and analyze the performance of your web applications. This can be particularly useful for debugging JavaScript code that interacts with external APIs or fetches data from remote servers.
In addition to these core functionalities, the Edge developer tools also offer a range of advanced features, including performance profiling, memory analysis, and emulation of various device environments. These capabilities empower developers to identify performance bottlenecks, memory leaks, and compatibility issues, ultimately contributing to the delivery of high-quality and optimized web applications.
By familiarizing yourself with the developer tools in the Edge browser and understanding how to leverage their features for JavaScript debugging, you can streamline your development workflow and gain deeper insights into the behavior of your web applications. Whether you're troubleshooting a specific JavaScript error or optimizing the performance of your code, the Edge developer tools provide a robust platform for effective debugging and analysis.
In the subsequent sections, we will delve into specific debugging techniques and best practices for JavaScript debugging in the Edge browser, equipping you with the knowledge and skills to tackle a wide range of debugging scenarios with confidence and proficiency.
Setting Breakpoints
Setting breakpoints is a fundamental technique in JavaScript debugging, allowing developers to pause the execution of their code at specific points and inspect the runtime behavior. In the Edge browser's developer tools, setting breakpoints is a seamless process that empowers developers to analyze the state of their JavaScript code and identify potential issues.
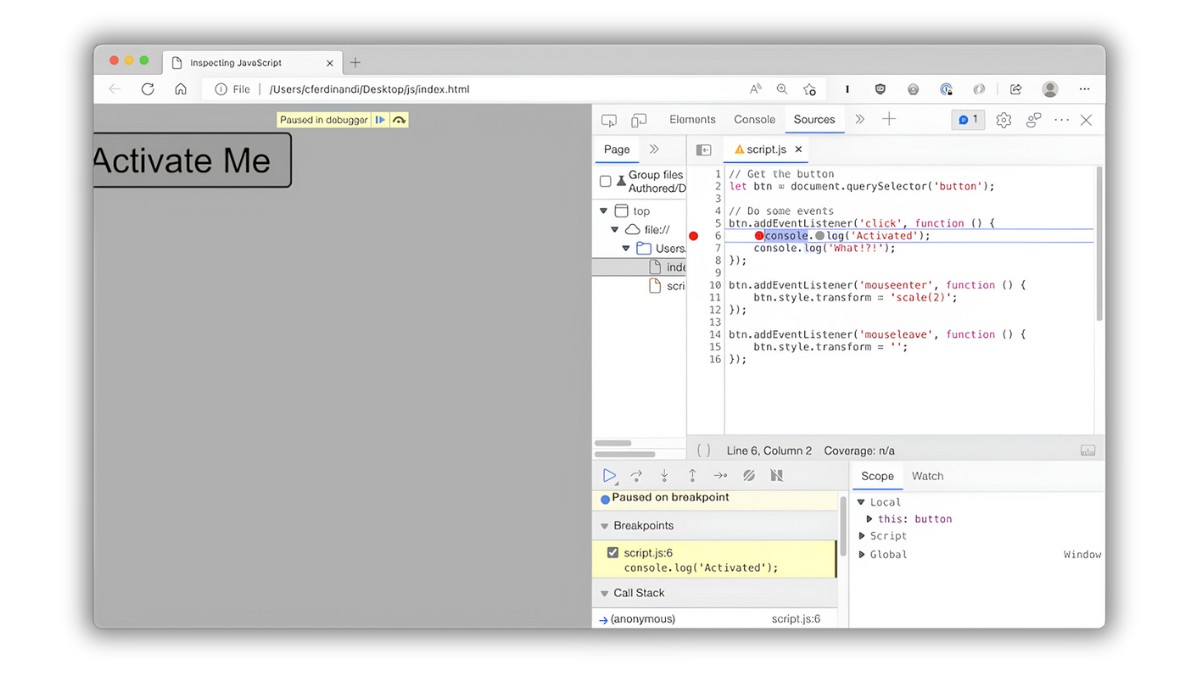
To set a breakpoint in the Edge browser, you can navigate to the "Debugger" tab within the developer tools. Once there, you can locate the specific JavaScript file or function where you intend to set the breakpoint. By clicking on the line number in the code editor, you can effortlessly set a breakpoint, indicated by a red marker. This action instructs the browser to pause the code execution when it reaches the specified line, allowing you to inspect variables, objects, and the overall program state.
Moreover, the Edge developer tools offer advanced breakpoint functionalities, including conditional breakpoints and inline breakpoints. Conditional breakpoints enable developers to specify a condition that must be met for the breakpoint to be triggered, providing greater flexibility in debugging complex logic and iterative processes. On the other hand, inline breakpoints allow developers to set breakpoints directly within the code editor by clicking on the line gutter, offering a convenient way to pinpoint specific execution points within a function or block of code.
By strategically placing breakpoints in your JavaScript code, you can gain valuable insights into the runtime behavior of your applications, identify the flow of control, and isolate potential errors or unexpected behavior. Whether you're debugging event handlers, asynchronous functions, or complex algorithms, leveraging breakpoints in the Edge browser's developer tools can significantly expedite the debugging process and enhance your overall productivity as a developer.
In summary, setting breakpoints in the Edge browser's developer tools is a powerful technique for JavaScript debugging, enabling developers to pause code execution at specific points and analyze the program state. By utilizing breakpoints effectively, developers can gain deeper insights into their code, identify and rectify errors, and ultimately deliver more robust and reliable web applications.
Using Console for Debugging
The console is a versatile and indispensable tool for debugging JavaScript code in the Edge browser. It serves as a command-line interface for logging messages, inspecting objects, and evaluating expressions, providing developers with a flexible and efficient means of debugging their applications.
One of the primary functions of the console is to log messages and output, allowing developers to track the flow of their code and identify potential issues. By using the console.log() method, developers can print values, variables, and custom messages to the console, providing valuable insights into the state of their JavaScript code at different execution points. This simple yet powerful technique enables developers to trace the execution flow, validate variable values, and pinpoint areas of interest within their codebase.
In addition to logging messages, the console offers a range of other useful methods for debugging JavaScript. The console.error() method, for instance, allows developers to log error messages to the console, making it easier to identify and address runtime errors and exceptions. Similarly, the console.warn() method can be used to log warning messages, drawing attention to potential issues or unexpected behavior in the code.
Furthermore, the console provides a platform for evaluating expressions and inspecting objects in real-time. By entering JavaScript expressions directly into the console, developers can execute code snippets, evaluate variable values, and interact with the runtime environment of their applications. This interactive approach to debugging empowers developers to test hypotheses, validate assumptions, and gain a deeper understanding of their code's behavior.
Moreover, the Edge browser's developer tools offer an advanced console feature known as the "Console Sidebar," which provides a comprehensive view of logged messages, errors, warnings, and other console output. This sidebar enables developers to filter and navigate through console logs, making it easier to track and analyze the debugging output generated during the execution of their JavaScript code.
By leveraging the console for debugging in the Edge browser, developers can gain valuable insights into the behavior of their JavaScript applications, identify and address errors, and optimize the performance of their code. Whether it's logging messages, evaluating expressions, or inspecting objects, the console serves as a versatile and indispensable tool for effective JavaScript debugging, empowering developers to build more robust and reliable web applications.
Inspecting Variables and Objects
Inspecting variables and objects is a crucial aspect of JavaScript debugging, as it allows developers to gain deep insights into the state of their code and identify potential issues. In the Edge browser's developer tools, the ability to inspect variables and objects provides developers with a powerful mechanism for understanding the runtime behavior of their applications.
When debugging JavaScript code in the Edge browser, developers can leverage the "Debugger" tab within the developer tools to inspect variables and objects at different execution points. By setting breakpoints within the code and pausing the execution, developers can access the "Scope" and "Watch" panes in the debugger, which offer comprehensive views of the variables and objects within the current execution context.
The "Scope" pane provides a detailed overview of the variables within the current scope, including local variables, function parameters, and closure variables. This feature enables developers to examine the values of variables at specific points in the code, facilitating the identification of unexpected values, uninitialized variables, or scope-related issues.
Furthermore, the "Watch" pane allows developers to define custom expressions and watch specific variables or objects during the debugging process. By adding variables or expressions to the watch list, developers can monitor their values as the code execution progresses, gaining real-time insights into their behavior and interactions.
In addition to the "Scope" and "Watch" panes, the Edge developer tools offer a range of advanced features for inspecting variables and objects, including the ability to expand and explore complex objects, navigate through nested properties, and interactively inspect the contents of arrays and objects.
By utilizing these inspection capabilities, developers can effectively analyze the state of their variables and objects, validate their values, and identify potential data-related issues within their JavaScript code. Whether it's debugging complex data structures, analyzing the behavior of variables within different scopes, or tracking the flow of data through the application, the ability to inspect variables and objects in the Edge browser's developer tools empowers developers to gain deeper insights into their code and build more resilient and high-performing web applications.
In summary, inspecting variables and objects is a fundamental aspect of JavaScript debugging, and the Edge browser's developer tools provide a robust platform for effectively analyzing the state of variables and objects within JavaScript applications. By leveraging these inspection capabilities, developers can gain valuable insights into their code, identify and address data-related issues, and ultimately deliver more reliable and optimized web experiences for their users.
Using the Debugger Statement
The debugger statement is a powerful and versatile tool for debugging JavaScript code in the Edge browser. When strategically placed within the code, the debugger statement instructs the browser to pause the execution at that point, allowing developers to inspect the program state, analyze variable values, and trace the flow of their code in real-time.
To utilize the debugger statement in the Edge browser's developer tools, developers can simply insert the keyword debugger at the desired location within their JavaScript code. When the code is executed, the browser will automatically pause at the line containing the debugger statement, providing developers with an opportunity to delve into the runtime behavior of their applications.
One of the key advantages of the debugger statement is its ability to offer precise control over the debugging process. By strategically placing the debugger statement at critical junctures within the code, developers can gain valuable insights into the program's behavior, identify potential issues, and validate the flow of control. This level of granular control empowers developers to pinpoint specific execution points, making it easier to isolate and address errors within their JavaScript applications.
Moreover, the debugger statement seamlessly integrates with the Edge browser's developer tools, providing a seamless debugging experience. When the code execution pauses at the debugger statement, developers can leverage the full suite of debugging functionalities offered by the developer tools, including inspecting variables, setting breakpoints, and analyzing the call stack. This integration streamlines the debugging workflow, enabling developers to efficiently diagnose and resolve issues within their JavaScript code.
Furthermore, the debugger statement is particularly valuable for debugging complex logic, asynchronous operations, and event-driven code. By strategically placing the debugger statement within asynchronous functions, event handlers, or conditional branches, developers can gain deeper insights into the behavior of their code, facilitating the identification of race conditions, unexpected behavior, and logical errors.
In summary, the debugger statement serves as a valuable asset for JavaScript debugging in the Edge browser, offering precise control over the debugging process and seamless integration with the developer tools. By strategically leveraging the debugger statement within their code, developers can gain deeper insights into the runtime behavior of their applications, identify and address errors, and ultimately deliver more robust and reliable web experiences for their users.
Debugging Asynchronous Code
Debugging asynchronous code presents unique challenges for developers, as it involves managing non-blocking operations, handling callbacks, and navigating complex program flows. In the context of JavaScript, where asynchronous operations are prevalent, effective debugging techniques are essential for identifying and resolving issues within asynchronous code.
In the Edge browser's developer tools, debugging asynchronous code is facilitated by a range of features designed to streamline the debugging process and provide insights into the behavior of asynchronous operations. One of the key strategies for debugging asynchronous code involves leveraging the asynchronous call stack and the associated call frames within the developer tools.
When debugging asynchronous code in the Edge browser, developers can utilize the call stack to trace the execution flow of asynchronous operations, gaining visibility into the sequence of function calls, event handlers, and asynchronous callbacks. By navigating through the call stack, developers can pinpoint the origins of asynchronous operations, identify potential bottlenecks, and analyze the interactions between different parts of the codebase.
Furthermore, the Edge developer tools offer advanced functionalities for debugging asynchronous code, including the ability to set breakpoints within asynchronous functions, promises, and event-driven code. By strategically placing breakpoints and leveraging the debugger statement within asynchronous operations, developers can pause the execution at critical points, inspect variable values, and analyze the runtime behavior of their asynchronous code.
In addition to traditional debugging techniques, the Edge developer tools provide comprehensive support for debugging asynchronous code that utilizes Promises, async/await, and other modern asynchronous patterns. The ability to step through asynchronous code, inspect promise chains, and analyze the resolution of asynchronous operations empowers developers to gain deeper insights into the behavior of their asynchronous code, facilitating the identification of race conditions, unexpected behavior, and logical errors.
By mastering the debugging techniques tailored for asynchronous code in the Edge browser, developers can effectively diagnose and resolve issues within their asynchronous operations, ultimately delivering more robust and reliable web applications. Whether it's debugging asynchronous API calls, event-driven interactions, or complex promise chains, the Edge developer tools provide a powerful platform for gaining deeper insights into the behavior of asynchronous code and building high-performing web experiences.
Conclusion
In conclusion, mastering the art of debugging JavaScript in the Edge browser can significantly elevate a developer's proficiency and efficiency. The built-in developer tools in the Edge browser offer a comprehensive suite of features and functionalities tailored for effective JavaScript debugging, empowering developers to identify and resolve issues within their code with precision and confidence.
By leveraging the developer tools' capabilities, including setting breakpoints, utilizing the console for logging and debugging, inspecting variables and objects, employing the debugger statement, and debugging asynchronous code, developers can gain deeper insights into the behavior of their JavaScript applications and streamline the debugging process.
The ability to set breakpoints at strategic points within the code enables developers to pause the execution, analyze variable values, and trace the flow of their code, facilitating the identification of potential errors and unexpected behavior. Additionally, the console serves as a versatile tool for logging messages, evaluating expressions, and inspecting objects, providing developers with a flexible platform for tracking the execution flow and validating assumptions within their codebase.
Inspecting variables and objects within the Edge browser's developer tools offers a powerful mechanism for understanding the runtime behavior of JavaScript applications, enabling developers to validate variable values, identify data-related issues, and gain deeper insights into the state of their code. Furthermore, the integration of the debugger statement with the developer tools provides precise control over the debugging process, allowing developers to strategically pause the execution, analyze the program state, and identify errors within their code.
When it comes to debugging asynchronous code, the Edge developer tools offer advanced functionalities for tracing the execution flow, setting breakpoints within asynchronous operations, and gaining visibility into the behavior of promises, async/await, and event-driven code. This comprehensive support for debugging asynchronous operations empowers developers to effectively diagnose and resolve issues within their asynchronous code, ultimately contributing to the delivery of high-performing and reliable web applications.
In essence, the developer tools in the Edge browser serve as a valuable ally for developers, equipping them with the necessary features and techniques to tackle a wide range of debugging scenarios. By honing their skills in JavaScript debugging and mastering the intricacies of the Edge developer tools, developers can enhance the quality, reliability, and performance of their web applications, ultimately delivering exceptional user experiences in the ever-evolving digital landscape.