Introduction
Have you ever stumbled upon a beautifully designed website and wondered how it was crafted? Or perhaps you've encountered a webpage with a feature that sparked your curiosity, leaving you eager to peek behind the scenes and unravel its secrets. Well, you're in luck! In this article, we'll delve into the fascinating world of web development and explore how you can view the code of a webpage using the Google Chrome browser.
Whether you're a budding web developer, a tech enthusiast, or simply someone with a keen interest in understanding the inner workings of the web, being able to view the code of a webpage can be an enlightening and empowering experience. It allows you to gain insights into the structure, styling, and functionality of a website, providing a valuable learning opportunity and a deeper appreciation for the artistry of web design and development.
So, if you've ever found yourself pondering how to uncover the code that powers the web, join me as we embark on a journey to unlock the mysteries of web development using the powerful tools and features offered by the Google Chrome browser. Whether you're looking to satisfy your curiosity, enhance your skills, or gain a better understanding of the digital world around you, this guide will equip you with the knowledge and techniques to view the code of any webpage with ease and confidence. Let's dive in and discover the magic that lies beneath the surface of the web!
Using Developer Tools
One of the most powerful features of the Google Chrome browser is its built-in Developer Tools, which provide a comprehensive set of utilities for web developers and enthusiasts to inspect, debug, and modify webpages in real-time. To access these tools, simply right-click on any element of a webpage and select "Inspect" from the context menu, or press Ctrl+Shift+I (Windows/Linux) or Cmd+Option+I (Mac) on your keyboard.
Upon opening the Developer Tools, you'll be greeted with a wealth of information and functionality. The Elements panel, in particular, allows you to explore the HTML and CSS of the webpage, inspect individual elements, and modify their properties on the fly. By navigating through the HTML structure and CSS styles, you can gain a deeper understanding of how the webpage is constructed and styled, unraveling the intricacies of its layout and design.
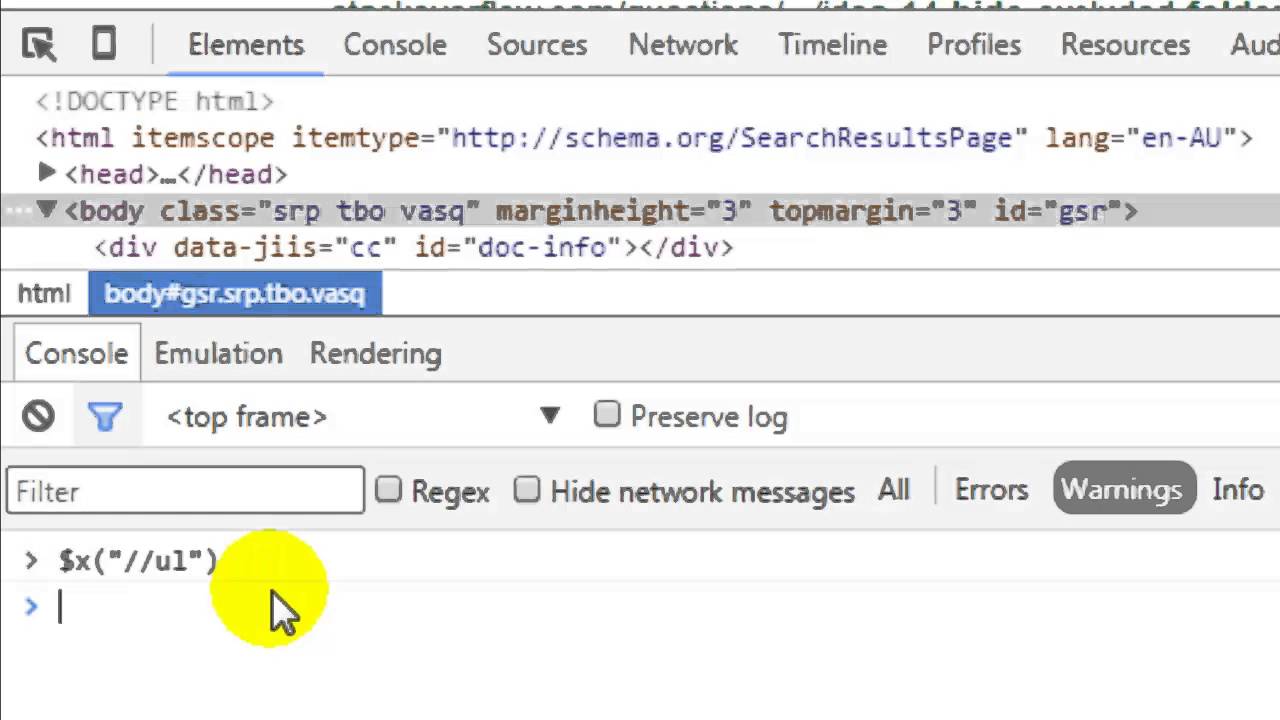
In addition to inspecting and modifying the code, the Developer Tools offer a range of other capabilities. The Console panel serves as a JavaScript playground, enabling you to execute JavaScript code, log messages, and debug issues within the webpage's scripts. This can be immensely valuable for troubleshooting and experimenting with dynamic webpage behavior.
Furthermore, the Network panel provides insights into the network activity of the webpage, allowing you to monitor the loading times of various resources, identify potential bottlenecks, and optimize the performance of the webpage. This can be particularly useful for understanding the underlying mechanisms that drive the delivery of content on the web.
Moreover, the Sources panel empowers you to delve into the JavaScript source code of the webpage, set breakpoints, and step through the code execution, offering a glimpse into the inner workings of the webpage's interactive features and functionality.
By leveraging the capabilities of the Developer Tools, you can gain a holistic view of the code, structure, and behavior of a webpage, enabling you to learn, experiment, and troubleshoot with unparalleled insight and control. Whether you're a seasoned web developer or an inquisitive explorer of the digital realm, the Developer Tools in Google Chrome provide a gateway to the inner workings of the web, inviting you to unravel its mysteries and unleash your creativity.
Viewing Page Source
When it comes to peering into the fundamental building blocks of a webpage, viewing the page source is a straightforward and enlightening approach. In Google Chrome, accessing the page source is a seamless process that offers a direct glimpse into the HTML, CSS, and JavaScript that form the backbone of a webpage.
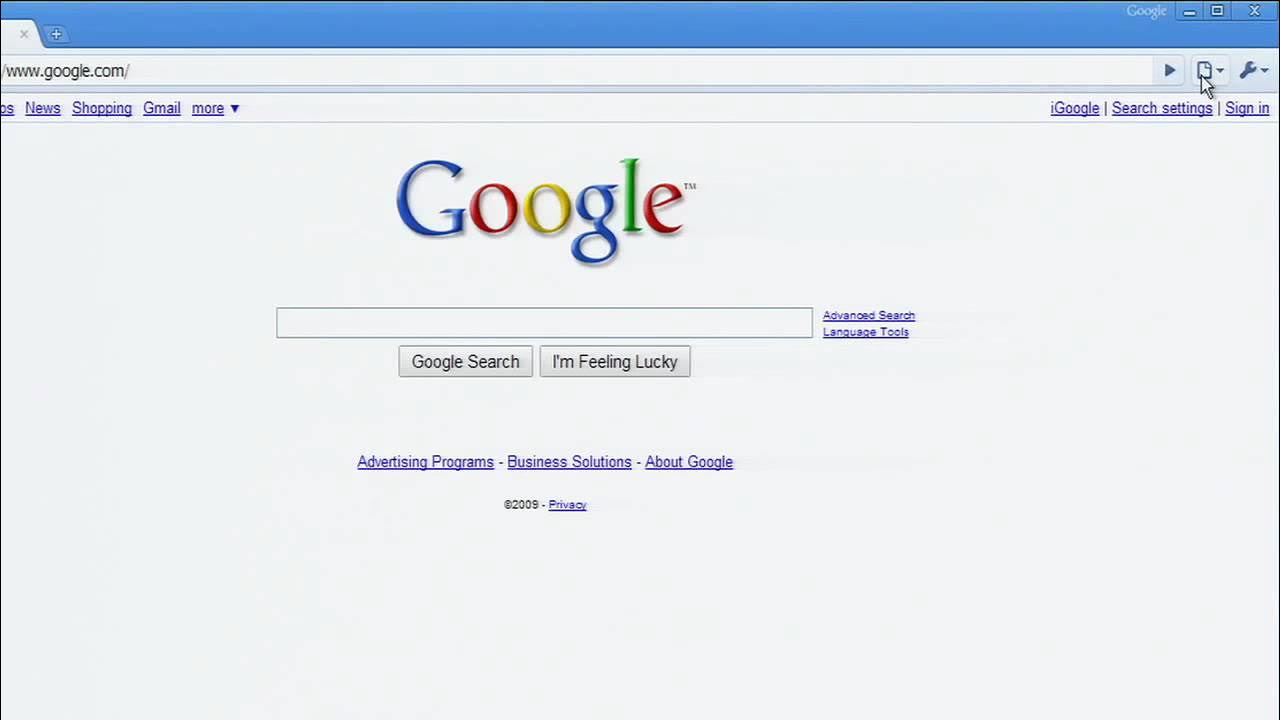
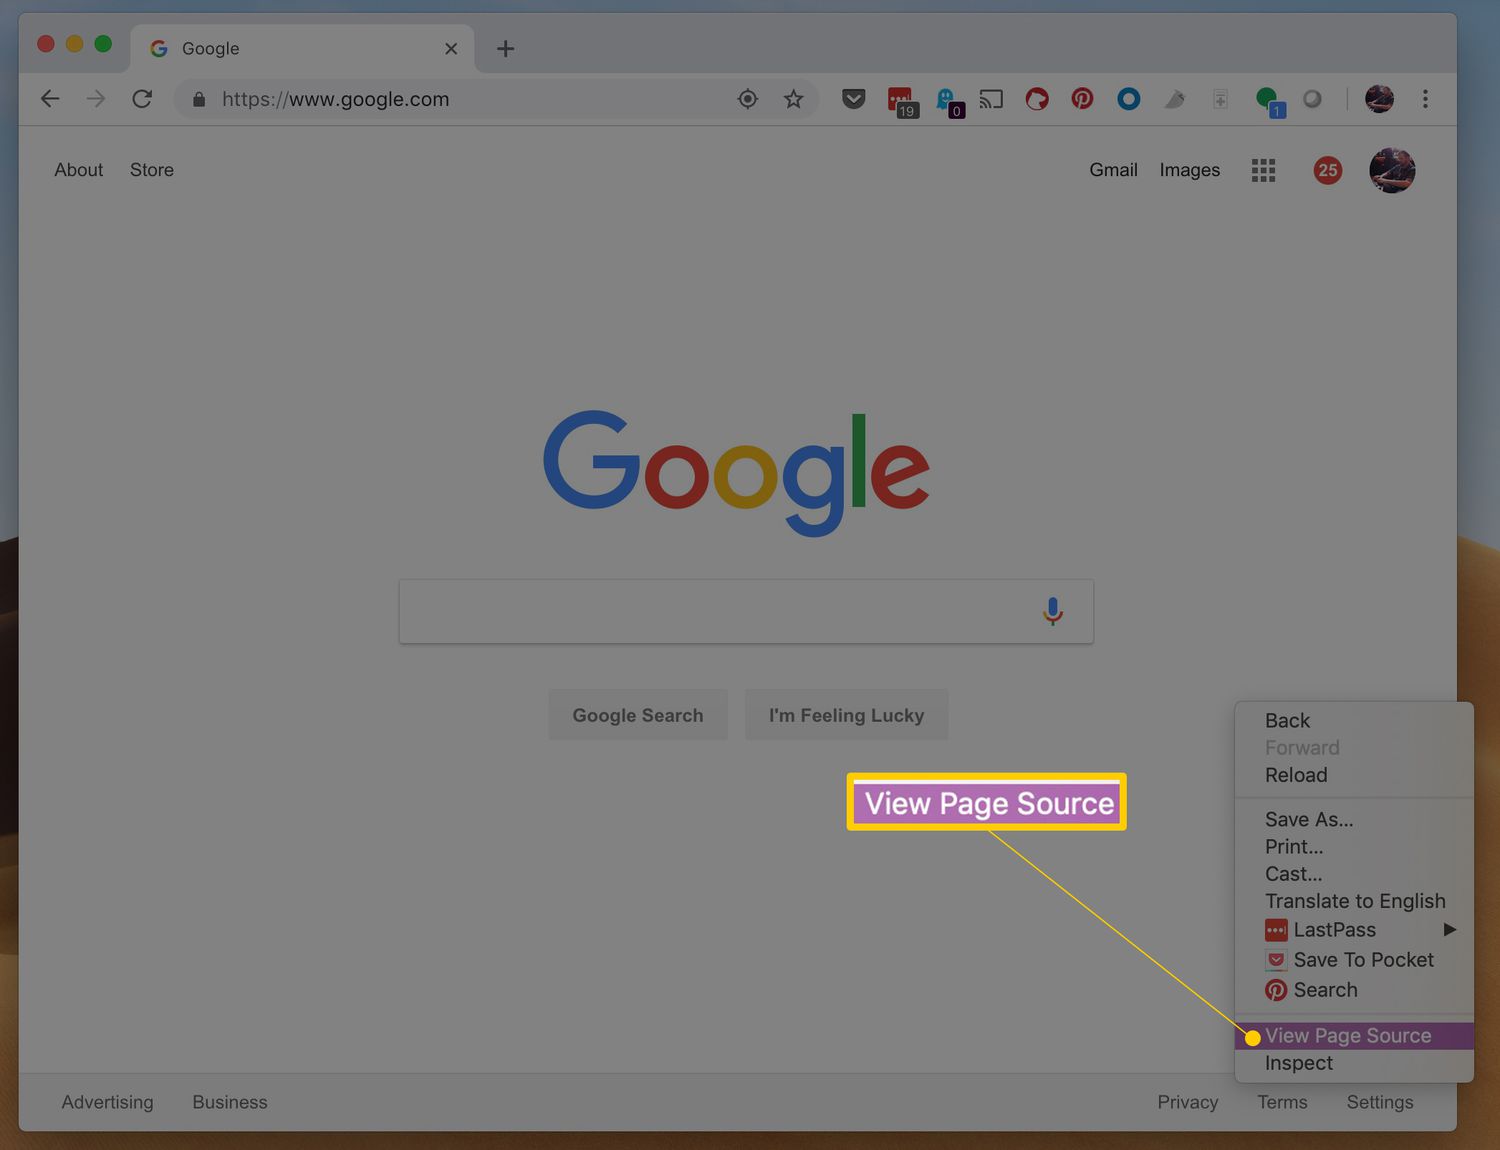
To view the page source in Chrome, simply right-click anywhere on the webpage and select "View Page Source" from the context menu. Alternatively, you can use the keyboard shortcut Ctrl+U (Windows/Linux) or Cmd+Option+U (Mac) to instantly reveal the page source in a new tab.
Upon opening the page source, you'll be presented with the raw HTML markup that defines the structure and content of the webpage. This includes tags, attributes, and textual content, providing a foundational understanding of how the webpage is organized and constructed. By examining the HTML source, you can identify key elements, such as headings, paragraphs, images, links, and more, gaining insights into the semantic structure and layout of the webpage.
In addition to HTML, the page source also exposes the embedded CSS styles and external CSS files linked to the webpage. This allows you to explore the styling rules, classes, and selectors that define the visual presentation of the content, shedding light on the aesthetic and design choices made by the web developers.
Furthermore, the page source unveils any embedded or linked JavaScript code, offering a glimpse into the interactive and dynamic aspects of the webpage. By examining the JavaScript source, you can uncover event handlers, functions, and scripts responsible for enhancing the user experience and functionality of the webpage.
By leveraging the ability to view the page source in Google Chrome, you can gain a deeper understanding of the underlying technologies and techniques used to craft a webpage. Whether you're a curious enthusiast, an aspiring web developer, or simply someone eager to unravel the mysteries of the web, the page source serves as a gateway to the inner workings of the digital realm, inviting you to explore, learn, and appreciate the artistry of web development.
Using Extensions
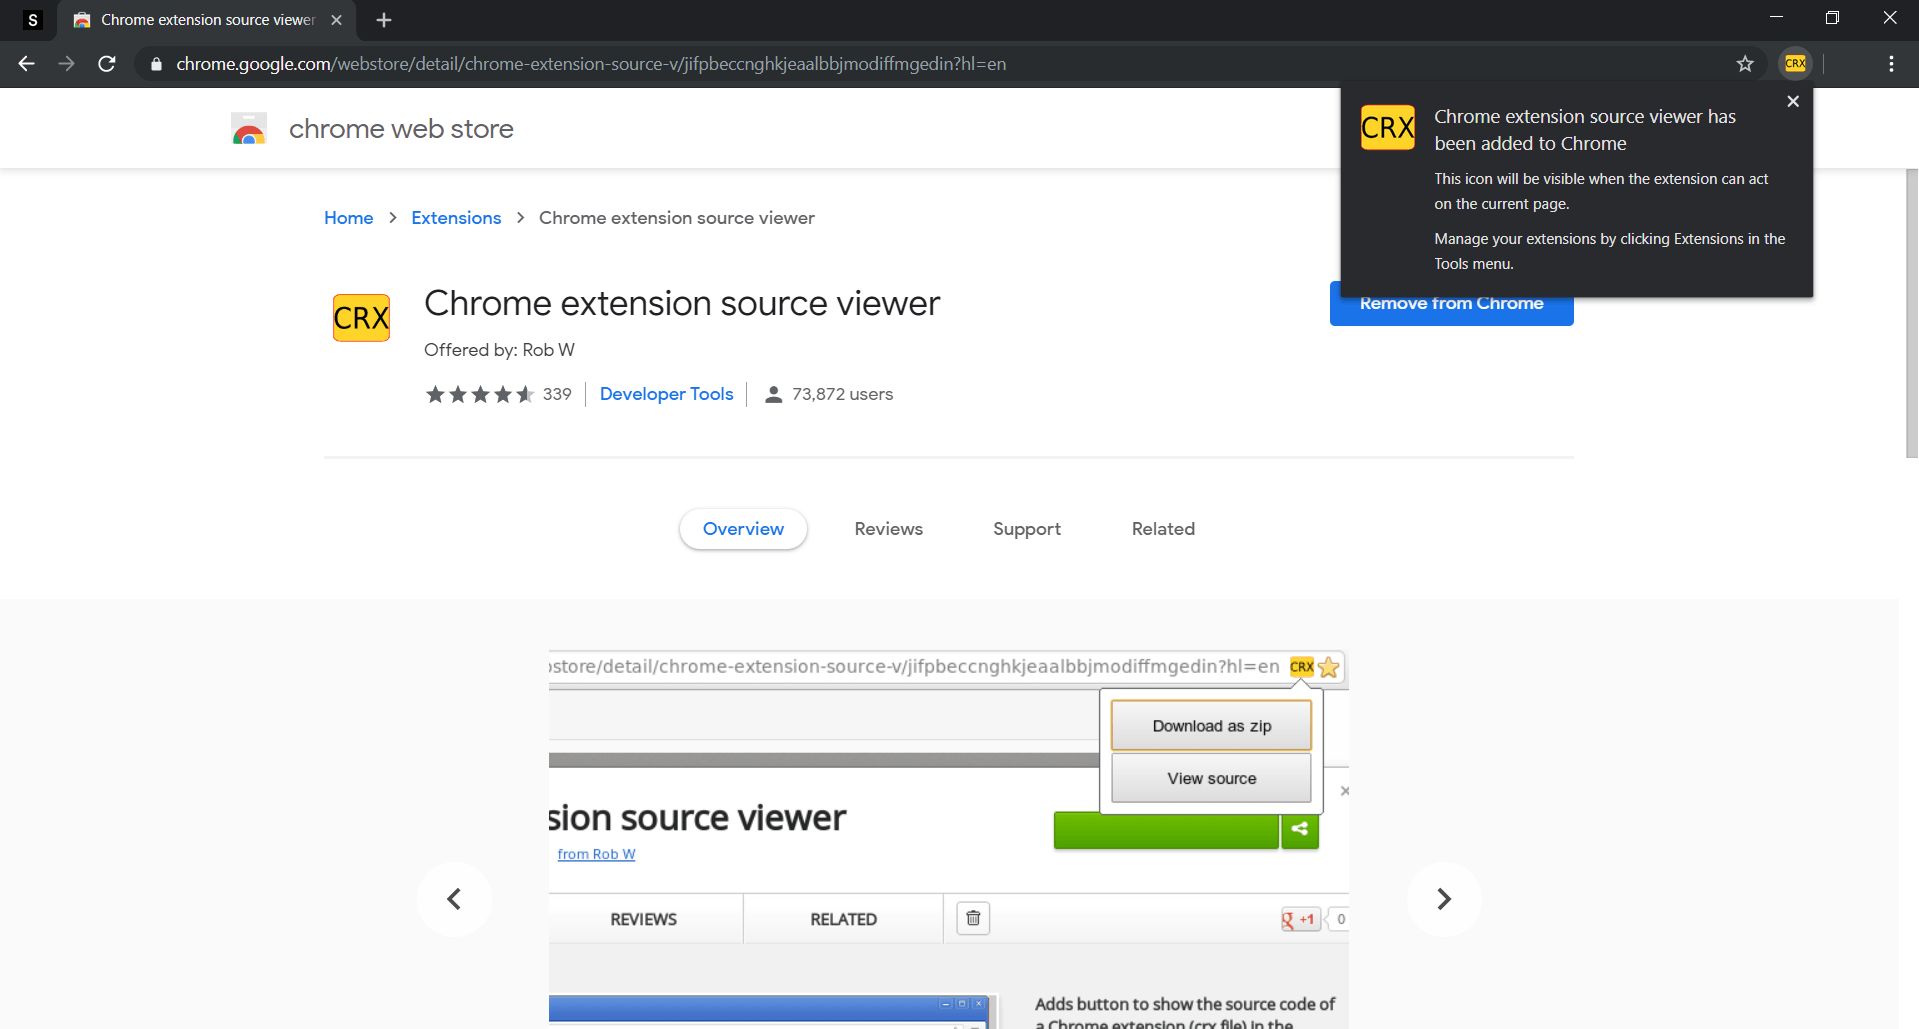
In addition to the built-in features and tools, Google Chrome offers a rich ecosystem of extensions that can further enhance your ability to view and interact with the code of webpages. These extensions, developed by a diverse community of creators, cater to a wide range of needs, from web development and debugging to accessibility and customization. By leveraging the power of extensions, you can expand the capabilities of your browser and gain new perspectives on the code that fuels the web.
One of the most popular extensions for web development is "Web Developer," which equips you with a plethora of tools for inspecting and manipulating webpages. From viewing the CSS and JavaScript of a webpage to analyzing its structure and performance, this extension empowers you to delve into the code with precision and ease. With features such as the ability to disable JavaScript, outline elements, and visualize the dimensions of the page, the "Web Developer" extension offers a comprehensive toolkit for dissecting and understanding the code behind the web.
For those interested in exploring the intricacies of CSS, the "CSSViewer" extension provides a convenient way to inspect the styles applied to elements on a webpage. By simply hovering over an element, you can instantly reveal its CSS properties, including dimensions, margins, padding, colors, and more. This intuitive extension streamlines the process of dissecting the visual presentation of a webpage, allowing you to gain insights into the styling decisions made by web developers.
Furthermore, the "Wappalyzer" extension offers a unique perspective by identifying the technologies and frameworks utilized by a webpage. By analyzing the page's headers, scripts, and other indicators, this extension uncovers the underlying technologies, such as content management systems, programming languages, and analytics tools, providing valuable insights into the technological landscape of the web.
In the realm of accessibility, the "axe" extension stands out as a powerful tool for identifying and addressing web accessibility issues. By running automated tests and providing detailed reports, this extension helps you ensure that webpages are inclusive and usable for all individuals, shedding light on potential accessibility barriers embedded in the code.
Whether you're a web developer seeking to streamline your workflow, an enthusiast eager to explore the inner workings of the web, or an advocate for inclusive design, the diverse array of extensions available for Google Chrome offers a wealth of opportunities to deepen your understanding of web development and expand your capabilities as a digital explorer. By integrating these extensions into your browsing experience, you can embark on a journey of discovery, insight, and empowerment, unlocking new dimensions of the web and the code that shapes its essence.