Introduction
Inspect Element is a powerful feature in Google Chrome that allows users to peek behind the curtains of a web page's structure and styles. Whether you're a web developer, designer, or simply curious about how a website is built, understanding how to inspect elements on Mac in Google Chrome can provide valuable insights and help you troubleshoot issues or experiment with design changes.
By delving into the underlying HTML and CSS of a web page, you can uncover the building blocks that make up its visual and interactive components. This can be particularly useful for identifying the source of layout problems, debugging code, or learning from the techniques used by other websites.
In this guide, we'll walk through the step-by-step process of inspecting elements on Mac using Google Chrome. By the end of this tutorial, you'll have a solid understanding of how to leverage the Inspect Element feature to explore and manipulate the structure and styles of web pages. So, let's dive in and unravel the mysteries of web development with Inspect Element!
Step 1: Open Google Chrome
To begin the process of inspecting elements on a web page using Google Chrome on your Mac, the first step is to open the Google Chrome browser. If Google Chrome is not already installed on your Mac, you can download and install it from the official website or the App Store.
Once Google Chrome is installed on your Mac, you can easily launch the browser by clicking on its icon in the dock or by searching for it using Spotlight. Alternatively, you can access Google Chrome from the Applications folder in Finder and double-click on the Chrome icon to open the browser.
Upon launching Google Chrome, you will be greeted by the familiar interface, featuring the address bar, tabs, and various navigation controls. The browser's clean and intuitive design provides a seamless user experience, making it a popular choice for web browsing and development tasks.
With Google Chrome up and running on your Mac, you are now ready to proceed to the next step in the process of inspecting elements on a web page. This involves navigating to the specific web page that you wish to inspect, allowing you to delve into its underlying structure and styles using the powerful developer tools provided by Google Chrome.
By following these simple steps, you can easily initiate the process of inspecting elements on a web page using Google Chrome on your Mac, setting the stage for a deeper exploration of web development and design. With the browser open and ready for action, you are well-equipped to embark on the journey of uncovering the secrets hidden within the code and layout of web pages.
Now that Google Chrome is at your fingertips, let's move on to the next step and delve into the fascinating world of web development with the Inspect Element feature.
Step 2: Navigate to the Web Page
Once Google Chrome is open on your Mac, the next step is to navigate to the web page that you want to inspect. This can be any website or web application that you wish to explore in terms of its underlying structure, layout, and styles.
You can easily navigate to a web page by entering the URL into the address bar at the top of the Google Chrome browser window. Alternatively, if you have previously visited the web page and it is part of your browsing history, you can access it by clicking on the website's entry in the history dropdown or by typing a few letters of the URL in the address bar to reveal the auto-complete suggestions.
Another way to navigate to a web page is by clicking on a bookmark or favorite link in your browser's bookmarks bar or by accessing it from your list of saved bookmarks. This provides quick and convenient access to frequently visited websites without the need to manually type in the full URL each time.
Furthermore, if you have the URL of the web page copied to your clipboard, you can simply paste it into the address bar and press Enter to load the page. This method is particularly useful when you receive a web link in an email, message, or document and want to quickly jump to the corresponding web page.
In addition to these methods, you can also perform a web search directly from the address bar by entering keywords related to the content or topic you are looking for. Google Chrome's integrated search functionality allows you to initiate a web search without visiting a search engine's website, streamlining the process of finding and accessing relevant web pages.
Once you have successfully navigated to the desired web page, it will be loaded and displayed within the Google Chrome browser window, ready for you to unleash the power of the Inspect Element feature. With the web page in view, you are now poised to move on to the next step and open the developer tools to begin inspecting its elements.
By following these simple navigation steps, you can effortlessly reach the web page of your choice and prepare to delve into its inner workings using Google Chrome's developer tools. With the destination set, you are now primed to embark on an exciting journey of exploration and discovery within the realm of web development and design.
Step 3: Open Developer Tools
With the web page loaded in Google Chrome on your Mac, the next crucial step in the process of inspecting elements is to open the Developer Tools. These tools provide a comprehensive suite of features and utilities that enable you to analyze, modify, and debug the structure and styles of web pages with precision and efficiency.
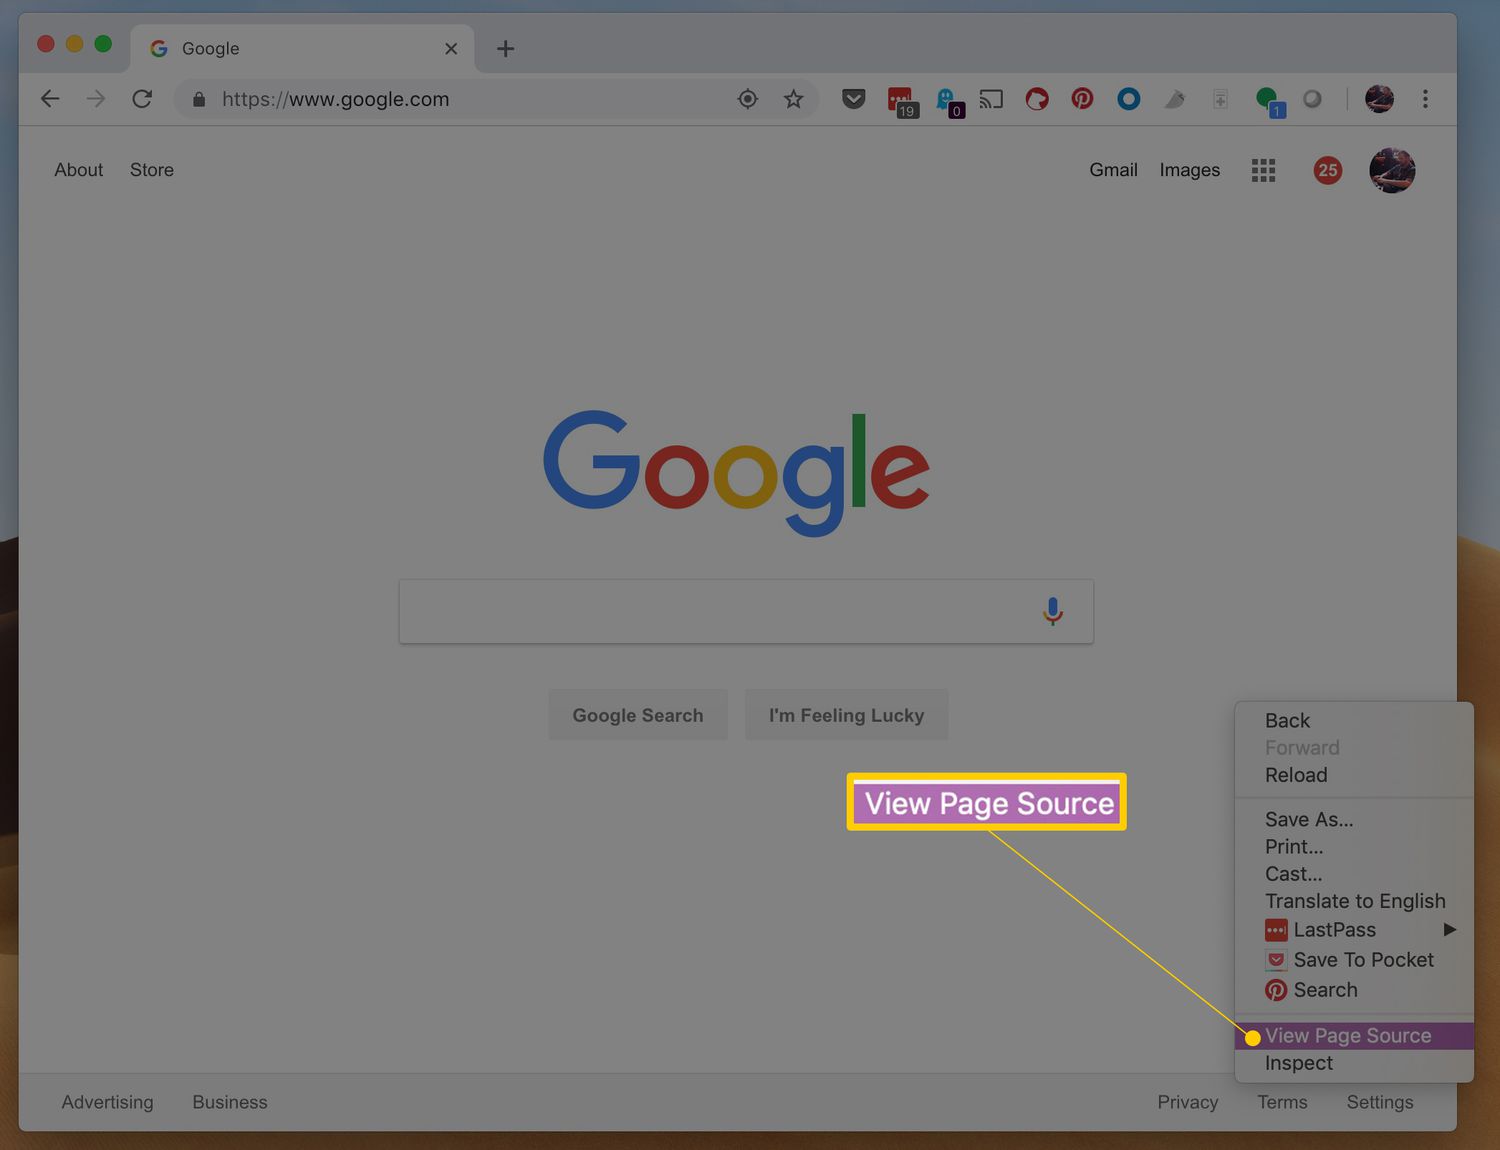
To open the Developer Tools in Google Chrome, you can use one of several methods. The most common approach is to right-click on any element within the web page and select "Inspect" from the context menu. This action will open the Developer Tools panel, displaying the HTML and CSS code associated with the selected element, along with a range of additional tools and tabs for inspecting and manipulating the web page.
Alternatively, you can access the Developer Tools by using the keyboard shortcut Command + Option + I. This quick shortcut provides instant access to the powerful suite of web development and debugging tools, allowing you to seamlessly transition from browsing the web to analyzing and modifying web page elements.
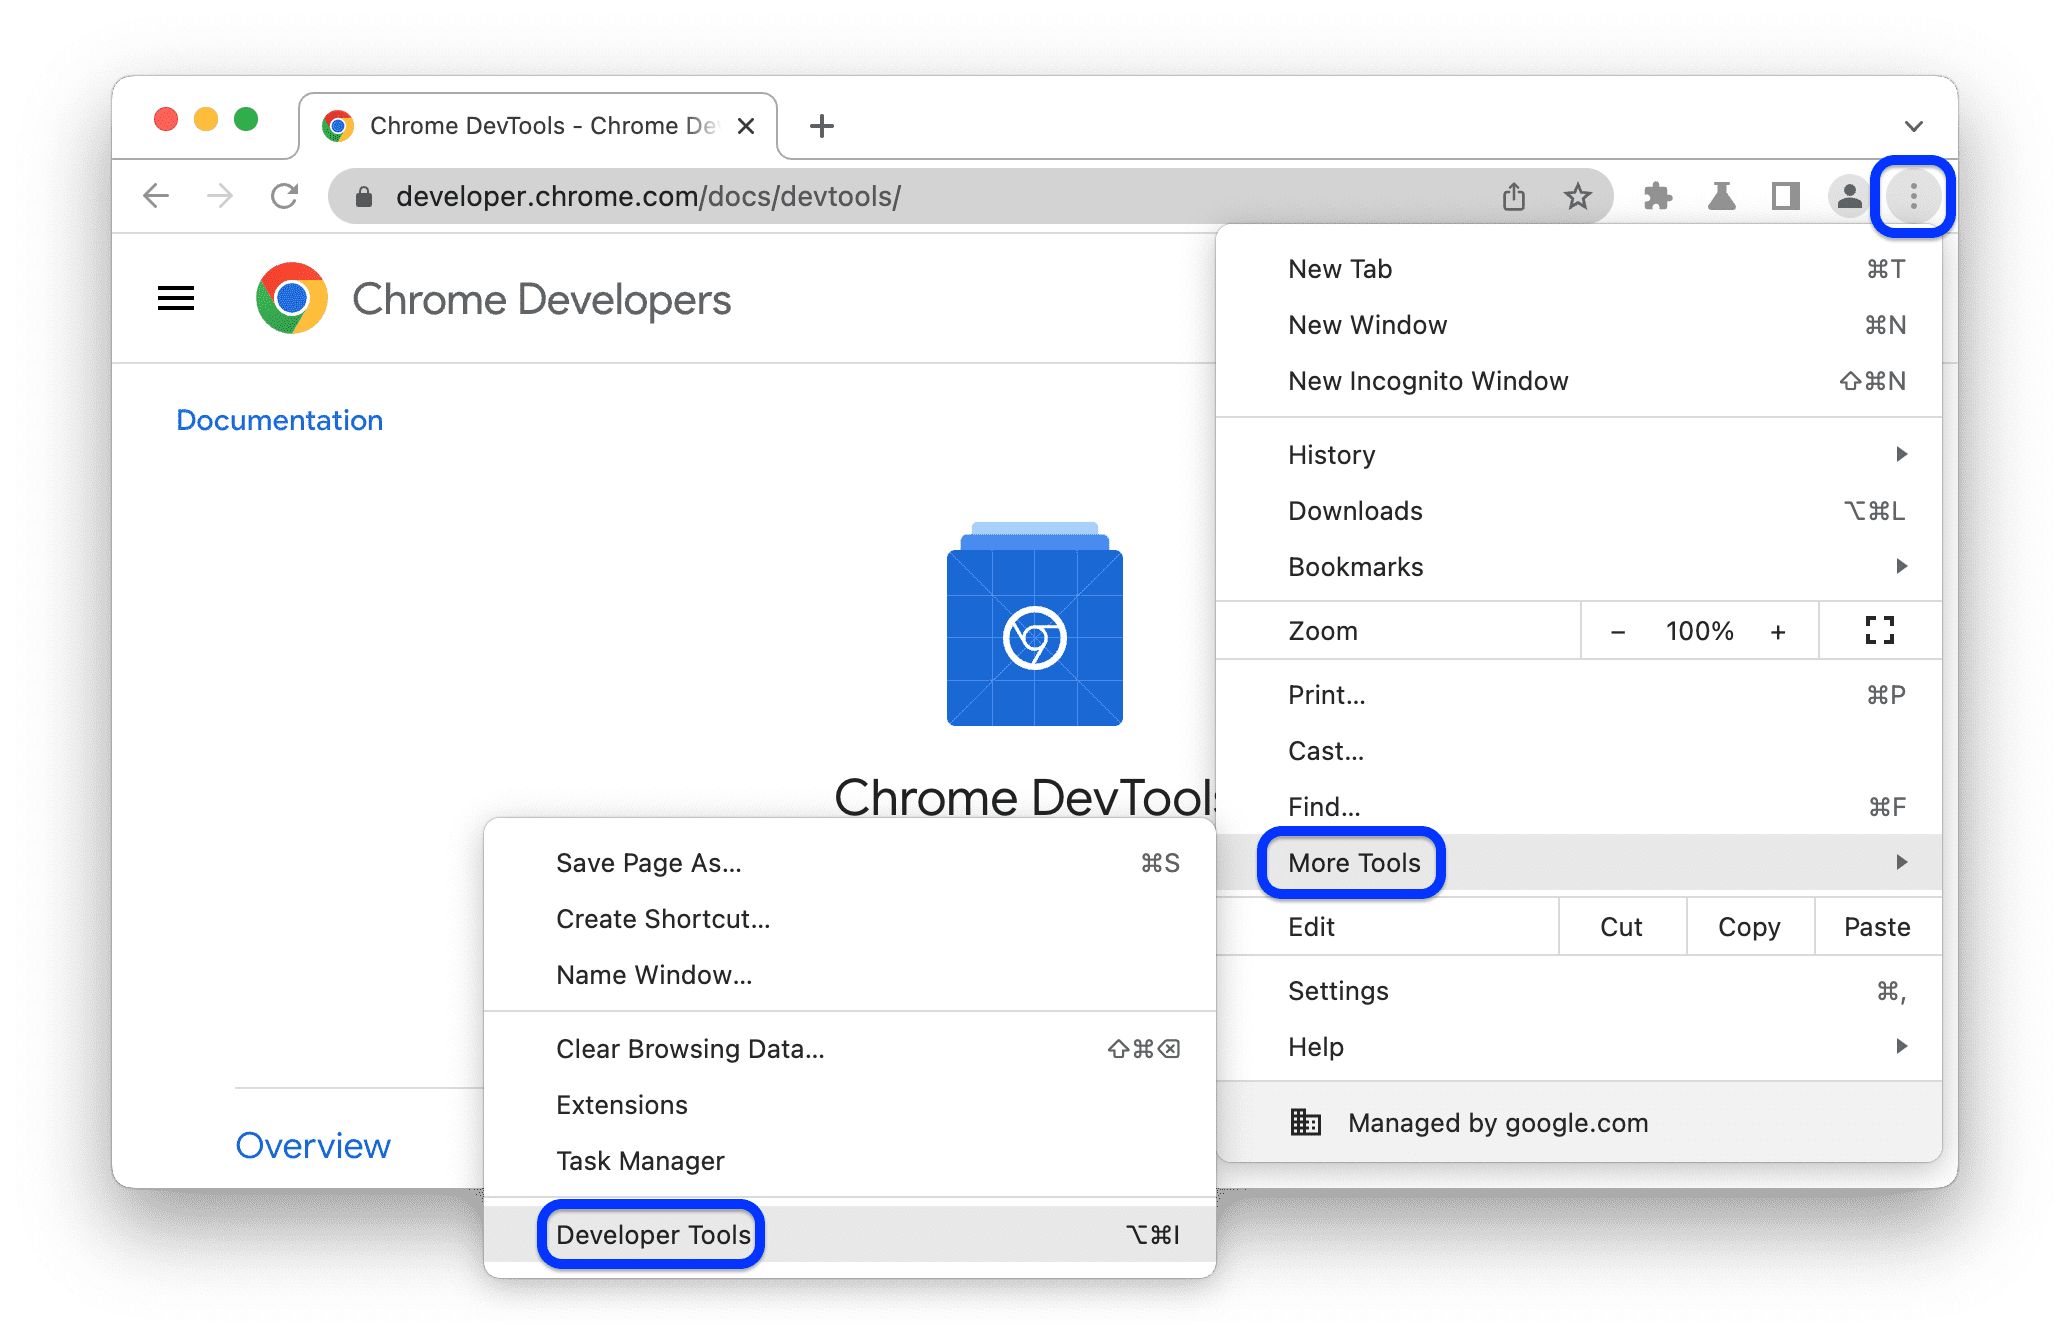
Another method to open the Developer Tools is by clicking on the three-dot menu icon in the top-right corner of the Google Chrome window, selecting "More Tools," and then choosing "Developer Tools" from the submenu. This approach offers a convenient way to access the full range of developer-oriented features and utilities provided by Google Chrome.
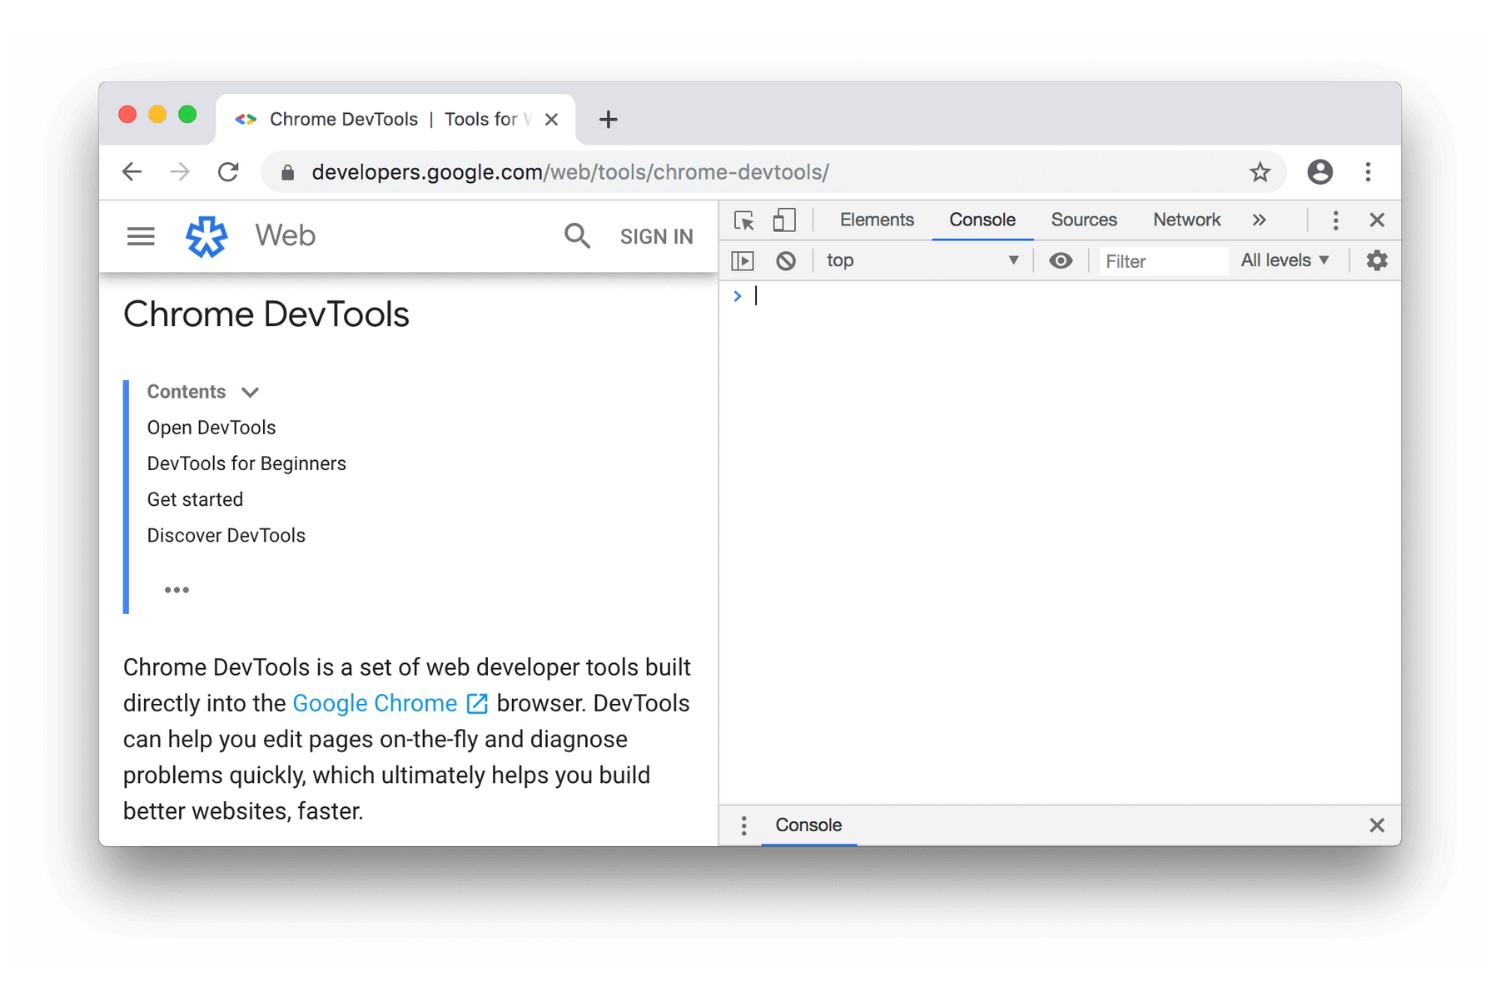
Upon opening the Developer Tools, you will be presented with a wealth of information and functionality, including the Elements panel for inspecting and modifying the HTML and CSS, the Console for logging and debugging JavaScript code, the Sources panel for examining and debugging the page's resources, and various other tabs and tools for performance analysis, network monitoring, and more.
The Developer Tools interface is designed to empower web developers and designers with the insights and capabilities needed to understand, troubleshoot, and enhance the functionality and appearance of web pages. By mastering the art of navigating and utilizing the Developer Tools, you can gain a deeper understanding of web development principles and techniques, enabling you to elevate your skills and create exceptional web experiences.
With the Developer Tools now open and ready for action, you are poised to delve into the heart of web page inspection and manipulation, setting the stage for an immersive and enlightening exploration of web development with Google Chrome on your Mac. As you continue on this journey, you will uncover the intricacies of web page elements and gain valuable insights that can propel your understanding and proficiency in the dynamic field of web development and design.
Step 4: Inspect Element
When it comes to web development and design, the ability to inspect elements is a fundamental skill that empowers developers and designers to understand and manipulate the building blocks of web pages. With Google Chrome's Inspect Element feature, you can gain deep insights into the underlying HTML and CSS of a web page, allowing you to identify elements, analyze styles, and make real-time modifications for experimentation and troubleshooting.
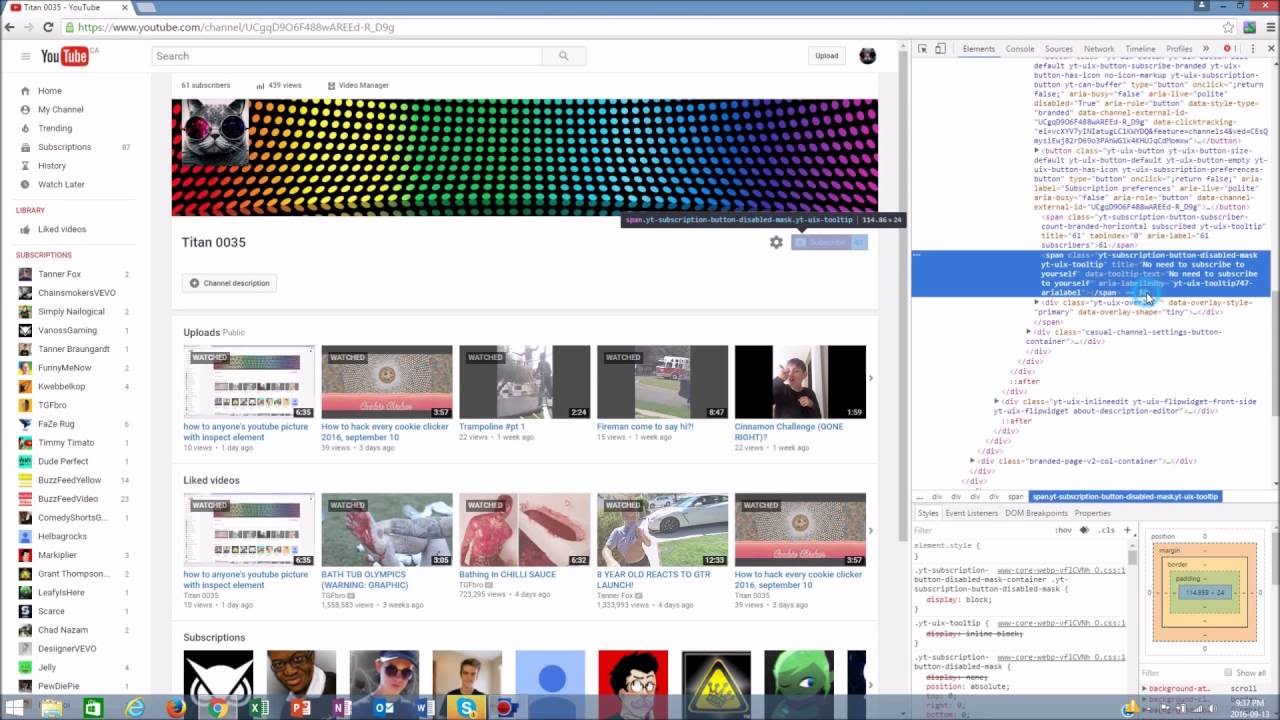
Upon opening the Developer Tools in Google Chrome on your Mac, you can navigate to the "Elements" panel, where the magic of inspecting elements unfolds. The Elements panel presents a visual representation of the web page's structure, displaying the HTML markup and associated CSS styles in a hierarchical and interactive format. This intuitive interface enables you to explore the composition of the web page and gain a clear understanding of its elements and styling rules.
As you hover over different elements within the Elements panel, corresponding sections of the web page are highlighted, providing a visual correlation between the HTML structure and the rendered content. This dynamic highlighting feature facilitates the identification and selection of specific elements, making it easier to pinpoint the exact components you wish to inspect or modify.
By clicking on an element within the Elements panel, you can reveal and manipulate its associated HTML code and CSS styles in real time. This interactive capability allows you to experiment with changes to the element's attributes, such as dimensions, colors, margins, and positioning, and instantly observe the impact on the web page's appearance and layout.
Furthermore, the Inspect Element feature provides a wealth of contextual information and tools to aid in the inspection and modification process. You can view and edit the CSS styles applied to an element, examine its box model properties, inspect its event listeners, and even visualize the computed styles and layout of the element, offering a comprehensive toolkit for in-depth analysis and experimentation.
In addition to inspecting individual elements, you can also traverse the DOM (Document Object Model) tree within the Elements panel, allowing you to navigate through the hierarchical structure of the web page and gain a holistic view of its composition. This capability is invaluable for understanding the relationships between different elements and their positioning within the overall document structure.
With the power of Inspect Element at your fingertips, you can unravel the intricacies of web page elements, gain valuable insights into their styling and behavior, and experiment with dynamic modifications to refine the visual and interactive aspects of web design. This hands-on approach to inspecting elements empowers you to refine your web development skills and gain a deeper appreciation for the art and science of crafting compelling web experiences.
As you continue to explore and leverage the Inspect Element feature in Google Chrome on your Mac, you will unlock a world of possibilities for honing your web development and design expertise, enabling you to create impactful and visually stunning web experiences that captivate and engage users.
Step 5: Use the Inspector Panel
The Inspector Panel, also known as the Elements panel, is a pivotal component of Google Chrome's Developer Tools that empowers web developers and designers to delve into the intricate details of web page elements. This versatile panel serves as a command center for inspecting, analyzing, and manipulating the HTML and CSS that define the visual and interactive aspects of a web page.
Upon accessing the Inspector Panel within the Developer Tools, you are greeted with a visually rich and interactive interface that provides a comprehensive view of the web page's structure and styling. The panel is divided into two main sections: the HTML markup view and the CSS styles view, offering a seamless workflow for inspecting and modifying elements.
In the HTML markup view, the hierarchical structure of the web page's elements is presented in a tree-like format, allowing you to navigate through the DOM (Document Object Model) and gain a clear understanding of how different elements are nested and organized within the document. This visual representation facilitates the identification of specific elements and their relationships, enabling you to pinpoint the exact components you wish to inspect or modify.
Switching to the CSS styles view, you are presented with a detailed breakdown of the CSS rules that apply to the selected element. This includes the element's inherited styles, user-agent styles, and any additional styles defined within the web page or linked stylesheets. The intuitive interface of the CSS styles view allows you to explore and manipulate the styling properties of elements, such as colors, fonts, margins, padding, and positioning, with real-time feedback on the web page's appearance.
Furthermore, the Inspector Panel offers a range of interactive features and tools to streamline the inspection and modification process. You can edit CSS styles directly within the panel, add new styles, disable existing styles to observe their impact, and even experiment with pseudo-classes and pseudo-elements to refine the visual presentation of elements.
The Inspector Panel's dynamic highlighting feature provides visual feedback as you hover over different elements within the HTML markup view, correlating the structural representation with the rendered content on the web page. This seamless integration between the visual and code-based representations of elements enhances the precision and efficiency of inspecting and manipulating web page elements.
By leveraging the capabilities of the Inspector Panel, you can gain a profound understanding of the underlying structure and styles of web page elements, enabling you to troubleshoot layout issues, experiment with design changes, and refine the user experience. This immersive exploration of the Inspector Panel empowers you to elevate your web development and design skills, fostering a deeper appreciation for the art and science of crafting compelling web experiences.
As you continue to harness the power of the Inspector Panel within Google Chrome's Developer Tools, you will unlock a wealth of opportunities to refine your web development expertise and create visually stunning web experiences that resonate with users.
Step 6: Make Changes and Save
Once you have inspected and analyzed the elements of a web page using Google Chrome's Developer Tools, you can proceed to make dynamic changes to the HTML and CSS, allowing you to experiment with design modifications and troubleshoot layout issues in real time. The ability to manipulate elements and styles directly within the browser empowers you to refine the visual presentation and interactive behavior of web pages, fostering a deeper understanding of web development principles and techniques.
After identifying the specific element or style you wish to modify within the Inspector Panel, you can seamlessly edit the associated HTML or CSS code by double-clicking on the relevant section. This action activates an inline editing mode, enabling you to directly modify the code and observe the immediate impact on the web page's appearance and layout. Whether you are adjusting the content of an HTML element, refining the styling properties of a CSS rule, or experimenting with new design concepts, the inline editing feature provides a fluid and intuitive workflow for making dynamic changes.
As you make modifications to the HTML and CSS, the web page instantly reflects the updated elements and styles, allowing you to visually assess the effects of your changes in real time. This live feedback loop facilitates iterative experimentation and refinement, empowering you to fine-tune the visual presentation and user experience of the web page with precision and agility. By observing the immediate results of your modifications, you can gain valuable insights into the cause-and-effect relationships between code changes and visual outcomes, deepening your understanding of web development dynamics.
Furthermore, Google Chrome's Developer Tools offer the capability to save your modifications directly to the local copy of the web page, providing a convenient way to preserve your experimental changes for future reference or sharing with collaborators. The "Local Overrides" feature allows you to persistently store your edits to the HTML, CSS, and JavaScript of a web page, ensuring that your modifications are retained across browser sessions. This functionality streamlines the process of prototyping design variations, testing layout adjustments, and documenting troubleshooting solutions, empowering you to maintain a comprehensive record of your development endeavors.
By leveraging the power of making changes and saving within Google Chrome's Developer Tools, you can cultivate a hands-on approach to web development and design, enabling you to refine your skills, troubleshoot issues, and experiment with innovative design concepts. This immersive experience fosters a deeper connection with the intricacies of web development, empowering you to create captivating and impactful web experiences that resonate with users.