Introduction
Welcome to the world of Google Analytics! If you’re eager to delve into the data behind your website or app performance, you’ve come to the right place. Google Analytics is a powerful tool that provides valuable insights into your user activity, traffic sources, conversions, and much more. It allows you to make informed decisions and optimize your digital presence for better results.
In this guide, we’ll walk you through the process of downloading data from Google Analytics, so you can analyze it further or share it with your team for reporting purposes. Whether you’re a beginner or have some experience with Google Analytics, these steps will help you unlock the valuable data at your fingertips.
Before we jump into the process, ensure that you have access to a Google Analytics account and have the necessary permissions to view and download data. If you’re new to Google Analytics, you’ll need to get your website or app connected to it. Once that’s sorted, let’s get started on the journey to downloading your Google Analytics data!
Step 1: Log in to Google Analytics
The first step in downloading your Google Analytics data is to log in to your Google Analytics account. Open your preferred web browser on your computer and navigate to the Google Analytics website. If you don’t have an account yet, you’ll need to create one by clicking on the “Start for free” button and following the instructions.
Once you’re on the Google Analytics login page, enter your email address and password associated with your Google account. If you have multiple Google accounts, make sure you’re using the correct one that has access to your Google Analytics account. Click on the “Next” button to proceed.
If you have two-factor authentication enabled for your Google account, you may be prompted to enter the verification code sent to your mobile device or email. Enter the code and click on the “Verify” button to continue.
After successfully logging in to your Google Analytics account, you’ll land on the Account Home page. Here, you’ll see a list of all the websites or apps that are connected to your Google Analytics account. Select the website or app for which you want to download the data by clicking on its name or the “View Reporting” button next to it.
Once you’re in the reporting view, you’re ready to move on to the next step in the process. Remember to keep your login details secure and avoid sharing them with unauthorized individuals.
Step 2: Choose the website or app you want to download data from
Now that you’re logged in to your Google Analytics account, it’s time to choose the specific website or app for which you want to download the data. In the reporting view, you’ll see a dropdown menu at the top left-hand corner of the page, labeled “All Web Site Data” or “All Apps Data,” depending on your setup.
Click on the dropdown menu to see a list of all the websites or apps connected to your Google Analytics account. Scroll through the options and select the one that you want to download data from. If you have a large number of websites or apps, you can use the search bar provided to quickly locate the one you’re looking for.
Once you select the desired website or app, the reporting view will update to show the data specific to that property. You’ll notice the change in the website or app name displayed at the top of the page, confirming that you’re now viewing data for the selected property.
Choosing the correct website or app is crucial to ensure that you download the accurate data. If you have multiple properties and want data for more than one, you’ll need to repeat the process for each property individually.
Now that you’ve chosen the website or app, you’re ready to move on to the next step and explore the various reports and data that Google Analytics offers.
Step 3: Navigate to the Reports section
Once you’ve selected the website or app you want to download data from, it’s time to navigate to the Reports section in Google Analytics. The Reports section provides a comprehensive view of various metrics and dimensions related to your website or app’s performance.
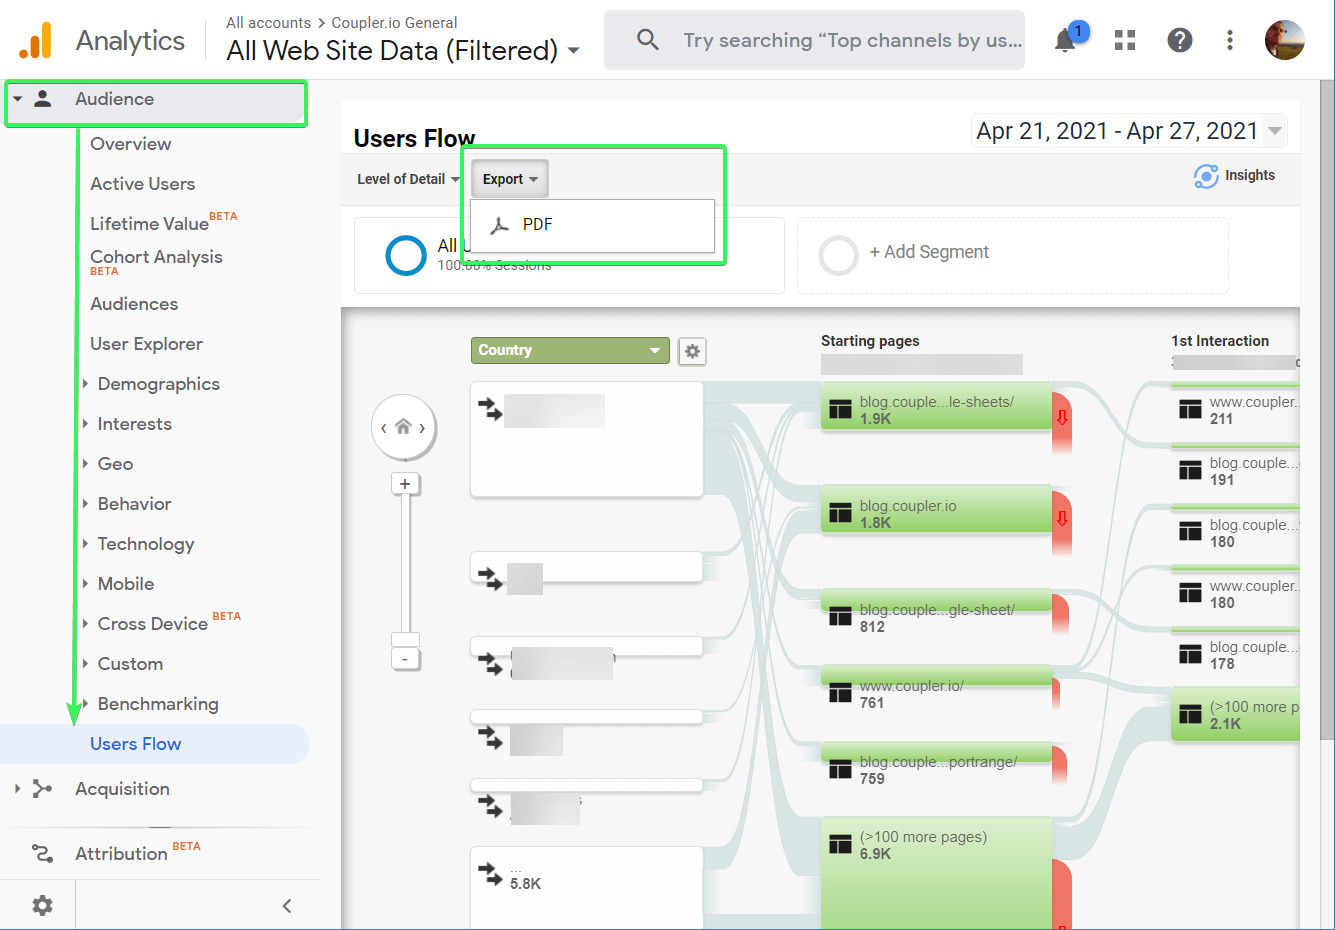
To access the Reports section, look for the sidebar on the left-hand side of the page. You’ll see a list of different categories such as Real-Time, Audience, Acquisition, Behavior, and Conversions. These categories represent different aspects of your data.
Click on any of the categories to expand it and reveal a sub-menu containing additional reports and data options. Depending on the category you select, you’ll have access to various reports that offer insights into different aspects of your website or app’s performance.
For example, under the Audience category, you can explore reports like Overview, Active Users, Demographics, and Interests. Each report provides valuable information about your website or app’s visitors, their demographics, and their interests.
Take some time to familiarize yourself with the different reports and categories available in Google Analytics. This will help you navigate and find the specific data you’re interested in downloading. You can click on each report to explore the metrics, dimensions, and visualizations they offer.
Navigating to the Reports section is an important step in the process as it allows you to choose the specific data you want to download. Once you’ve found the report that contains the desired data, you’re ready to move on to the next step and select the specific data to download.
Step 4: Select the specific data you want to download
Now that you’re in the Reports section of Google Analytics, it’s time to select the specific data that you want to download. Google Analytics offers a wide range of reports and data options, allowing you to access granular details about your website or app’s performance.
Within each report, you’ll find different metrics, dimensions, and visualization options. The metrics represent the quantitative data points, such as pageviews, sessions, bounce rate, and conversion rate. The dimensions provide additional context to the metrics and allow you to analyze the data based on different criteria, such as traffic source, device category, or geographical location.
To select the specific data you want to download, navigate to the report that contains the desired information. For example, if you’re interested in downloading data related to the number of pageviews, you can access the Behavior category and click on the Site Content report.
Once you’re in the desired report, look for the specific metrics and dimensions you want to include in your download. You can select multiple metrics and dimensions to customize the data further.
For instance, you might want to download the number of pageviews, bounce rate, and average time on page for a particular time period. By selecting these metrics, you’ll be able to analyze the performance of your website or app in terms of user engagement and content consumption.
Remember to consider your specific goals and objectives when selecting the data. This will help you focus on the information that is most relevant to your needs and avoid overwhelming yourself with excessive data.
Once you’ve chosen the specific metrics and dimensions, you’re ready to customize the data further with filters and segments in the next step.
Step 5: Customize your data with filters and segments
To dive deeper into your data and extract more specific insights, Google Analytics allows you to customize your data with filters and segments. Filters and segments help you refine your data by applying certain criteria or conditions, allowing you to focus on specific subsets of your audience or specific actions taken on your website or app.
To customize your data, click on the “Add Segment” button or the “Add Filter” button, depending on which option you want to use.
If you choose to add a segment, you can select from a variety of predefined segments or create your own custom segment. Predefined segments include options like “Paid Traffic,” “Mobile Traffic,” or “New Users,” providing a quick way to segment your data based on common criteria.
If you prefer to add a filter, you can apply specific conditions to include or exclude certain data in your download. Filters can be based on dimensions like traffic source, device category, or location. For example, you might want to download data only for users from a specific country or data only for organic traffic.
By customizing your data with filters and segments, you can gain a more detailed understanding of specific user segments, their behaviors, and the impact of different marketing initiatives on your website or app’s performance.
Experiment with different filters and segments to see how they affect your data. You can add multiple filters and segments to create highly targeted data sets that meet your specific analysis requirements.
Once you have customized your data with filters and segments, you’re ready to move on to the next step and set the date range for your data.
Step 6: Set the date range for your data
Setting the date range for your data is an essential step in downloading data from Google Analytics. It allows you to specify the time period for which you want to retrieve data, whether it’s a single day, a week, a month, or a custom range.
To set the date range, look for the calendar icon or the date range selector at the top right-hand corner of the page. Click on it to open the date range options.
Google Analytics provides several predefined date range options, such as “Today,” “Yesterday,” “Last 7 days,” “Last month,” or “Custom.” These options make it easy to quickly select common time frames for your analysis.
If the predefined options don’t meet your needs, you can choose the “Custom” option to specify a custom date range. This allows you to input specific start and end dates to download data from a more specific time period.
Keep in mind that the availability of historical data in Google Analytics depends on the date range you select. For example, if you choose a longer time range, some of the detailed data may not be available for the earlier dates due to data processing limits.
Select a date range that aligns with your analysis goals and the timeframe during which you want to analyze your website or app’s performance.
Once you’ve set the date range, the data displayed in the reports will be adjusted accordingly. Make sure to double-check that the selected date range matches your desired timeframe before proceeding to the next step.
Now that you’ve set the date range, you’re ready to move on to the next step and choose the file format for your download.
Step 7: Choose the file format for your download
Once you’ve customized your data and set the desired date range, it’s time to choose the file format for your download. Google Analytics offers multiple file format options, allowing you to select the format that best suits your needs and preferences.
To choose the file format, look for the export or download button in the reporting view. Clicking on this button will open a menu or dialogue box with various download options.
The most common file formats available for download in Google Analytics include CSV (Comma Separated Values), Excel (XLSX), PDF (Portable Document Format), and Google Sheets. Each format has its own advantages and limitations, so consider the intended use of the downloaded data when making your selection.
If you’re planning to further analyze and manipulate the data in programs like Microsoft Excel or Google Sheets, the CSV or Excel format would be a suitable choice. These formats allow for easy importing and data manipulation in spreadsheet applications.
On the other hand, if you need a formatted and presentable version of the data for sharing or reporting purposes, the PDF format might be more appropriate. PDFs can retain the visual formatting of the reports and make it easier to share data with stakeholders.
Consider the compatibility and functionality of each format with the tools you’ll be using for data analysis and presenting the information.
Once you’ve selected the desired file format, click the download or export button to initiate the download. The file will be saved to your computer or device in the chosen format, ready for further analysis or sharing.
Now that you’ve chosen the file format for your download, it’s time to select the destination where you want to save the downloaded file.
Step 8: Select the destination for your download
After selecting the file format for your download, the next step is to choose the destination where you want to save the downloaded file. Google Analytics provides you with options to save the file to your computer or device, or directly to a cloud storage service.
When you click the download or export button, a dialogue box will appear, giving you the choice to specify the location where you want to save the file.
If you prefer to save the file to your computer or device, choose the appropriate folder or directory where you want to store it. You may want to create a dedicated folder for your Google Analytics downloads to keep them organized and easily accessible in the future.
On the other hand, if you prefer the convenience and accessibility of cloud storage services, such as Google Drive or Dropbox, you can select the desired service from the options provided. This will store the downloaded file directly in the connected cloud storage account.
Storing the file in the cloud provides the advantage of easy sharing and access from multiple devices. It also ensures that your downloaded data is securely backed up, reducing the risk of data loss.
Consider your workflow and preferences when deciding on the destination for your download. Choose a location that will allow you to easily locate and utilize the downloaded data for future analysis and reporting.
Once you’ve selected the destination for your download, click the appropriate button to initiate the saving process. The file will be saved to the chosen location, ready for you to access and analyze.
Now that you’ve successfully selected the destination for your download, it’s time to move on to the final step and confirm and start the download process.
Step 9: Confirm and start the download
Before you can download your data from Google Analytics, it’s important to take a moment to confirm your selections and review the download settings. This final step ensures that you have everything in order and are ready to retrieve the desired data.
Double-check the chosen data, including the website or app, the selected metrics and dimensions, the date range, and the file format. Verify that these settings align with your intended analysis goals and that you have selected the correct options.
Once you have reviewed and confirmed your selections, it’s time to initiate the download process. Click on the “Download” or “Export” button to start the download.
Depending on the size of the data and the selected file format, the download process may take a few seconds or longer. Be patient while the data is being compiled and prepared for download.
While the download is in progress, make sure to keep the browser window open and avoid navigating away from the page to ensure a successful download. Interrupting the process may result in an incomplete or corrupted download.
Once the download is complete, a notification or prompt will appear, indicating that your file is ready for access. The name of the downloaded file will typically reflect the chosen settings, such as the website or app, the date range, and the file format.
Navigate to the chosen destination where you saved the file, whether it’s on your computer, in a specific folder, or in a cloud storage account. Locate the downloaded file and open it using the appropriate program or application based on the selected file format.
Now that you have successfully confirmed and started the download process, you can begin analyzing the downloaded data, extracting insights, and using them to make data-driven decisions to optimize your website or app’s performance.
Congratulations on successfully downloading your Google Analytics data!
Conclusion
Downloading data from Google Analytics is a crucial step in gaining insights into your website or app’s performance. This guide has walked you through the process, starting from logging in to your Google Analytics account, selecting the specific website or app, navigating to the Reports section, customizing the data, setting the date range, choosing the file format, selecting the destination, and finally confirming and initiating the download.
By following these steps, you can access detailed metrics and dimensions related to your audience, traffic sources, user behavior, conversions, and more. Customizing your data with filters and segments allows you to analyze specific subsets of your audience or actions taken on your website or app.
Moreover, setting the date range ensures that you retrieve data for the desired timeframe, whether it’s a day, a week, or a custom period. Choosing the appropriate file format and designating the destination for your download ensures easy access, organization, and sharing of the downloaded data.
Remember to review and confirm your selections before starting the download to ensure accuracy and completeness. Once the download is complete, you can delve into the data, uncover valuable insights, and make data-driven decisions to improve your website or app’s performance.
Now that you’re equipped with the knowledge of how to download data from Google Analytics, leverage this powerful tool to gain a better understanding of your digital presence and refine your strategies for success. Happy analyzing!