Introduction
Welcome to our comprehensive guide on how to import data from Splitwise to Excel. If you’re an avid Splitwise user looking to analyze and manipulate your expense data in a more organized and customizable manner, you’ve come to the right place. Splitwise is a popular expense tracking application that allows users to split bills, track expenses, and settle debts with friends or roommates. By importing Splitwise data into Excel, you can take your expense management to the next level by leveraging the powerful features and functionalities of Excel.
Excel, with its ability to handle large datasets and perform complex calculations, provides a perfect platform for organizing and analyzing your Splitwise data. With Excel, you can create personalized reports, visualize your expenses through charts and graphs, and gain valuable insights into your spending patterns. Whether you want to track your personal expenses, manage shared finances, or create a budget, importing Splitwise data into Excel can streamline your financial management process.
In this guide, we will walk you through the step-by-step process of exporting data from Splitwise and importing it into Excel. We will also cover techniques for organizing, formatting, analyzing, and manipulating the imported data to extract meaningful information. By the end of this guide, you will have a thorough understanding of how to import and utilize your Splitwise data in Excel.
Before we dive into the details, please note that the import process may vary slightly depending on the version of Excel you are using and the format of the Splitwise export file. However, the general principles and techniques discussed in this guide should apply to most versions of Excel. So, whether you’re using Excel 2016, Excel 2019, or even an earlier version, you’ll be able to follow along and import your Splitwise data successfully. Let’s get started!
Step 1: Exporting Data from Splitwise
To begin importing your Splitwise data into Excel, the first step is to export the necessary data from Splitwise. Splitwise provides an option to export your data in a CSV (Comma Separated Values) format, which can be easily imported into Excel.
Here’s a step-by-step guide on how to export your data from Splitwise:
- Log in to your Splitwise account using your credentials.
- Once you’re logged in, navigate to the “Settings” section of your account.
- In the Settings menu, you’ll find an option called “Export Data.” Click on it to proceed.
- Select the date range for which you want to export your expenses. You can choose a specific date range or export all your data.
- Choose the “CSV” file format for the export. CSV format is the most compatible format for importing into Excel.
- Click on the “Export” button to generate the CSV file. Depending on the amount of data you have, it may take a few moments to generate the file.
- Once the export is complete, you’ll receive a link to download the CSV file. Click on the link to download the file to your computer.
Make sure to save the downloaded CSV file in a location on your computer where you can easily locate it. Now that you have successfully exported your Splitwise data, you’re ready to move on to the next step of importing it into Excel.
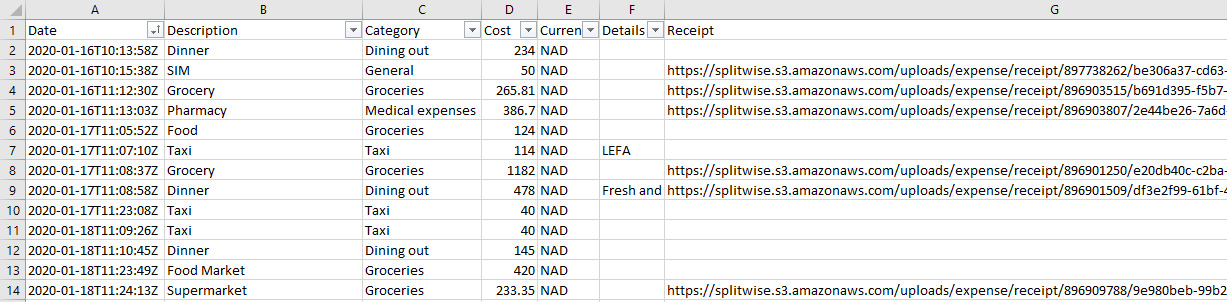
It’s important to note that Splitwise exports your data in a specific format, which includes information such as the date of the expense, the description, the amount, and any applicable categories or tags. This ensures that you have all the necessary data for further analysis and manipulation in Excel.
Now that you have successfully exported your Splitwise data, let’s move on to the next step of setting up Excel for importing and analyzing the data.
Step 2: Setting Up Excel
Before you can import your Splitwise data into Excel, you need to ensure that your Excel workbook is properly set up to receive the imported data. Here’s how you can set up Excel:
- Open Microsoft Excel on your computer.
- Create a new workbook or open an existing workbook where you want to import the Splitwise data.
- Ensure that the column headers in your Excel workbook match the data fields in the exported Splitwise CSV file. The column headers in the CSV file typically include fields such as Date, Description, Amount, Category, and Tags. It’s crucial to have the same column headers to ensure proper mapping of the data during the import process.
- Format the columns in your Excel worksheet according to the data they will contain. For example, you can format the Date column as “Short Date” and the Amount column as “Currency” to ensure proper display and calculations.
- If you have multiple sheets in your Excel workbook, create a new sheet dedicated to importing the Splitwise data. This will keep your data organized and separate from any existing data in your workbook.
Setting up Excel correctly is essential to ensure a smooth and accurate import of your Splitwise data. By matching the column headers and formatting the columns appropriately, you can avoid any confusion or data misalignment during the import process.
Once you have set up Excel to receive the imported data, you are ready to move on to the next step: importing your Splitwise data into Excel.
Now that we have Excel set up properly, we can proceed to the next step of importing the Splitwise data. In the following section, we will walk you through the process of importing the CSV file and mapping the data into Excel.
Step 3: Importing Data into Excel
Now that you have set up your Excel workbook, it’s time to import the Splitwise data from the exported CSV file. Excel provides a straightforward process for importing CSV files. Here’s how you can import the data:
- Open the Excel workbook where you want to import the Splitwise data.
- Go to the Data tab in the Excel ribbon menu.
- Click on the “From Text” option in the Get External Data section. This will open the Text Import Wizard, which will guide you through the import process.
- In the Text Import Wizard, choose the “Delimited” option if it’s not already selected, and click on the “Next” button.
- On the next screen, select the “Comma” delimiter option, as Splitwise exports data in CSV format with comma-separated values. You can also choose other delimiters if your CSV file uses a different separator.
- Ensure that the data preview in the Text Import Wizard matches the structure of your Splitwise CSV file. If the data appears correctly, click on the “Next” button.
- In the next step, you can specify the data format for each column. Excel will automatically detect the data format for each column, but you can make adjustments if needed. Once you’re done, click on the “Finish” button.
- Choose the location where you want to import the data, either an existing worksheet or a new worksheet in the same workbook, and click on the “OK” button.
- Excel will import the Splitwise data from the CSV file and populate the selected location with the imported data.
Once the import process is complete, you will have your Splitwise data successfully imported into Excel. It’s a good practice to save your Excel workbook at this point to ensure that you don’t lose any imported data.
Now that you have successfully imported the Splitwise data into Excel, let’s move on to the next step of organizing and formatting the data for better visibility and analysis.
Step 4: Organizing and Formatting the Data
Now that you have imported your Splitwise data into Excel, it’s time to organize and format the data in a way that makes it more readable and visually appealing. By organizing and formatting the data, you can easily navigate through the imported information and gain better insights. Here are some steps to help you organize and format the data:
- Review the imported data: Take a moment to review the imported data and ensure that it has been imported correctly. Check for any missing or misplaced data points and make necessary adjustments.
- Apply filters: Excel provides a powerful filtering feature that allows you to sort and filter data based on specific criteria. Apply filters to your imported data to quickly find and analyze specific subsets of your expenses.
- Sort the data: Depending on your analysis goals, you may want to sort the data by different columns. For example, you can sort by date to see the chronological order of your expenses or sort by amount to identify the highest or lowest expenses.
- Add subtotals: If you have different categories or tags assigned to your expenses, consider adding subtotals to visualize the total expenses for each category. This can help you identify the major areas of your spending.
- Apply conditional formatting: Apply conditional formatting to highlight specific data points based on certain conditions. For example, you can use conditional formatting to highlight expenses above a certain threshold or highlight expenses from a specific category.
- Add additional columns and formulas: If you want to perform further calculations or create custom metrics based on your expenses, you can add additional columns and apply formulas. This can include calculations like calculating the average expense, finding the percentage of each expense category, or identifying the outstanding debts.
- Format the data: Adjust the formatting of the data to improve its visual appeal. You can format cells as currency, adjust column widths, apply formatting styles, or add colors to make the data more readable and understandable.
By organizing and formatting the imported Splitwise data, you can transform it into a well-structured and visually appealing format that facilitates better analysis and understanding. These steps will help you make the most out of your imported data, enabling you to gain valuable insights into your expenses and financial habits.
In the next step, we will explore techniques for analyzing and manipulating the imported data in Excel to uncover meaningful patterns and trends.
Step 5: Analyzing and Manipulating the Data
With your Splitwise data imported and organized in Excel, you now have a wealth of information at your fingertips. In this step, we will explore various techniques and functionalities in Excel to analyze and manipulate this data. Here are some ways you can analyze and manipulate your Splitwise data:
- Create Pivot Tables: Pivot tables are a powerful tool in Excel that allows you to summarize and analyze data from different angles. You can create pivot tables to aggregate your expenses by category, month, or any other criteria you choose. Pivot tables provide a quick and dynamic way to summarize your data and gain insights.
- Create Charts and Graphs: Visualizing your Splitwise data through charts and graphs can provide a clear understanding of your spending patterns. Excel offers various chart types, such as bar charts, line charts, and pie charts, which can be used to represent your data visually. You can create charts to compare expenses by category, track expenses over time, or analyze spending trends.
- Perform Calculations: Excel allows you to perform complex calculations on your imported data. You can use formulas and functions to calculate totals, averages, percentages, or any other metrics you need. For example, you can calculate the total expenses for each category, determine the percentage of each category in your overall expenses, or calculate the average expense per month.
- Apply Data Analysis Tools: Excel provides various built-in data analysis tools that can help you gain deeper insights into your Splitwise data. You can use tools like “What-If Analysis” to run scenarios and see the impact on your expenses, or use regression analysis to identify relationships between different variables.
- Create Reports: Excel provides the flexibility to create customized reports based on your Splitwise data. You can create summary reports that present key metrics and trends, expense reports that provide a detailed breakdown of your expenses, or reports that compare expenses over different time periods. Customizing your reports allows you to present the data in a meaningful and actionable way.
By leveraging the analytical capabilities of Excel, you can gain valuable insights into your spending habits, identify areas for improvement, and make informed financial decisions. The ability to manipulate and analyze your Splitwise data in Excel empowers you to take control of your financial management.
Now that you’ve learned various techniques for analyzing and manipulating your Splitwise data in Excel, you are ready to make the most of this valuable information. Remember to save your work regularly and explore different functionalities of Excel to unlock even more possibilities.
Conclusion
Importing data from Splitwise to Excel opens up a world of possibilities for effectively managing and analyzing your expenses. In this comprehensive guide, we provided step-by-step instructions on how to export your data from Splitwise, set up Excel, import the data, organize and format it, and analyze and manipulate the data to derive meaningful insights.
By importing your Splitwise data into Excel, you gain access to powerful tools and functionalities that allow you to customize and analyze your financial information. With features such as pivot tables, charts and graphs, formulas and functions, and data analysis tools, Excel provides a robust platform to track and understand your expenses in a more organized and dynamic way.
Throughout this guide, we emphasized the importance of properly setting up Excel, matching column headers, and formatting the data to ensure accurate and efficient import. We also explored techniques for organizing and formatting the data, including filtering, sorting, adding subtotals, and applying conditional formatting.
Furthermore, we delved into various methods to analyze and manipulate the imported data, from creating pivot tables and charts to performing calculations and utilizing data analysis tools. These techniques empower you to uncover patterns, identify trends, and make informed decisions about your finances.
Remember, Excel is a versatile tool that allows you to further customize your analysis by adding new calculations, formulas, and reports. By exploring and experimenting with additional features, you can tailor your financial management process to suit your specific needs and goals.
As you embark on your journey of importing Splitwise data into Excel, always remember to save your work regularly to avoid data loss. Don’t hesitate to explore online resources and tutorials to deepen your knowledge and discover more advanced techniques for maximizing the power of Excel.
We hope this guide has provided you with valuable insights and practical instructions for importing Splitwise data into Excel. By harnessing the capabilities of Excel, you can take control of your expenses, gain a clearer understanding of your financial situation, and make proactive decisions to achieve your financial goals.
So, grab your Splitwise data, fire up Excel, and begin leveraging the power of data analysis to empower your financial management journey!