Introduction
Welcome to the world of Linux! If you are new to this powerful operating system, you might be wondering how to check CPU usage on your system. Monitoring CPU usage is crucial for understanding the performance of your Linux machine and optimizing its efficiency. Thankfully, Linux provides several commands and tools that allow you to accurately measure CPU usage.
In this article, we will explore various methods to check CPU usage on Linux. Whether you prefer using the command line or a graphical interface, there is a method for everyone. We will walk you through each method step by step, explaining the commands and options involved along the way.
Monitoring CPU usage can help you identify processes that are consuming excessive resources, troubleshoot performance issues, and make informed decisions on system optimization. By understanding how to check CPU usage, you can take control of your Linux system and ensure it is running at its best.
Throughout this article, we will cover five different methods for checking CPU usage on Linux machines. Each method offers unique features and benefits, so you can choose the one that suits your needs and preferences.
Now, let’s dive into the various methods and learn how to check CPU usage on Linux!
Method 1: Using the ‘top’ Command
The ‘top’ command is a widely used utility that provides real-time information about CPU usage on a Linux system. It displays a dynamic, interactive view of system processes and their resource consumption. To check CPU usage using the ‘top’ command, follow these steps:
- Open a terminal window on your Linux system.
- Type ‘top’ and press Enter to launch the ‘top’ command.
- Once the ‘top’ command is running, you will see a real-time summary of CPU usage and other system statistics.
- The CPU usage is displayed as a percentage under the ‘%CPU’ column.
- You can sort the process list by CPU usage by pressing the ‘Shift’ and the ‘P’ keys together.
- To exit the ‘top’ command, press ‘q’.
The ‘top’ command provides a wealth of information, such as the total number of processes, memory usage, and more. It allows you to monitor CPU usage in real-time and identify any resource-intensive processes that may be affecting system performance.
Additionally, ‘top’ provides options to customize the display, such as sorting the processes by different criteria and setting the update frequency. For more details on the available options, you can refer to the ‘top’ command’s documentation by typing ‘man top’ in the terminal.
Using the ‘top’ command is a straightforward and effective method to check CPU usage on a Linux system. It provides a real-time overview of the processes running on the system and their resource consumption, allowing you to quickly identify any performance bottlenecks and take appropriate action.
Now that you are familiar with using the ‘top’ command, let’s move on to the next method of checking CPU usage on Linux.
Method 2: Using the ‘htop’ Command
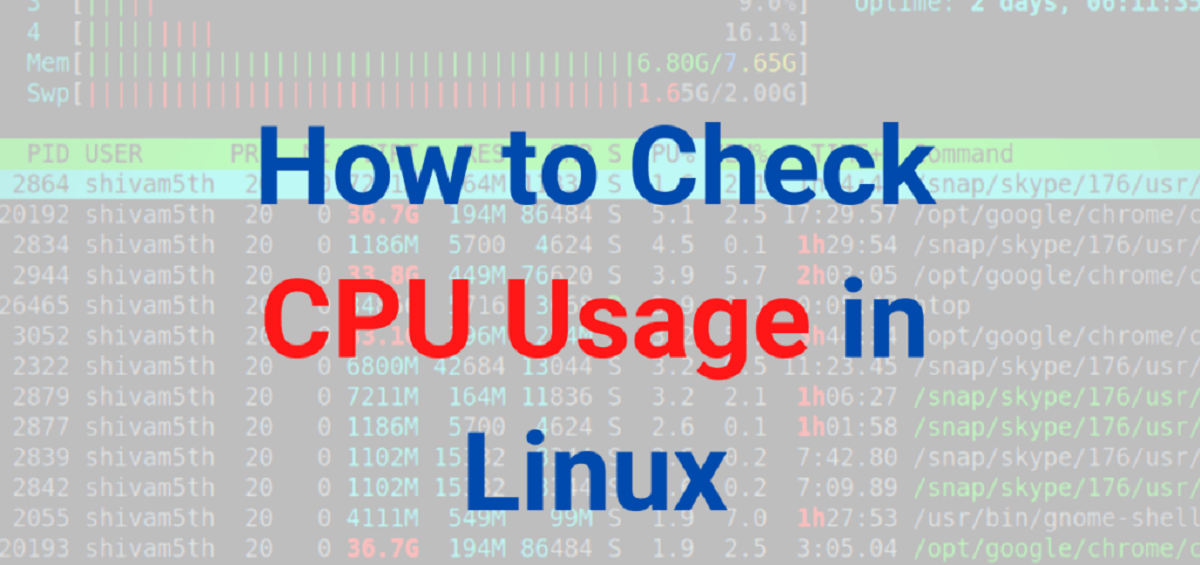
If you are looking for a more advanced and feature-rich alternative to the ‘top’ command, ‘htop’ is a great option. ‘htop’ provides a user-friendly, interactive interface for monitoring system processes and CPU usage on Linux. Here’s how you can use the ‘htop’ command to check CPU usage:
- Open a terminal window on your Linux system.
- Type ‘htop’ and press Enter to launch the ‘htop’ command.
- Once ‘htop’ is running, you will see a colorful and interactive display, similar to the ‘top’ command.
- The CPU usage is displayed as a bar graph at the top of the screen, showing the usage percentage for each CPU core.
- Beneath the CPU usage graph, you will find the list of processes and their respective CPU usage.
- Like the ‘top’ command, you can sort the process list by CPU usage by pressing the ‘F6’ key.
- Use the arrow keys to navigate through the process list and observe CPU usage and other information.
- To exit the ‘htop’ command, press ‘q’.
One notable feature of ‘htop’ is its ability to customize and interact with the process list. You can selectively kill processes, change the priority of processes, search for specific processes, and much more. ‘htop’ offers a more intuitive and user-friendly interface compared to the ‘top’ command, while still providing comprehensive CPU usage information.
Additional options and configurations are available in ‘htop’, allowing you to tailor the display and behavior according to your preferences. To explore these options, you can refer to the ‘htop’ command’s documentation by typing ‘man htop’ in the terminal.
The ‘htop’ command is a powerful tool for monitoring CPU usage on Linux systems. Its user-friendly interface, customization options, and interactive features make it an excellent choice for advanced users and those who prefer a visually appealing view of system processes.
Now that you have learned how to use the ‘htop’ command, let’s move on to the next method for checking CPU usage on Linux.
Method 3: Using the ‘mpstat’ Command
For a more detailed analysis of CPU usage, you can utilize the ‘mpstat’ command on your Linux system. The ‘mpstat’ command provides statistics on individual processor usage, allowing you to monitor CPU performance on a per-core basis. Here’s how you can use the ‘mpstat’ command to check CPU usage:
- Open a terminal window on your Linux system.
- Type ‘mpstat’ and press Enter to run the ‘mpstat’ command.
- By default, the ‘mpstat’ command shows the statistics for all available processors in your system.
- To display the CPU statistics for a specific interval, you can add a time parameter to the command. For example, ‘mpstat 5’ will refresh the statistics every 5 seconds.
- The ‘mpstat’ command will display information such as the average CPU usage, individual core usage, percentage of time spent in user mode, system mode, idle mode, and more.
- Press ‘Ctrl + C’ to stop the ‘mpstat’ command.
The ‘mpstat’ command provides an in-depth analysis of CPU usage, making it useful for identifying any potential performance issues or irregularities. By monitoring individual core usage, you can gain insights into how tasks are distributed across different CPU cores.
In addition to CPU usage, ‘mpstat’ also provides information on other system-related statistics, such as interrupts per second and context switches per second. This data can be valuable for evaluating overall system performance.
Using the ‘mpstat’ command allows you to gather detailed CPU usage information in a concise and easily consumable format. It is particularly beneficial for systems with multiple cores, as it provides a breakdown of usage on a per-core basis.
Now that you have learned how to use the ‘mpstat’ command, let’s move on to the next method for checking CPU usage on Linux.
Method 4: Using the ‘pidstat’ Command
If you want to dive even deeper into CPU usage analysis on a per-process basis, the ‘pidstat’ command is the perfect tool. ‘pidstat’ allows you to monitor the CPU usage of individual processes, providing valuable insights into resource utilization. Here’s how you can use the ‘pidstat’ command to check CPU usage:
- Open a terminal window on your Linux system.
- Type ‘pidstat’ followed by the time interval in seconds and the number of iterations you want to perform. For example, ‘pidstat 5 10’ will display the CPU usage statistics for each process every 5 seconds, for a total of 10 iterations.
- The ‘pidstat’ command will present a comprehensive report showing CPU statistics for each process, including the percentage of CPU usage, CPU time consumed, and more.
- The report also includes additional information such as memory usage, thread count, and I/O statistics.
- To exit the ‘pidstat’ command, press ‘Ctrl + C’.
By using the ‘pidstat’ command, you can gain insight into which processes are utilizing the most CPU resources. This information is particularly useful when troubleshooting performance problems or identifying resource-hungry applications.
Furthermore, ‘pidstat’ provides the ability to filter the results based on criteria such as specific users or processes. This allows you to narrow down the focus and analyze the CPU usage of particular processes that are of interest to you.
With the ‘pidstat’ command, you have a powerful tool at your disposal to monitor CPU usage at the process level. It enables you to identify resource-intensive processes and gain a deeper understanding of their impact on system performance.
Now that you are familiar with the ‘pidstat’ command, let’s move on to the final method for checking CPU usage on Linux.
Method 5: Using the ‘sar’ Command
If you want to gather historical data on CPU usage and analyze system performance over a period of time, the ‘sar’ command is an excellent choice. By collecting and reporting system activity data, ‘sar’ allows you to track CPU usage trends and identify patterns. Here’s how you can use the ‘sar’ command to check CPU usage:
- Open a terminal window on your Linux system.
- Type ‘sar’ followed by the time interval in seconds and the number of iterations you want to perform. For example, ‘sar 5 3’ will collect system activity data every 5 seconds, for a total of 3 iterations.
- The ‘sar’ command will display a detailed report showcasing various performance statistics, including CPU usage, memory usage, I/O activity, and more.
- Look for the ‘%user’ and ‘%idle’ columns in the CPU utilization section of the report to see the percentage of time the CPU spent in user mode and idle mode, respectively.
- To exit the ‘sar’ command, press ‘Ctrl + C’.
The ‘sar’ command is a powerful tool for gathering historical data on CPU usage and other system metrics. By analyzing this data, you can identify usage patterns, detect performance bottlenecks, and make informed decisions to optimize system performance.
In addition to real-time monitoring, ‘sar’ also allows you to generate reports from previously collected data, providing a comprehensive view of system performance over time. This makes it a valuable tool for long-term monitoring and capacity planning.
By utilizing the ‘sar’ command, you can gain valuable insights into CPU usage trends and understand how system resources are utilized over extended periods. This is especially beneficial when troubleshooting intermittent performance issues or evaluating the effectiveness of system optimizations.
Now that you have learned how to use the ‘sar’ command, you have a powerful tool for analyzing historical CPU usage data and gaining a comprehensive understanding of your Linux system’s performance.
Conclusion
Checking CPU usage on a Linux system is essential for monitoring performance, troubleshooting issues, and optimizing resource utilization. In this article, we explored five different methods for checking CPU usage: using the ‘top’ command, the ‘htop’ command, the ‘mpstat’ command, the ‘pidstat’ command, and the ‘sar’ command.
The ‘top’ command provides a real-time overview of CPU usage and system statistics, making it a straightforward option for monitoring CPU performance. If you prefer a more advanced and interactive interface, the ‘htop’ command offers additional features and customization options.
For a detailed analysis of CPU usage on a per-core basis, the ‘mpstat’ command is a valuable tool. It allows you to track individual processor usage and gain insights into task distribution across different cores.
If you need to monitor CPU usage at the process level, the ‘pidstat’ command is the ideal choice. It provides statistics on a per-process basis, enabling you to identify resource-intensive applications and troubleshoot performance issues.
Lastly, the ‘sar’ command allows you to gather historical data on system activity, including CPU usage. By analyzing this data, you can track usage trends, identify patterns, and make informed decisions for system optimization and capacity planning.
Each method has its own advantages and use cases, so you can choose the one that best suits your monitoring and analysis needs. By regularly checking CPU usage and understanding system performance, you can ensure optimal resource utilization and maintain the efficiency of your Linux system.
So go ahead and explore these methods to check CPU usage on your Linux machine. By monitoring CPU usage effectively, you can take control of your system’s performance and make informed decisions for optimal resource utilization.


