Introduction
When it comes to understanding the performance of your computer, one critical factor to consider is CPU usage. CPU, also known as the Central Processing Unit, is the brain of your computer responsible for executing and managing various tasks. Monitoring CPU usage can provide valuable insights into the overall performance and efficiency of your system.
CPU usage refers to the percentage of time that your processor is actively working on tasks. It is a measure of how much of its processing power is being utilized at any given time. High CPU usage can lead to sluggish system performance, increased power consumption, and even potential system crashes.
Whether you are a computer enthusiast, a professional IT administrator, or just curious about the inner workings of your device, checking CPU usage is an essential skill to possess. By understanding how to monitor CPU usage, you can identify resource-intensive applications, troubleshoot performance issues, and optimize your system’s performance.
In this guide, we will explore how to check CPU usage on various operating systems, including Windows, Mac, and Linux. We will also discuss the different tools available, such as Task Manager, Activity Monitor, and System Monitor, that allow you to monitor CPU usage effectively.
By learning these techniques, you can proactively manage your system’s resources, ensure optimal performance, and avoid potential bottlenecks. So, let’s dive in and discover how to check CPU usage on your computer!
What is CPU Usage?
CPU usage refers to the amount of time the processor spends executing tasks in relation to the total time available. It is typically expressed as a percentage, representing the portion of the processor’s capacity that is in use at any given moment. CPU usage is a critical metric for understanding the performance and efficiency of your computer.
When you run applications or perform tasks on your computer, each task requires a certain amount of processing power from the CPU. The CPU allocates resources to these tasks and switches between them rapidly. The higher the CPU usage, the more work the processor is performing.
CPU usage can vary depending on the system’s workload. For example, if you are running multiple resource-intensive applications simultaneously, the CPU usage will be high. On the other hand, if your system is idle or running lightweight tasks, the CPU usage will be low.
Monitoring CPU usage is crucial because high CPU usage can lead to performance issues. When the CPU is constantly operating at or near its maximum capacity, it may struggle to handle additional tasks, resulting in slow response times, laggy performance, and even system freezes or crashes.
Understanding CPU usage can help you identify processes or applications that are putting a strain on your system’s resources. By pinpointing these resource hogs, you can take appropriate measures such as closing unnecessary applications, optimizing software settings, or upgrading hardware components to improve overall system performance.
It’s important to note that CPU usage can vary over time, even for the same process. Certain tasks may require higher CPU usage at the start and lower usage as they progress. Additionally, background processes and system services may use CPU resources intermittently.
Monitoring CPU usage allows you to assess the impact of these processes on your system’s performance and make informed decisions to optimize resource allocation. By keeping an eye on CPU usage, you can ensure that your computer is running efficiently and effectively, allowing you to work and play without any performance constraints.
Why is it important to check CPU Usage?
Checking CPU usage is vital for several reasons, as it provides valuable insights into the performance and efficiency of your computer system. Here are some key reasons why monitoring CPU usage is important:
System Performance: CPU usage directly impacts system performance. When the CPU is heavily utilized, it may struggle to handle additional tasks efficiently, resulting in sluggish performance, slow response times, and delays. By checking CPU usage, you can identify resource-intensive processes that may be causing performance bottlenecks and take necessary steps to optimize system performance.
Overheating and Hardware Stress: High CPU usage can lead to increased heat generation, potentially resulting in overheating. Overheating is detrimental to your computer’s health and may cause system instability or damage to hardware components over time. By regularly monitoring CPU usage, you can detect any abnormal or sustained high usage, allowing you to take preventive measures to prevent overheating and reduce stress on your system’s hardware.
Identifying Resource-Intensive Applications: Checking CPU usage helps identify which applications or processes are consuming a significant amount of CPU resources. This information is crucial for managing system resources effectively. By identifying resource-intensive applications, you can prioritize or adjust their usage, close unnecessary programs, or allocate resources differently to improve overall system performance and efficiency.
Troubleshooting Performance Issues: If you are experiencing performance issues such as system freezes, crashes, or slowdowns, checking CPU usage can help troubleshoot the problem. By monitoring CPU usage during these issues, you can identify whether high CPU usage is the cause and then investigate further to determine the underlying cause of the excessive CPU usage, such as a specific application or background process.
Optimizing Resource Allocation: Monitoring CPU usage allows you to gain insights into how your system’s resources are being utilized. By identifying resource-heavy processes or applications, you can make informed decisions about resource allocation. This may involve closing unnecessary programs, adjusting priority levels, or upgrading hardware components to ensure optimal resource usage and balance across the system.
Preventing System Crashes: Excessive CPU usage can push your system beyond its limits, potentially leading to system crashes. By regularly checking CPU usage, you can detect any sustained high usage that may be a precursor to a system crash. This allows you to take proactive measures to optimize resource allocation or address any underlying issues before they escalate into critical failures.
Overall, checking CPU usage is essential for maintaining system health, optimizing performance, and preventing potential issues. By understanding CPU usage patterns, you can make informed decisions to ensure your computer runs smoothly and efficiently, providing a seamless user experience.
Checking CPU Usage on Windows
Windows provides several built-in tools to check CPU usage and monitor system performance. Here are some methods to check CPU usage on Windows:
Using Task Manager: The Task Manager is a powerful tool that offers an overview of CPU usage and allows you to monitor processes and their impact on system performance. To open the Task Manager, right-click on the taskbar and select “Task Manager” or press Ctrl+Shift+Esc. In the Task Manager window, click on the “Performance” tab to view the CPU usage graph, which displays real-time CPU usage for all processes. You can sort the processes by CPU usage to identify resource-intensive applications.
Using Resource Monitor: The Resource Monitor provides detailed information about CPU usage, including per-process utilization and resource consumption. To open the Resource Monitor, press Win+R to launch the Run dialog, type “resmon,” and hit Enter. In the Resource Monitor window, go to the “CPU” tab to view real-time CPU usage, processes, and associated statistics. Resource Monitor offers comprehensive monitoring capabilities, including monitoring network activity and disk usage.
Using PowerShell: PowerShell is a command-line interface that allows advanced monitoring of CPU usage. To open PowerShell, press Win+X (or right-click on the Start button) and select “Windows PowerShell” or “Windows PowerShell (Admin)” for elevated privileges. In the PowerShell window, you can use commands such as Get-Counter '\Processor(_Total)\% Processor Time' to retrieve CPU usage information. PowerShell provides more flexibility for scripting and automating tasks related to monitoring CPU usage.
Using Third-Party Software: Numerous third-party software applications are available to monitor CPU usage on Windows. These tools often provide more advanced features, customizable dashboards, and detailed reports. Some popular options include HWMonitor, CPU-Z, Core Temp, and Rainmeter. It’s important to choose reputable and trusted software from reliable sources to ensure the security of your system.
By utilizing these methods, you can stay informed about CPU usage on your Windows system. Monitoring CPU usage allows you to identify resource-intensive processes, troubleshoot performance issues, optimize resource allocation, and ensure your system is running smoothly.
Checking CPU Usage on Mac
Mac computers provide built-in tools that allow you to easily check CPU usage and monitor system performance. Here are some methods to check CPU usage on a Mac:
Using Activity Monitor: The Activity Monitor is a powerful utility that provides real-time information about system processes and resource usage. To open the Activity Monitor, go to the “Applications” folder, then go to the “Utilities” folder, and select “Activity Monitor.” In the Activity Monitor window, click on the “CPU” tab to view CPU usage statistics. The window displays a list of processes along with their CPU usage percentage, allowing you to identify resource-intensive applications and monitor overall system performance.
Using the Dock: The Dock on a Mac includes a feature called “Application CPU Usage,” which provides a quick glance at CPU usage for active applications. By default, it appears as a small indicator below the application icons in the Dock. The color changes to indicate different levels of CPU usage – green for low, yellow for moderate, and red for high usage. You can hover over the indicator to view the CPU usage percentage for a specific application.
Using Command Line: If you prefer using the command line interface, the Terminal application on a Mac allows you to check CPU usage using system commands. Open the Terminal by going to the “Applications” folder, then the “Utilities” folder, and selecting “Terminal.” You can use commands such as top or htop to display real-time information about processes, CPU usage, and other system statistics. These commands provide a more detailed and customizable view of CPU usage for advanced users.
Using Third-Party Software: Additionally, there are various third-party applications available for monitoring CPU usage on Mac. These tools often offer extra features, visualizations, and detailed reports. Some popular options include iStat Menus, MenuMeters, and Intel Power Gadget. Make sure to review and choose reputable software from trusted sources to ensure the security and reliability of your system.
By utilizing these methods, you can easily keep track of CPU usage on your Mac. Monitoring CPU usage allows you to identify resource-intensive applications, troubleshoot performance issues, and optimize system resources for a smoother and more efficient computing experience.
Checking CPU Usage on Linux
Linux systems provide several tools that allow you to monitor CPU usage and analyze system performance. Here are some methods to check CPU usage on Linux:
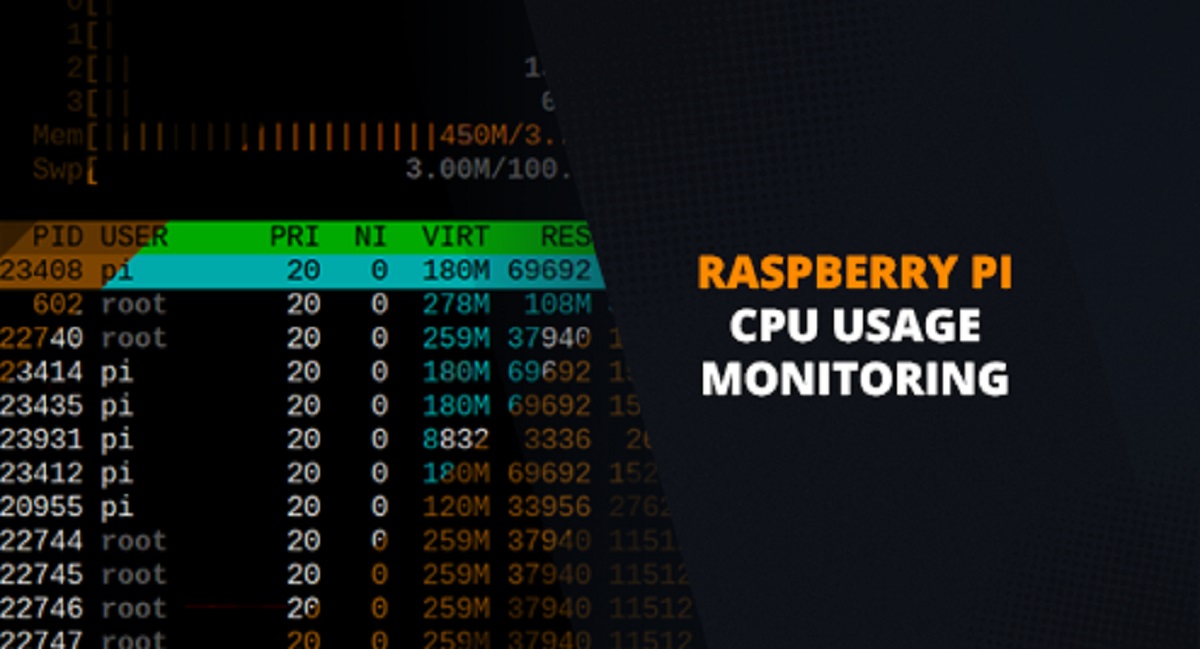
Using the top Command: The top command is a popular tool for monitoring system resources, including CPU usage. Open a terminal window and simply type top. It displays real-time information about CPU usage, memory usage, and running processes. The default view shows the overall CPU usage and a list of processes sorted by their CPU usage percentage. You can press q to exit the top command.
Using the htop Command: The htop command is an advanced variant of the top command that provides a more user-friendly and interactive interface. You can install htop using your Linux system’s package manager, such as sudo apt install htop for Debian-based distributions. Running the htop command in the terminal launches the htop interface, where you can view CPU usage, memory usage, and other system information. htop allows you to sort processes, search for specific processes, and customize the display with various options.
Using the System Monitor: Many Linux distributions come with a graphical system monitoring tool called System Monitor or Resource Monitor. It provides an easy-to-read interface to monitor CPU usage, memory usage, and other system resources. You can usually find it in the system settings menu or by searching for “System Monitor” in the applications menu. In the System Monitor, navigate to the CPU or Performance tab to view CPU usage graphs and process details.
Using Command Line Tools: Linux offers various command-line tools to monitor CPU usage. For example, the mpstat command displays detailed information about CPU usage for each processor in your system. Running mpstat -P ALL provides utilization statistics for each CPU core individually. Other commands like sar and vmstat also provide comprehensive system performance statistics, including CPU usage.
Using Third-Party Monitoring Tools: Additionally, there are third-party monitoring tools available for Linux that offer more advanced features and visualizations. Some popular options include Nagios, Zabbix, and Grafana with Prometheus. These tools require installation and configuration but provide more extensive monitoring capabilities for CPU usage and other system metrics.
By using these methods, you can effectively monitor CPU usage on your Linux system. Monitoring CPU usage allows you to identify resource-intensive processes, detect performance bottlenecks, and optimize system resources for improved efficiency and stability.
Using Task Manager to Check CPU Usage
Task Manager is a built-in utility in Windows that allows you to monitor system performance, including CPU usage. Here is how you can use Task Manager to check CPU usage:
1. Open Task Manager: Right-click on the taskbar and select “Task Manager” from the context menu. Alternatively, you can press Ctrl+Shift+Esc to directly open Task Manager.
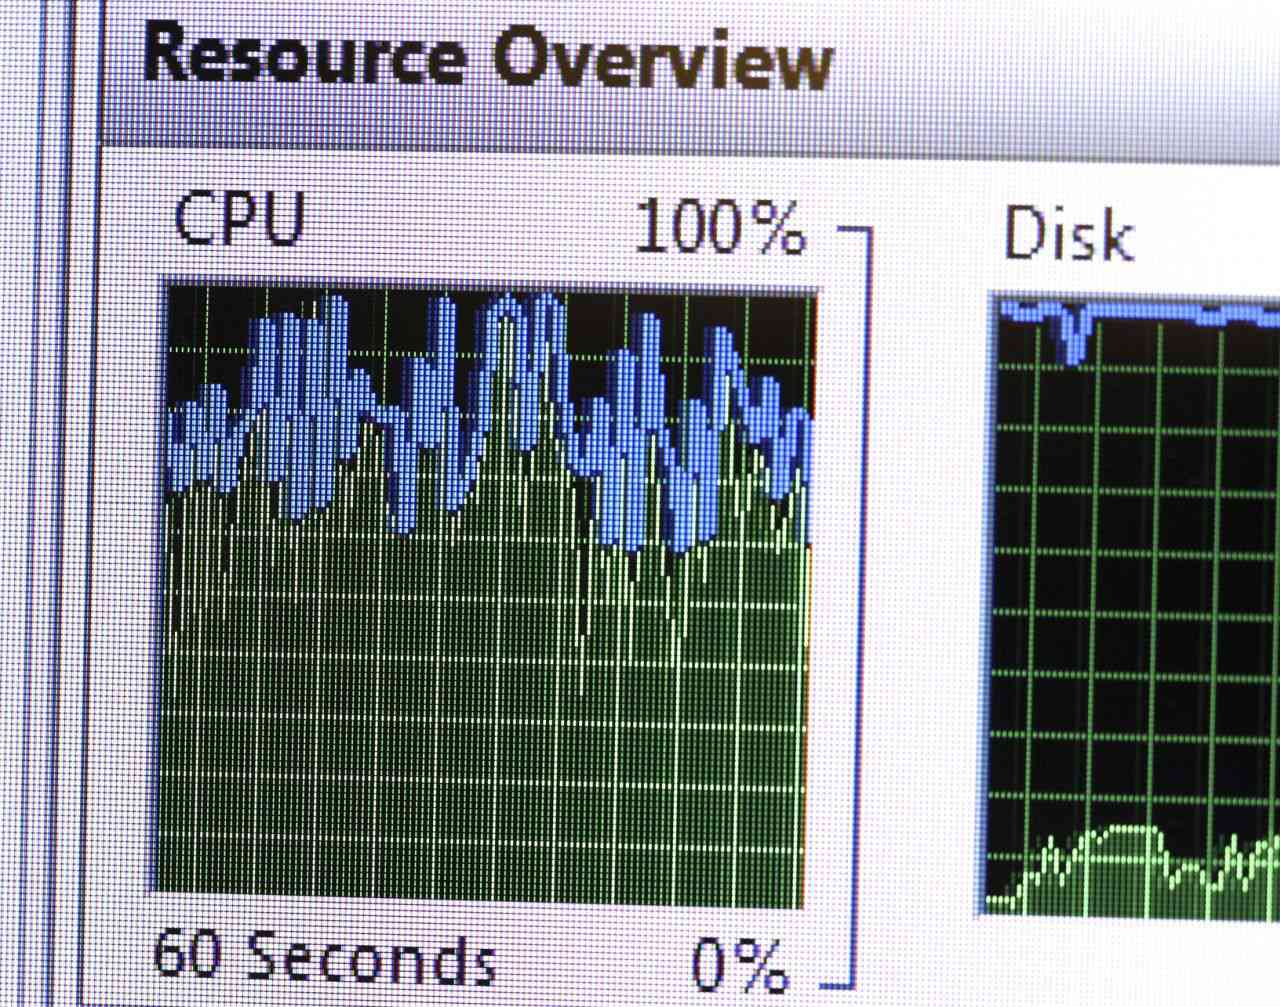
2. View CPU Usage: In the Task Manager window, click on the “Performance” tab. Here, you’ll see a real-time graph displaying the overall CPU usage. The graph shows the percentage of CPU usage over time, allowing you to visualize fluctuations in CPU usage.
3. Monitor Individual Processes: To monitor CPU usage by specific processes, click on the “Processes” or “Details” tab. The Processes tab provides a list of running applications and background processes, along with their corresponding CPU usage percentage. You can sort the processes by CPU usage to identify resource-intensive applications.
4. View CPU Usage History: Task Manager also allows you to view historical CPU usage data. Right-click on the CPU usage graph in the Performance tab and select “Change graph to” to switch to various display modes, such as “Logical processors” or “Multiple graphs.” You can also select “Summary view” to see a detailed summary of CPU usage over a specific timeframe.
5. Additional Features: Task Manager provides additional features to analyze CPU usage, such as the ability to set CPU affinity and priority for specific processes. Right-click on a process in the Processes tab and select “Set Affinity” or “Set Priority” to customize CPU allocation or process priority. However, exercise caution when adjusting these settings as improper changes may affect system stability.
Task Manager is a versatile tool that allows you to gain valuable insights into CPU usage and system performance on your Windows computer. By effectively utilizing Task Manager, you can identify resource-intensive processes, troubleshoot performance issues, and optimize your system’s performance for a smoother computing experience.
Using Activity Monitor to Check CPU Usage
Activity Monitor is a built-in utility on Mac computers that provides a detailed view of system processes, including CPU usage. Here’s how you can use Activity Monitor to check CPU usage:
1. Open Activity Monitor: Go to the “Applications” folder, then navigate to “Utilities,” and open “Activity Monitor.”
2. Monitor CPU Usage: By default, Activity Monitor opens with the “CPU” tab selected. Here, you’ll see a list of processes with their corresponding CPU usage percentages. The “%CPU” column displays the CPU usage of each process, allowing you to identify resource-intensive applications. You can sort the processes by CPU usage to quickly identify the most CPU-intensive tasks.
3. View CPU Usage Graph: To view a graphical representation of CPU usage, click on the “CPU” icon in the toolbar. This graph displays the real-time CPU usage over a defined period, allowing you to visualize CPU usage trends and fluctuations. You can customize the graph display by changing the time interval from the View menu.
4. Additional Features: Activity Monitor provides several additional features to analyze CPU usage. The “Floating CPU Window” option allows you to keep a small window on top of other applications that displays CPU usage in real-time. By using the “View > Dock Icon” option, you can display a live CPU usage graph as an icon on the dock. Activity Monitor also offers the ability to expand and collapse process hierarchies, showing individual threads and subprocesses.
5. Resource Monitoring: Besides CPU usage, Activity Monitor provides information about other system resources such as memory, disk, energy, and network usage. You can switch between different tabs to monitor these resources as needed, gaining comprehensive insights into your system’s performance.
Activity Monitor is a powerful tool that allows you to monitor CPU usage and gain a deeper understanding of your Mac’s performance. By utilizing its features effectively, you can identify resource-intensive processes, troubleshoot performance issues, and optimize CPU usage for enhanced productivity and efficiency.
Using System Monitor to Check CPU Usage
System Monitor is a graphical utility available on Linux systems that provides detailed information about system resources, including CPU usage. Here’s how you can use System Monitor to check CPU usage:
1. Open System Monitor: The exact process to open System Monitor may vary depending on the Linux distribution and desktop environment. Typically, you can find it in the system settings menu or by searching for “System Monitor” in the applications menu.
2. Select CPU Tab: In the System Monitor window, navigate to the “CPU” or “Performance” tab. Here, you’ll find various CPU-related information, including CPU usage graphs, CPU frequency, and a breakdown of usage by individual cores or threads.
3. Monitor CPU Usage: The CPU usage graphs in System Monitor provide a visual representation of CPU activity over time. You can observe the overall CPU usage and track any spikes or fluctuations. The percentage values displayed alongside the graph represent the current CPU usage.
4. View Process Details: System Monitor also provides a list of running processes and their respective CPU usage. You can sort processes by CPU usage to identify resource-intensive applications or services. You can also see other process-related details, such as process ID, user, and memory usage.
5. Additional Features: System Monitor may offer additional features depending on your Linux distribution and desktop environment. For example, you may be able to adjust the update frequency of CPU usage graphs or customize the appearance of the CPU tab. You can explore the options and settings provided by System Monitor to tailor it to your preferences.
System Monitor is a handy tool for monitoring CPU usage on Linux. By utilizing its features, you can keep track of CPU activity, identify processes consuming significant CPU resources, and make informed decisions to optimize system performance.
Interpreting CPU Usage Results
Interpreting CPU usage results is crucial for understanding the performance and efficiency of your computer system. Here are some key aspects to consider when analyzing CPU usage:
Overall CPU Usage: The overall CPU usage represents the percentage of CPU capacity being utilized at any given time. Low CPU usage suggests that the system has ample processing power available, while high CPU usage indicates a heavy workload. Monitoring CPU usage over time helps identify patterns and trends in resource utilization.
Idle CPU Time: Idle CPU time refers to the percentage of time that the CPU is not actively processing any tasks. Higher idle CPU time indicates that the CPU has spare capacity to handle additional tasks. On the other hand, lower idle CPU time suggests that the CPU is consistently engaged in processing tasks, potentially leading to reduced system performance.
Individual Process CPU Usage: Analyzing the CPU usage of individual processes provides insights into which applications or services are consuming significant CPU resources. High CPU usage by a specific process may indicate that it is demanding a substantial amount of processing power. Identifying resource-intensive processes helps prioritize optimization efforts or resource allocation adjustments.
CPU Usage by Core/Thread: Some monitoring tools provide the ability to view CPU usage data for individual cores or threads. This information can help identify imbalances in CPU workload distribution. If certain cores or threads consistently exhibit higher usage than others, it may suggest that the workload could be better distributed across the CPU, optimizing overall performance.
Real-Time vs. Historical Data: Examining real-time CPU usage data enables you to monitor current system activity. It allows you to spot sudden spikes or sustained high usage that might be impacting system performance. On the other hand, analyzing historical data helps identify usage patterns, such as peak periods or regular fluctuations, which can guide system optimization strategies.
Contextual Analysis: It’s essential to interpret CPU usage results in context. Consider factors such as system specifications, running applications, background processes, and system demands. An application using a relatively high percentage of CPU resources may be perfectly normal if it is designed to handle resource-intensive tasks. Understanding the context helps avoid unnecessary concerns or misguided optimization efforts.
Thresholds and System Health: Keep in mind that CPU usage thresholds for optimal performance may vary depending on the specific system configuration and workload. While sustained high CPU usage can indicate performance issues, it is important to consider other factors such as system responsiveness, temperature, and stability. Monitoring these factors alongside CPU usage helps ensure the overall health and stability of the system.
Interpreting CPU usage results accurately empowers you to make informed decisions regarding system optimization, resource allocation, and performance troubleshooting. By analyzing CPU usage in conjunction with other system metrics, you can fine-tune your system for improved efficiency, identify potential bottlenecks, and ensure that your computer runs smoothly and reliably.
Conclusion
Checking CPU usage is a crucial task for understanding the performance and efficiency of your computer system. By monitoring CPU usage, you can identify resource-intensive processes, troubleshoot performance issues, and optimize system resources to ensure smooth and efficient operation.
On Windows, the built-in Task Manager provides a comprehensive view of CPU usage, allowing you to monitor processes and analyze performance. Activity Monitor on Mac offers a user-friendly interface to track CPU usage and identify resource-heavy applications. Linux users can utilize System Monitor or command-line tools like top and htop to monitor CPU usage and gain deeper insights into system performance.
Interpreting CPU usage results requires understanding the overall CPU usage, idle CPU time, individual process CPU usage, CPU usage by core/thread, real-time vs. historical data, contextual analysis, and the thresholds for system health. Having this knowledge empowers you to make informed decisions, optimize resource allocation, and troubleshoot any performance issues effectively.
Regularly checking CPU usage allows you to maintain system health, prevent overheating and crashes, and optimize overall performance. By monitoring CPU usage, you can ensure that your computer system runs efficiently, smoothly, and reliably.
So, whether you’re a computer enthusiast, an IT administrator, or simply someone who wants to optimize their system, understanding CPU usage and utilizing the appropriate tools to monitor and interpret it will undoubtedly contribute to a better computing experience.