Introduction
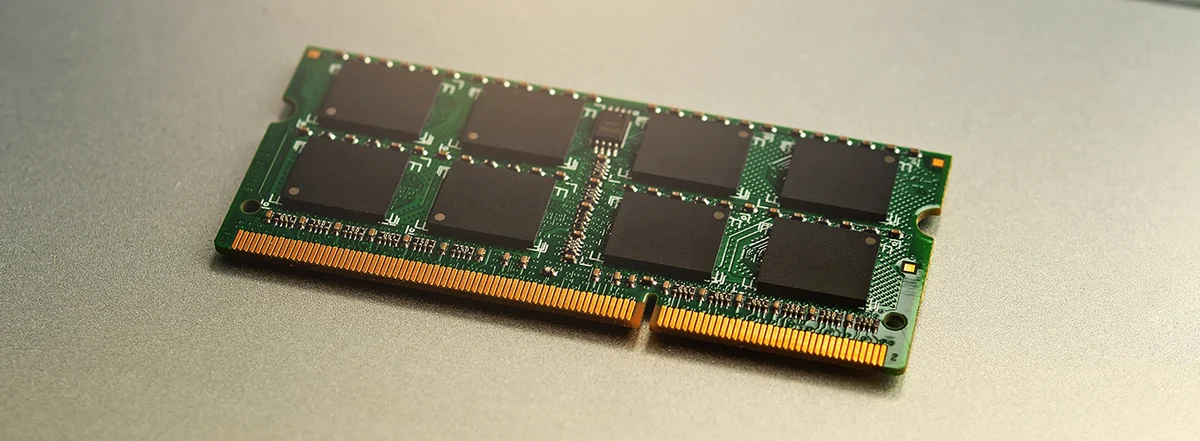
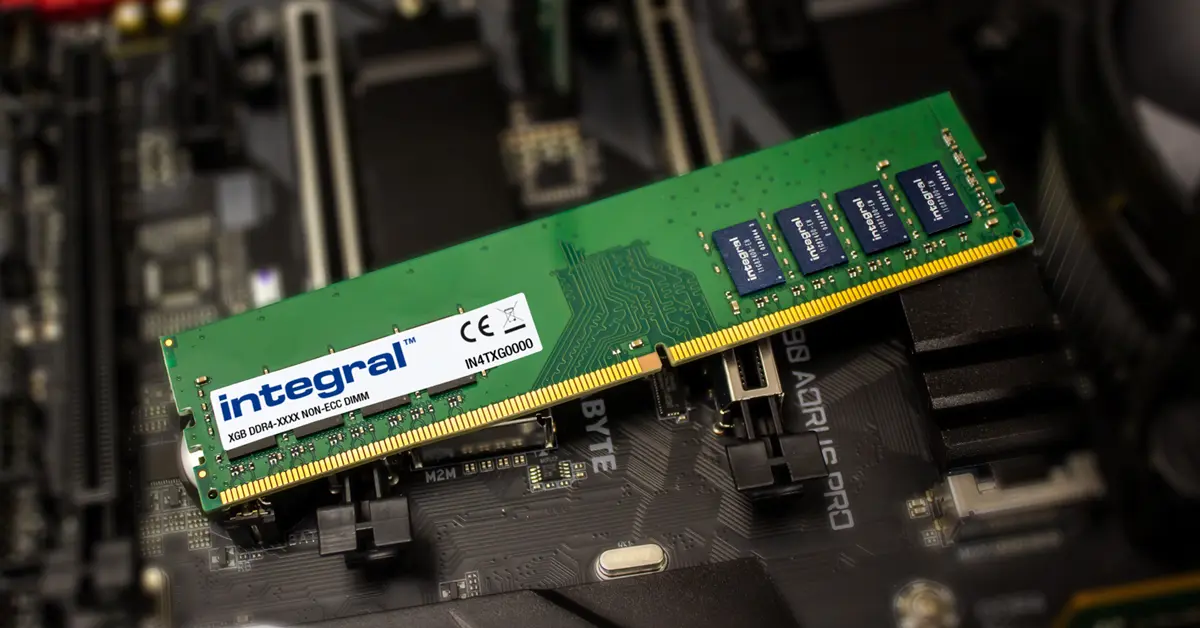
Understanding how much Random Access Memory (RAM) is being used on your computer can be crucial for optimizing performance and identifying any potential issues. RAM is a vital component of your computer’s hardware that temporarily stores data for quick and easy access by the processor. Overutilizing RAM can lead to sluggish performance, while underutilizing it may indicate a need for additional memory.
In this article, we will explore various methods to help you check the amount of RAM being used on your computer. These methods are applicable to different operating systems, including Windows, Mac, and Linux, ensuring that you can find the option that suits your needs.
By monitoring RAM usage, you can better understand how your system is utilizing its resources and make informed decisions about managing memory usage effectively. Whether you’re a computer enthusiast, a gamer, or a professional who relies on heavy-duty software, knowing how much RAM is being utilized is essential for maintaining optimal performance and ensuring a smooth computing experience.
Below, we will walk you through five different methods to see how much RAM is being used on your computer. Each method is specific to a particular operating system or provides additional features and tools, allowing you to choose the most suitable option for your needs.
Method 1: Task Manager (Windows)
One of the easiest ways to check RAM usage on a Windows computer is by using the built-in Task Manager. This tool provides real-time information about memory usage and helps you identify which applications or processes are consuming the most resources.
To access the Task Manager, simply right-click on the taskbar and select “Task Manager” from the context menu. Alternatively, you can press “Ctrl + Shift + Esc” to open it directly. Once the Task Manager window opens, click on the “Performance” tab at the top.
On the Performance tab, you will find various details regarding your computer’s performance, including CPU usage, disk activity, and, of course, memory usage. The “Memory” section displays the total amount of RAM installed on your system and how much is currently being used.
In addition to the overall memory usage, you can also see a list of running processes sorted by their memory consumption. This allows you to identify any specific applications that are using a significant amount of RAM.
If you want to dive deeper into the memory usage, click on the “Open Resource Monitor” link at the bottom of the Task Manager window. This will open the Resource Monitor, which provides even more detailed information on memory usage, including processes, memory modules, and system hardware.
Task Manager is a powerful tool that not only helps you monitor RAM usage but also allows you to end or restart processes that may be causing issues or consuming excessive resources. With the ability to quickly identify and manage memory-hungry applications, you can optimize your system’s performance and improve overall efficiency.
Monitoring your computer’s memory usage using Task Manager is an essential practice for troubleshooting performance issues, identifying memory leaks, and making informed decisions about upgrading your RAM.
Method 2: Activity Monitor (Mac)
Mac users can utilize the built-in Activity Monitor to check their RAM usage. Activity Monitor provides a comprehensive overview of system resources, including CPU, memory, disk usage, and network activity.
To open Activity Monitor, you can either go to “Applications” > “Utilities” and then click on “Activity Monitor,” or you can use the Spotlight search by pressing “Command + Space” and typing “Activity Monitor.”
Once Activity Monitor is open, click on the “Memory” tab at the top to view the memory usage details. You will see a variety of information, including the total amount of memory installed, the amount of memory currently being used, and the amount of memory used by each active process.
The memory usage is represented in various categories, such as “App Memory,” “Wired Memory,” “Compressed,” “Cached Files,” and “Swap Used.” These categories provide a breakdown of how the memory is allocated to different processes and system functions.
By default, Activity Monitor arranges processes based on their memory usage. This allows you to identify applications that use the most memory and potentially optimize their usage or close them if necessary.
In addition to monitoring memory usage, Activity Monitor offers other useful features. For instance, you can use the “Memory Pressure” graph to monitor overall memory usage and determine if your system is experiencing any memory constraints.
If you want more detailed information about memory usage, you can explore the “System Memory” section, which provides insights into memory pressure, page ins and outs, swap usage, and more.
Activity Monitor is a valuable tool for Mac users to keep an eye on RAM usage, identify memory-intensive applications, and troubleshoot any performance issues related to memory allocation. By understanding how your system utilizes memory resources, you can optimize its performance and ensure a smooth and efficient user experience.
Method 3: System Monitor (Linux)
Linux users have access to the System Monitor utility, which provides detailed information about various system resources, including RAM usage. System Monitor allows you to monitor your system’s performance in real-time and offers insights into the processes and applications that are utilizing your computer’s memory.
The way to access System Monitor may vary depending on the Linux distribution you are using. In most cases, you can find it in the system menu or by searching for “System Monitor” in the applications menu.
Once you open the System Monitor, navigate to the “Resources” tab or similar section that displays memory-related information. Here, you will find details about your total installed RAM, as well as the current usage and percentage of memory being occupied.
The System Monitor provides a graphical representation of memory usage, allowing you to track the changes over time. You can also view the memory usage of individual processes, sorted by their resource consumption.
Furthermore, System Monitor provides additional information such as swap usage and cache utilization. Swap memory is used when the system runs out of physical memory, and cache memory contains cached data from recently accessed files for faster retrieval.
By monitoring RAM usage through System Monitor, Linux users can gain insights into how their system utilizes memory resources. This information can be invaluable for optimizing performance, identifying memory-intensive applications, and troubleshooting any issues related to memory allocation.
In addition to System Monitor, Linux users also have the option to use command-line tools like “top” or “htop” to monitor memory usage. These tools provide a real-time overview of CPU, memory, and other system resources, allowing for efficient monitoring and troubleshooting.
With the help of System Monitor and other command-line tools, Linux users can easily keep track of their RAM usage and take necessary actions to maintain optimal performance and productivity.
Method 4: Resource Monitor (Windows)
Windows users can utilize the Resource Monitor tool to get a more in-depth view of their system’s resource usage, including RAM. Resource Monitor provides detailed information about memory usage and helps you identify processes that are consuming an excessive amount of memory.
To open Resource Monitor, you can either search for it in the Windows search bar or open Task Manager (by right-clicking on the taskbar or pressing “Ctrl + Shift + Esc”) and click on the “Performance” tab. Then, click on the “Open Resource Monitor” button at the bottom of the window.
Once Resource Monitor is open, navigate to the “Memory” tab to view memory-related information. Here, you will find details such as the total amount of installed memory, the amount currently in use, and the amount used by each process.
Resource Monitor provides a graphical representation of memory usage, displaying the memory usage of individual processes in a clear and intuitive way. You can sort the processes by different criteria, such as memory usage or CPU usage, to quickly identify any resource-intensive applications.
Additionally, Resource Monitor offers insight into various memory-related details, such as the hard faults/sec, which indicates the rate at which the system is using the hard drive to supplement physical memory. This information can help you identify potential memory-related performance issues.
Resource Monitor also includes a “Memory” section that provides detailed information about different memory types, including standby memory, modified memory, and the amount of memory used for caching. This helps you understand how memory is allocated and utilized by your system.
By using Resource Monitor, Windows users can gain deeper insights into their system’s memory usage, identify resource-intensive processes, and troubleshoot any performance issues related to RAM allocation. This tool empowers users to optimize their computer’s performance by efficiently managing memory resources.
With the comprehensive information provided by Resource Monitor, Windows users can make informed decisions about memory usage, ensuring smooth and efficient operation of their systems.
Method 5: Terminal Command (Mac, Linux)
For users comfortable with command-line interfaces, both Mac and Linux operating systems offer a convenient method to check RAM usage using terminal commands. These commands provide quick and straightforward ways to obtain information about memory usage.
On both Mac and Linux systems, you can use the “free” command in the terminal to check memory usage. Simply open the terminal application and type “free -h” (without the quotes) followed by pressing enter.
The “free” command provides information about total memory, used memory, free memory, shared memory, and cached memory. By default, the values are displayed in bytes, but using the “-h” option, as described above, will present the values in a more human-readable format, such as gigabytes or megabytes.
In addition to the “free” command, Linux users can utilize the “top” or “htop” commands to view memory usage in real-time. These commands display a list of running processes, including their memory consumption. The memory usage is displayed as a percentage, allowing for quick identification of memory-intensive processes.
Command-line tools provide a lightweight and efficient way to check RAM usage without the need for graphical interfaces. They can be particularly useful for users who prefer to work in the terminal or need to check memory usage remotely through SSH connections.
By utilizing terminal commands, Mac and Linux users have a convenient and powerful method to monitor their system’s memory usage. These commands provide essential information about memory utilization, helping users optimize performance and troubleshoot potential issues related to memory allocation.
Whether you prefer the simplicity of the “free” command or the real-time monitoring capabilities of “top” and “htop,” terminal commands offer a flexible and efficient solution for tracking RAM usage on Mac and Linux systems.
Conclusion
Monitoring the amount of RAM being used on your computer is essential for optimizing performance and troubleshooting potential issues. Whether you are a Windows user relying on the Task Manager or a Mac user utilizing the Activity Monitor, there are various built-in tools available to help you track your system’s memory usage.
For Windows users, the Task Manager provides a simple and accessible way to check RAM usage, offering insights into overall memory consumption and individual process usage. Meanwhile, Mac users can rely on the Activity Monitor, which not only provides information about memory usage but also offers additional features like memory pressure monitoring. Linux users have access to the System Monitor, allowing them to monitor RAM usage and troubleshoot performance-related problems. Additionally, command-line tools like “top” or “htop” provide a lightweight and efficient solution for checking memory usage.
By regularly monitoring and understanding how your computer utilizes memory resources, you can make informed decisions about optimizing performance, identifying resource-intensive applications, and addressing any memory-related performance issues. Whether you are a computer enthusiast, a gamer, or a professional relying on memory-intensive tasks, having a clear understanding of your system’s RAM usage is vital for a smooth and efficient computing experience.
So, choose the method that best suits your operating system and your preferences to keep tabs on your computer’s memory usage. With the ability to accurately monitor and manage RAM usage, you can ensure that your system is running optimally and maximize its overall performance.


