Introduction
In the digital realm, web browsing has become an integral part of our daily lives. Whether we are shopping online, streaming videos, or conducting research, the efficiency and performance of web browsers significantly impact our overall experience. However, there are instances when we encounter issues such as slow loading times, unresponsive pages, or unexpected errors while browsing the internet. When faced with such challenges, it becomes crucial to diagnose and resolve these issues effectively.
One powerful tool that aids in troubleshooting web browsing problems is the HTTP Archive (HAR) file. This file type contains a log of a web browser's interaction with a site, including details about each request and response. By generating a HAR file, users can gain valuable insights into the network traffic, resource loading, and potential errors encountered during their browsing sessions.
In this article, we will delve into the process of generating a HAR file specifically in the Google Chrome browser. We will explore the significance of HAR files, the reasons for generating them, and the step-by-step procedure to create and analyze these files. By understanding the intricacies of HAR files and their generation, users can effectively collaborate with developers and support teams to diagnose and resolve web browsing issues.
Let's embark on this journey to unravel the power of HAR files and discover how they can empower users to enhance their browsing experiences.
What is a HAR file?
A HTTP Archive (HAR) file is a log of a web browser's interaction with a specific website. It contains a comprehensive record of all the network requests and responses made by the browser while loading the web page. This includes details such as URLs, request and response headers, cookies, timings, and other relevant information. Essentially, a HAR file provides a detailed snapshot of the browser's activity, offering valuable insights into the performance and behavior of a web page.
When a user accesses a website, the browser sends multiple requests to the web server to fetch various resources such as HTML, CSS, JavaScript, images, and other media files. Each of these requests is logged in the HAR file, along with associated metadata such as the time taken to initiate the request, the time required to receive a response, and any potential errors encountered during the process.
The HAR file serves as a powerful diagnostic tool, enabling users to analyze the network traffic and pinpoint potential issues that may be impacting the performance of a website. By examining the contents of the HAR file, developers and support teams can identify bottlenecks, latency issues, or errors that could be causing slow page load times, unresponsive elements, or other browsing-related issues.
Furthermore, HAR files are instrumental in facilitating effective communication between users and technical support teams. By sharing the HAR file with developers or support personnel, users can provide a detailed overview of their browsing experience, allowing the technical experts to gain a deeper understanding of the underlying issues and formulate targeted solutions.
In essence, a HAR file serves as a comprehensive record of a web browsing session, shedding light on the intricate details of network interactions and resource loading. By leveraging the insights gleaned from HAR files, users can collaborate with technical experts to diagnose and resolve web browsing issues, ultimately enhancing the overall browsing experience.
Why generate a HAR file in Chrome?
Generating a HAR file in Chrome can be immensely beneficial when troubleshooting web browsing issues or seeking to optimize website performance. Here are several compelling reasons why generating a HAR file in Chrome is a valuable practice:
-
Diagnosing Network Issues: When encountering slow page load times, intermittent errors, or unresponsive website elements, generating a HAR file in Chrome allows users to gain deep insights into the network interactions. By examining the recorded requests and responses, users can identify potential network bottlenecks, DNS resolution delays, or connectivity issues that may be impacting the browsing experience.
-
Analyzing Resource Loading: Websites often rely on a multitude of resources such as images, scripts, stylesheets, and external content. Generating a HAR file in Chrome provides a detailed breakdown of the time taken to load each resource, potential errors encountered during the process, and the sequence of resource loading. This information is invaluable for optimizing website performance and addressing issues related to slow resource loading or failed requests.
-
Identifying Third-Party Dependencies: Many websites integrate third-party services, such as analytics scripts, social media plugins, or advertising networks. These external dependencies can significantly impact the overall performance of a website. By generating a HAR file in Chrome, users can discern the impact of third-party resources on the page load times and identify any potential conflicts or performance bottlenecks arising from these dependencies.
-
Troubleshooting Cross-Origin Issues: Cross-origin resource sharing (CORS) issues can arise when a web page attempts to fetch resources from a different domain. Such issues can lead to blocked requests or unexpected errors. By generating a HAR file in Chrome, users can pinpoint any CORS-related problems, including preflight requests, response headers, and potential access control issues, thereby facilitating effective troubleshooting and resolution.
-
Collaborating with Developers and Support Teams: When seeking assistance from web developers or technical support teams, providing a HAR file can significantly expedite the troubleshooting process. The detailed network log contained within the HAR file equips developers with precise information about the browsing session, enabling them to replicate the user's experience and diagnose underlying issues effectively.
In essence, generating a HAR file in Chrome empowers users to delve into the intricate details of their web browsing sessions, enabling them to diagnose network issues, optimize resource loading, and collaborate with technical experts to enhance the overall browsing experience. This proactive approach to issue resolution can lead to improved website performance and a more seamless browsing experience for users.
Steps to generate a HAR file in Chrome
Generating a HAR file in Chrome is a straightforward process that can provide valuable insights into the network activity and resource loading associated with a web browsing session. By following these steps, users can capture a detailed log of their browser's interactions with a specific website, facilitating effective troubleshooting and performance optimization.
-
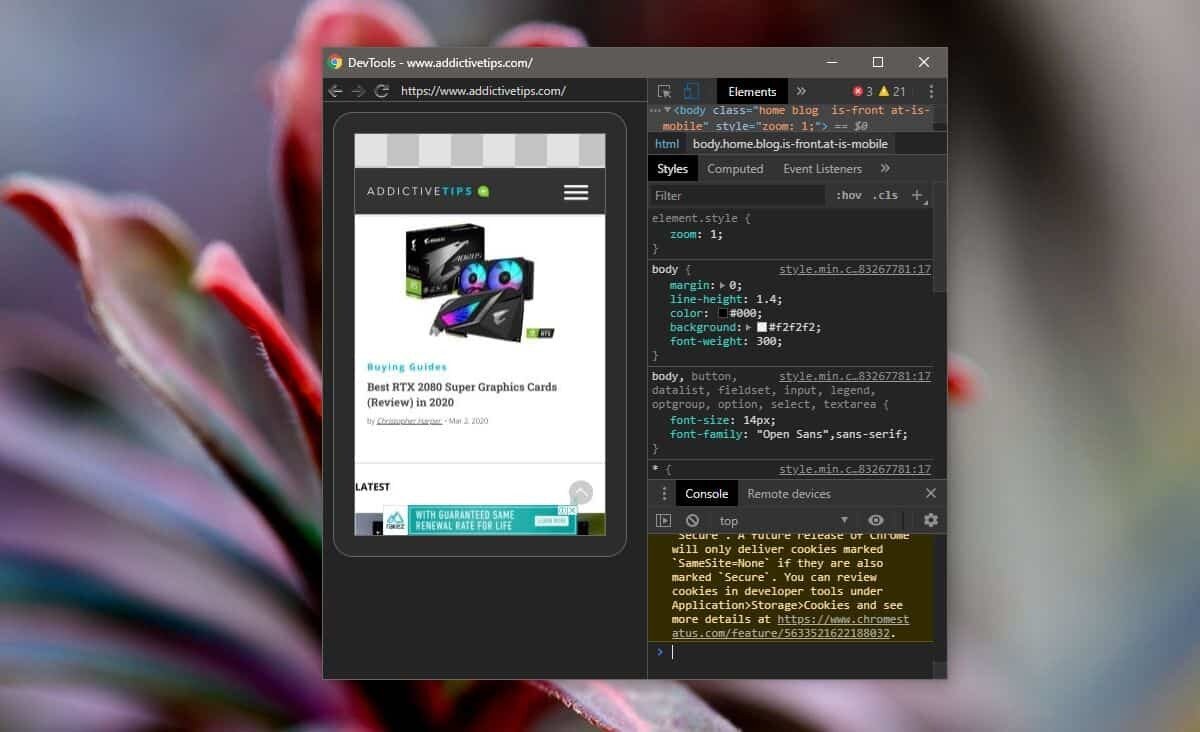
Open Chrome Developer Tools: To initiate the process of generating a HAR file, start by opening the Chrome browser and navigating to the web page for which you want to capture the network activity. Once on the desired web page, access the Chrome Developer Tools by either right-clicking on the page and selecting "Inspect" or pressing "Ctrl + Shift + I" (Windows/Linux) or "Cmd + Option + I" (Mac) on your keyboard.
-
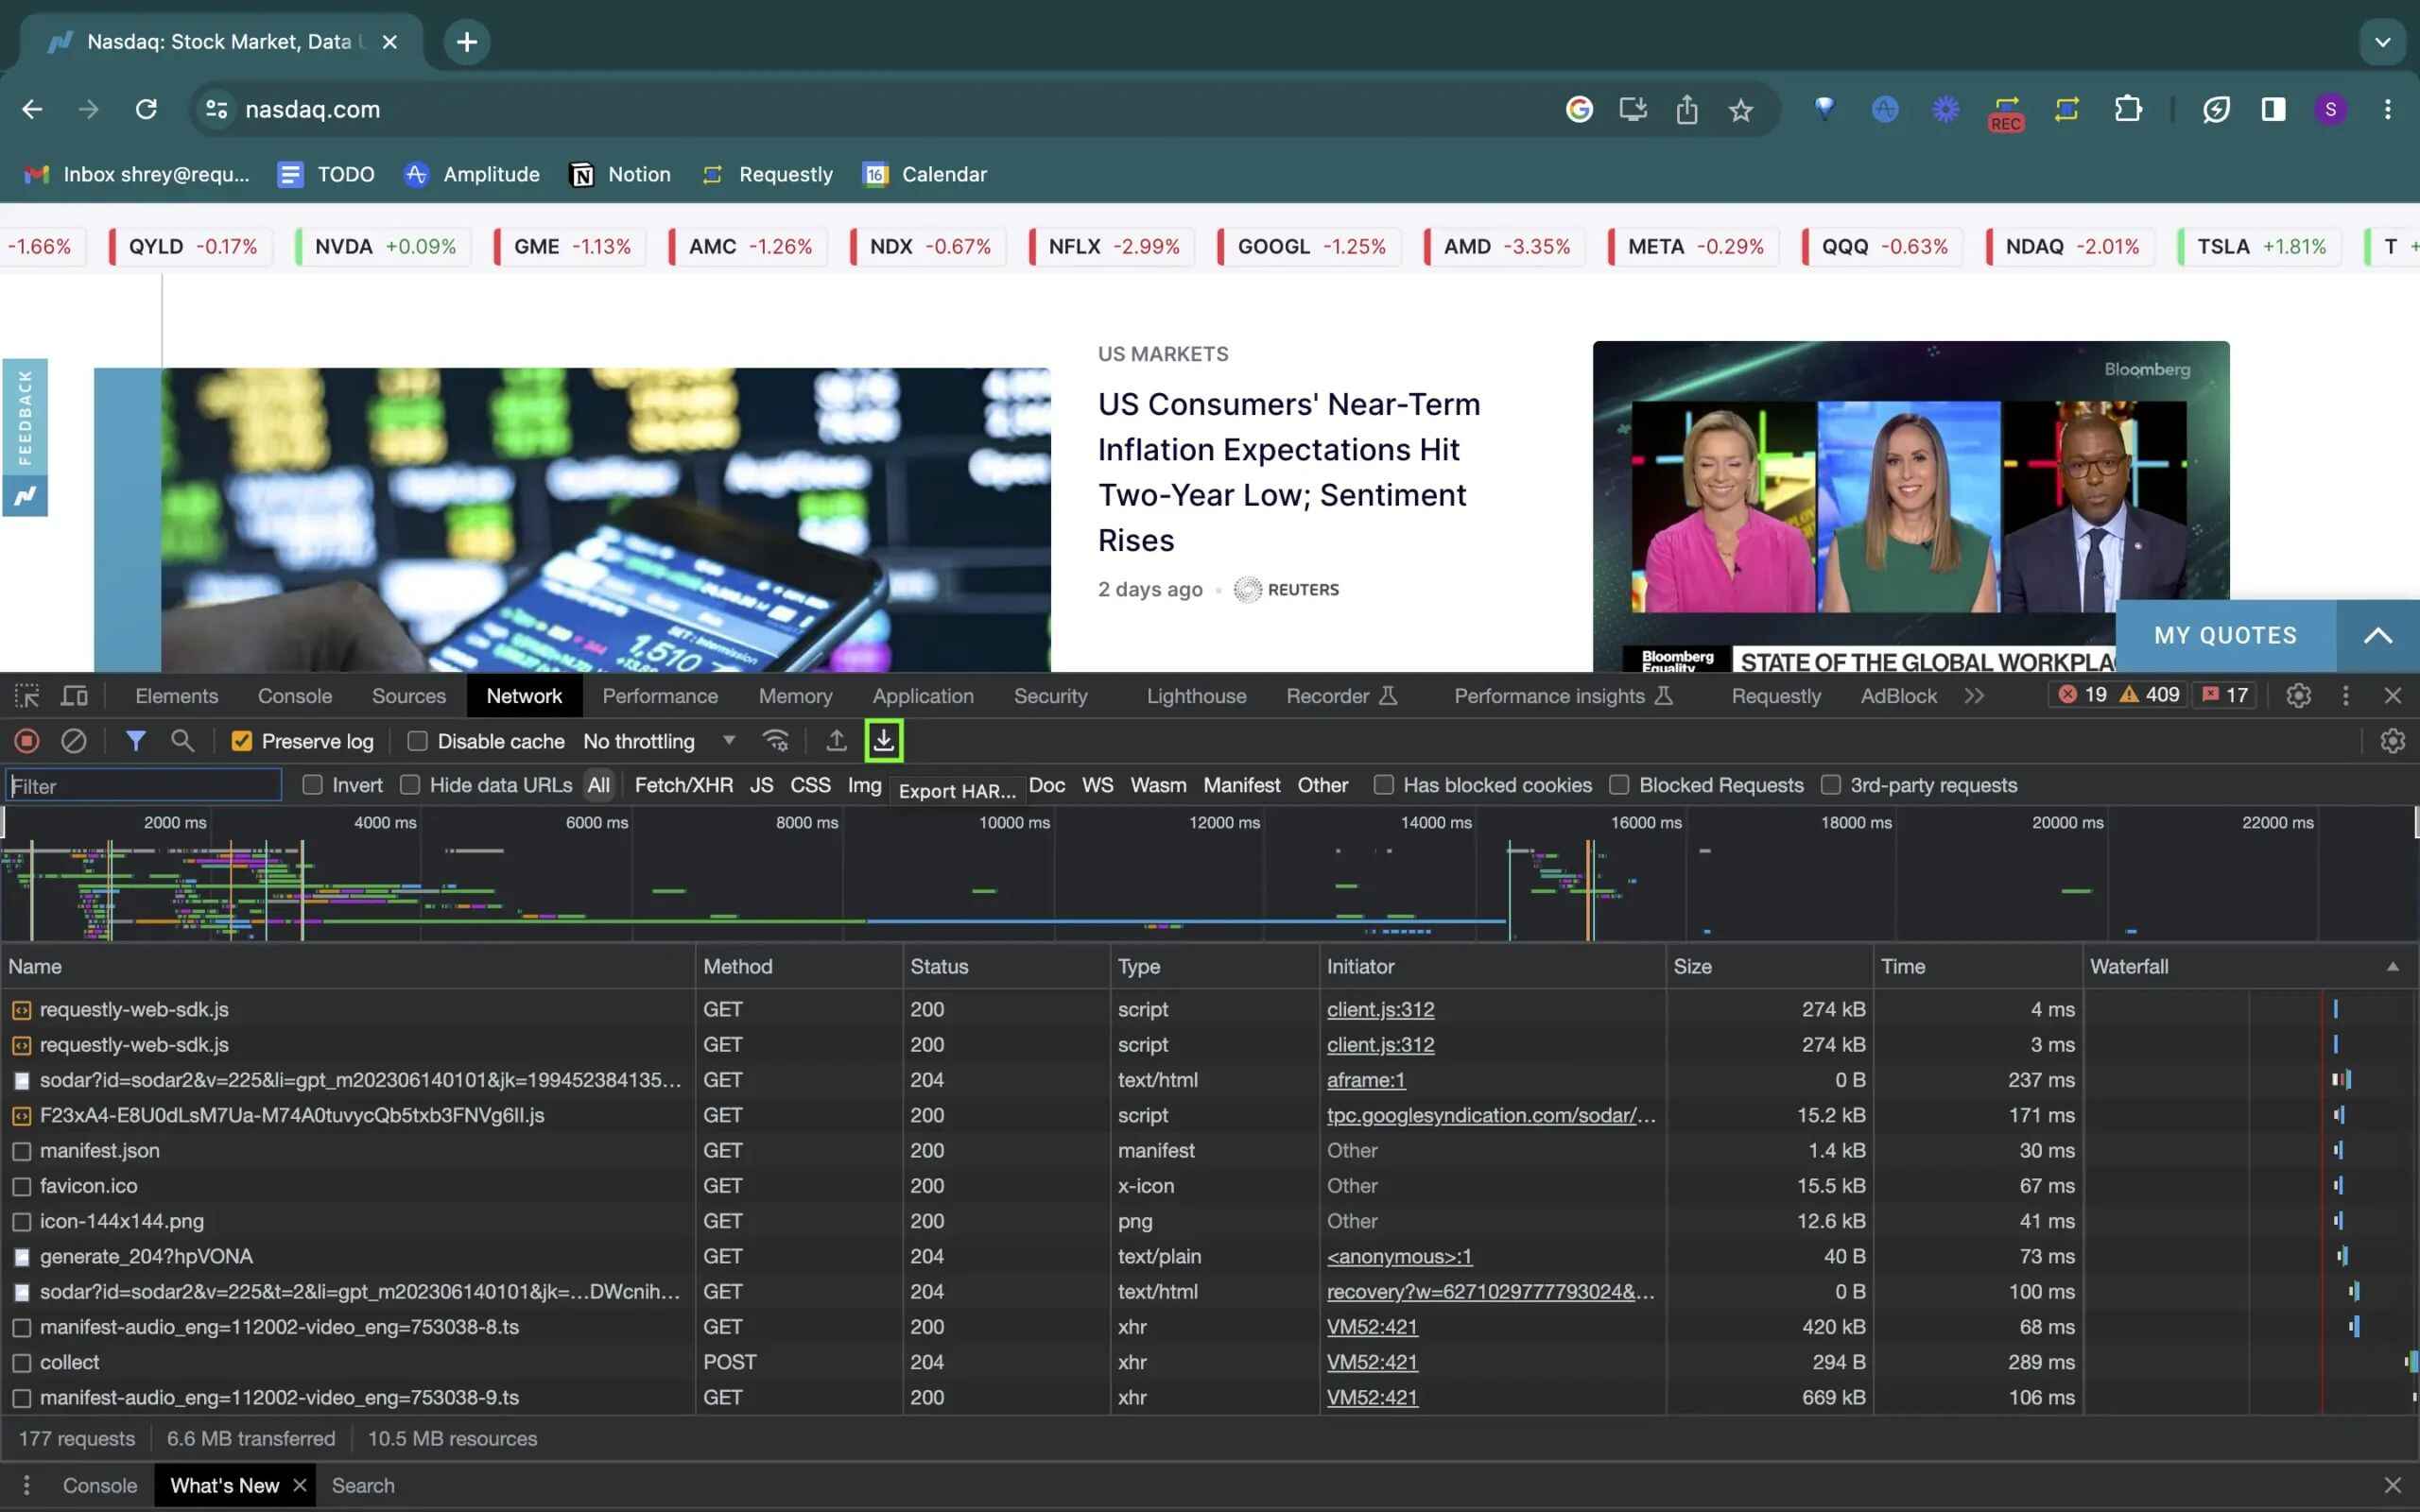
Access the Network Tab: Within the Chrome Developer Tools interface, locate and click on the "Network" tab. This tab provides a comprehensive overview of the network activity associated with the web page, including details about each request and response made by the browser.
-
Initiate Network Recording: With the Network tab open, ensure that the "Record" button, typically represented by a circular icon, is active. This button enables Chrome to start recording the network activity as you interact with the web page. If the button is not active, click on it to commence the recording process.
-
Reload the Web Page: Once the network recording is initiated, reload the web page by either pressing "Ctrl + R" (Windows/Linux) or "Cmd + R" (Mac) or by clicking the browser's refresh button. This action triggers the browser to fetch all the resources associated with the web page, capturing the network interactions in the process.
-
Stop Network Recording: After the web page has finished loading and the browser has captured the relevant network activity, return to the Chrome Developer Tools interface and click on the "Stop" button within the Network tab. This action halts the network recording process, finalizing the capture of the browser's interactions with the web page.
-
Export the HAR File: To save the captured network activity as a HAR file, right-click anywhere within the Network tab and select the "Save as HAR with Content" option. Choose a suitable location on your computer to save the HAR file and provide a descriptive filename for easy reference.
By following these steps, users can effectively generate a HAR file in Chrome, capturing a detailed log of the browser's network activity during a specific web browsing session. This HAR file can then be shared with developers or support teams to facilitate collaborative troubleshooting and performance optimization, ultimately enhancing the browsing experience for users.
Analyzing the HAR file
Upon successfully generating a HAR file in Chrome, users gain access to a wealth of valuable data encapsulating the intricate details of the browser's interactions with a specific website. Analyzing the contents of the HAR file is a pivotal step in diagnosing potential issues, optimizing website performance, and collaborating with technical experts to enhance the overall browsing experience.
The HAR file, typically saved with a .har extension, can be opened using various tools designed for HAR file analysis. One popular option is to utilize the built-in HAR Viewer within the Chrome Developer Tools, which provides a user-friendly interface for visualizing and interpreting the captured network activity.
When analyzing the HAR file, users can glean insights into several key aspects of the web browsing session, including:
-
Network Requests and Responses: The HAR file contains a detailed log of each network request made by the browser, along with the corresponding responses from the web server. Users can review the timing and sequence of these requests, identify potential errors or failed requests, and assess the overall efficiency of the network interactions.
-
Resource Loading Times: By examining the HAR file, users can ascertain the time taken to load individual resources such as HTML, CSS, JavaScript, images, and other media files. This information is instrumental in identifying slow-loading resources, optimizing resource delivery, and mitigating performance bottlenecks.
-
Request and Response Headers: The HAR file includes comprehensive details about the headers associated with each request and response. Users can scrutinize these headers to understand the communication between the browser and the web server, identify any caching directives or compression settings, and assess the overall efficiency of the network communication.
-
Timing and Latency Metrics: Detailed timing metrics within the HAR file provide users with a granular view of the network latency, DNS resolution times, TCP connection establishment, SSL negotiation, and other timing-related aspects. By analyzing these metrics, users can pinpoint potential latency issues and optimize the overall network performance.
-
Error Identification: The HAR file captures any errors encountered during the network interactions, including status codes, error messages, and potential connectivity issues. Users can leverage this information to diagnose and troubleshoot errors, such as 404 Not Found or 50x Server Errors, thereby facilitating targeted resolution efforts.
In essence, analyzing the HAR file empowers users to delve into the intricate details of their web browsing sessions, enabling them to diagnose network issues, optimize resource loading, and collaborate with technical experts to enhance the overall browsing experience. By leveraging the insights gleaned from the HAR file, users can effectively communicate their browsing experiences to developers and support teams, facilitating targeted troubleshooting and performance optimization efforts.
Conclusion
In conclusion, the generation and analysis of HAR files in the Google Chrome browser offer a powerful avenue for users to gain deep insights into their web browsing experiences. By capturing a comprehensive log of network interactions, resource loading times, and potential errors, HAR files serve as invaluable tools for diagnosing issues, optimizing website performance, and collaborating with technical experts to enhance the overall browsing experience.
The significance of HAR files lies in their ability to provide a detailed and transparent view of the browser's interactions with a specific website. Through the captured network activity, users can identify potential bottlenecks, latency issues, and errors that may be impacting the performance and responsiveness of web pages. This level of visibility equips users with the necessary information to communicate effectively with developers and support teams, facilitating targeted troubleshooting and resolution efforts.
Furthermore, the process of generating a HAR file in Chrome is relatively straightforward, empowering users to capture a detailed snapshot of their browsing sessions with minimal effort. By following the outlined steps to initiate network recording, reload the web page, and export the HAR file, users can proactively capture the network activity and share it with relevant stakeholders for collaborative analysis.
The analysis of HAR files enables users to delve into the intricate details of their web browsing sessions, empowering them to identify network-related issues, optimize resource loading, and gain a deeper understanding of the underlying factors impacting website performance. Whether it involves diagnosing slow page load times, identifying third-party dependencies, or troubleshooting cross-origin issues, the insights gleaned from HAR file analysis can pave the way for targeted and effective solutions.
In essence, the utilization of HAR files in Chrome represents a proactive approach to addressing web browsing issues and optimizing website performance. By leveraging the power of HAR files, users can collaborate with technical experts, communicate their browsing experiences effectively, and contribute to the continuous improvement of web browsing experiences for themselves and others.
In the ever-evolving digital landscape, the ability to capture, analyze, and leverage HAR files in Chrome stands as a testament to the proactive and collaborative nature of issue resolution and performance optimization in web browsing. As users continue to harness the potential of HAR files, the collective effort to enhance the browsing experience is propelled forward, ultimately leading to more seamless, efficient, and enjoyable web interactions for all.